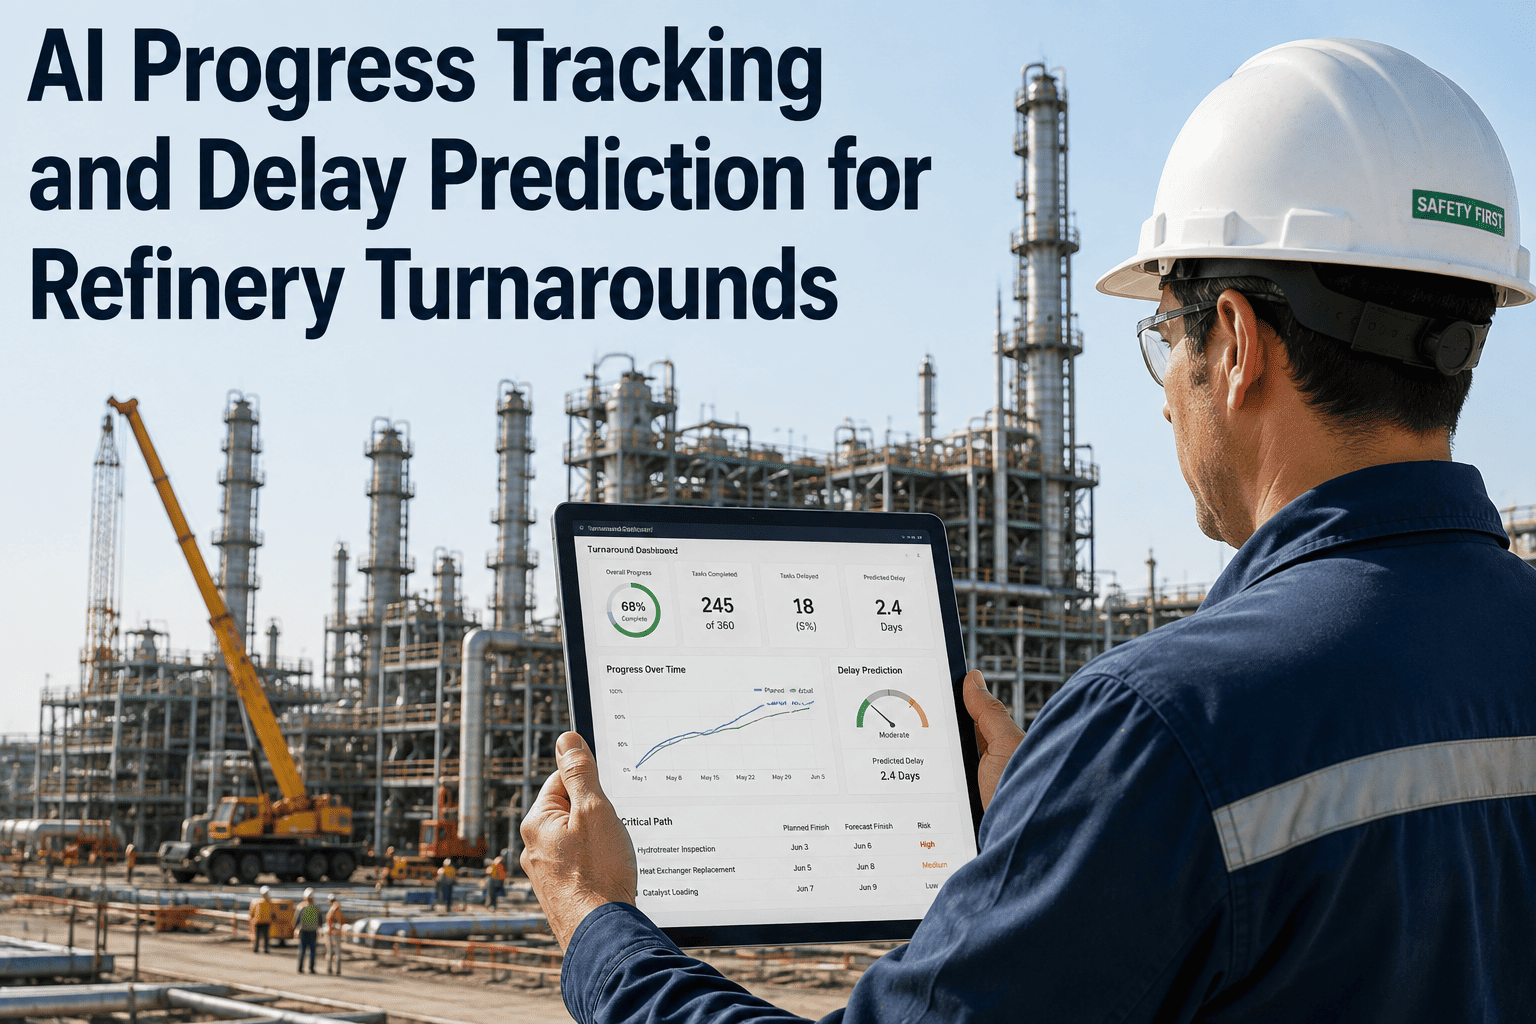
A turnaround schedule slips two hours on day one. Nobody notices, because two hours does not trigger any alarm in a system built around daily status meetings. By day four, that discipline is running a day and a half behind, still invisible until the weekly progress review pulls the numbers together — and by then the only options left are overtime, added crews, or trading scope, all more expensive than the conversation that could have happened on day one. AI progress tracking watches work completion against schedule continuously, predicts which disciplines are heading toward a critical path overrun up to 48 hours before it becomes unrecoverable, and recommends where to reallocate resources while the fix is still cheap. Book a demo to see delay prediction running against a live turnaround schedule.
TURNAROUND OPTIMIZATION · PROGRESS TRACKING · DELAY PREDICTION
Catch a Slipping Turnaround Schedule 48 Hours Before It Threatens the Critical Path
Continuous monitoring of work completion against plan, combined with predictive models trained on how delays historically cascade through a schedule, flags emerging overruns while resource reallocation is still a cheap, routine decision instead of an expensive recovery effort.
48 Hrs
Typical Early-Warning Window Before a Predicted Overrun Reaches the Critical Path
Continuous
Monitoring vs Daily or Weekly Status Meeting Reporting Cycles
3
Levels of Response Recommended — Monitor, Reallocate, or Escalate
WHY DELAYS GO UNNOTICED UNTIL THEY'RE EXPENSIVE
The Reporting Lag That Turns a Minor Slip Into a Schedule Emergency
Most turnaround progress tracking still runs on a reporting cadence built around human meetings — shift handovers, daily standups, weekly leadership reviews. Each of these cadences introduces a lag between when a discipline actually starts falling behind and when that information reaches someone with the authority to act on it. A two-hour slip on a Monday morning task is invisible to a Wednesday status meeting unless someone specifically flags it, and most two-hour slips do not get flagged, because in isolation they look like normal day-to-day variance rather than the start of a trend.
The real cost is not the delay itself — it is the compounding. A task running behind delays the tasks sequenced after it, which delays the tasks after those, and by the time a reporting cycle finally surfaces the problem, the recovery options have narrowed from "shift a crew for a few hours" to "add overtime shifts for a week" or worse, "trade scope to protect the restart date." Delay prediction exists specifically to catch the problem while it is still in the cheap-to-fix stage.
HOW DELAY PREDICTION WORKS
From Raw Completion Data to a 48-Hour Warning
01
Continuous Completion Tracking
Task status updates flow in as crews close out digital work packs and inspection milestones, replacing periodic manual status collection with a constantly current picture.
02
Deviation Detection Against Baseline
Actual completion pace for each discipline is compared continuously against the planned schedule, flagging deviations as soon as they emerge rather than at the next reporting checkpoint.
03
Cascade Prediction
Models trained on how delays have historically propagated through similar schedules estimate whether a current deviation is likely to reach the critical path, and when.
04
Resource Reallocation Recommendations
When a predicted overrun crosses a meaningful threshold, the system recommends specific interventions — crew reallocation, sequencing changes, or expedited material sourcing — sized to the actual severity of the predicted slip.
RESPONSE LEVELS
Not Every Deviation Needs the Same Response
A core design principle behind useful delay prediction is avoiding alert fatigue — flooding coordinators with warnings about every minor variance trains people to ignore all of them, including the ones that matter. Predicted deviations are instead classified into response tiers matched to actual severity and likely schedule impact.
MONITOR
Minor deviation within normal variance range, logged for visibility but requiring no immediate action beyond continued tracking.
REALLOCATE
Predicted to reach the critical path within the warning window if uncorrected — a specific, sized recommendation for crew or sequencing adjustment is generated.
ESCALATE
Severity or cascading risk high enough to require leadership visibility and a coordinated cross-discipline response beyond routine reallocation.
See a Problem While It's Still a Two-Hour Conversation, Not a Two-Day Crisis
Get a live look at how delay prediction would have flagged deviations on your most recent turnaround.
WHAT FEEDS THE PREDICTION MODEL
Data Sources Behind an Accurate 48-Hour Forecast
Prediction accuracy depends on the quality and immediacy of the data feeding the model — a delay forecast built on stale or incomplete status information is not meaningfully better than the reporting-cycle lag it is meant to replace.
Digital Work Pack Completions
Task-level completion timestamps from digital work packs provide the most granular and current view of actual progress against the plan.
Inspection and NDE Status
Real-time inspection clearance status identifies when downstream trades are being held up waiting on findings, a common and often underestimated delay source.
Crew and Equipment Availability
Current crew assignments and equipment allocation inform which reallocation recommendations are actually feasible given real resource constraints.
Historical Delay Cascade Patterns
Prior turnaround data on how specific types of delays historically propagated through the schedule trains the model on realistic cascade timing rather than generic assumptions.
COORDINATOR EXPERIENCE
What Changes for the Turnaround Coordinator on a Day-to-Day Basis
The coordinator role does not disappear behind a dashboard — it shifts from spending a meaningful portion of the day collecting and reconciling status updates from multiple disciplines toward reviewing prioritized recommendations and deciding which interventions to act on. That shift matters because status collection, while necessary, is not where a coordinator's judgment adds the most value; deciding how to respond to a genuine emerging problem is.
Coordinators who have worked both ways typically describe the difference less in terms of workload reduction and more in terms of where their attention goes. Instead of splitting focus across dozens of disciplines to catch problems through general vigilance, the prioritized alert list lets them concentrate deliberate attention on the two or three situations the model has flagged as actually needing a decision that day, while trusting the system to keep watching everything else.
FREQUENTLY ASKED QUESTIONS
Questions Turnaround Coordinators Ask About Delay Prediction
How accurate is a 48-hour delay prediction in practice?
Accuracy depends on how much historical schedule and cascade data the model has been trained on for the specific plant and turnaround type, with accuracy generally improving after the first one or two cycles as the model learns the plant's specific delay patterns rather than relying solely on general industry data. Predictions are presented with confidence levels rather than as absolute certainties, so coordinators can weigh a high-confidence warning differently from a lower-confidence one when deciding how urgently to respond.
Book a demo to review accuracy benchmarks for similar turnaround types.
Does this replace the daily progress meeting, or work alongside it?
Most teams keep daily and weekly meetings for cross-discipline coordination and decision-making, but the meetings themselves change character — instead of spending the first half of the meeting reconstructing what happened since the last one, the team starts from a current, agreed-upon status and spends the time discussing what to do about flagged issues. The continuous tracking does not eliminate the value of people talking to each other; it removes the status-reconstruction overhead that used to consume much of that time.
Contact support to see how tracking data feeds into existing meeting structures.
What happens if a reallocation recommendation isn't actually feasible given real constraints?
Recommendations are generated against known crew and equipment availability data, but the coordinator always makes the final call, and the system is designed to present the reasoning behind a recommendation so the coordinator can quickly identify if a constraint the model wasn't aware of makes it impractical. Rejected recommendations and the reason for rejection feed back into the model, improving the relevance of future suggestions for that specific plant's operating constraints.
Book a session to review how recommendations account for real-world constraints.
Can delay prediction help with turnaround planning before the shutdown even starts?
Yes — the same cascade modeling used during execution can run against a proposed schedule before the shutdown begins, identifying sequencing decisions that carry higher inherent delay-propagation risk so planners can address them proactively rather than discovering the vulnerability only once the schedule is already live and a delay actually occurs. This pre-shutdown use is often where plants get their first exposure to the model's logic before relying on it for live decisions.
Talk to support about running a pre-shutdown schedule risk review.
How much historical data does a plant need before delay prediction becomes useful?
A plant with detailed digital records from even one or two prior turnarounds can get a useful baseline model, since much of the cascade logic generalizes reasonably well from industry-wide patterns while the plant-specific data refines it over successive cycles. Plants without well-organized digital turnaround records benefit from a data consolidation step first, but this is typically a one-time investment that continues paying off on every subsequent turnaround rather than needing to be repeated.
Book a demo to assess data readiness for your plant's turnaround history.
CONTINUOUS TRACKING · EARLY WARNING · SIZED RECOMMENDATIONS
Stop Finding Out About Schedule Slips at the Weekly Meeting
See how continuous progress tracking and cascade prediction give your team a 48-hour head start on the next turnaround.