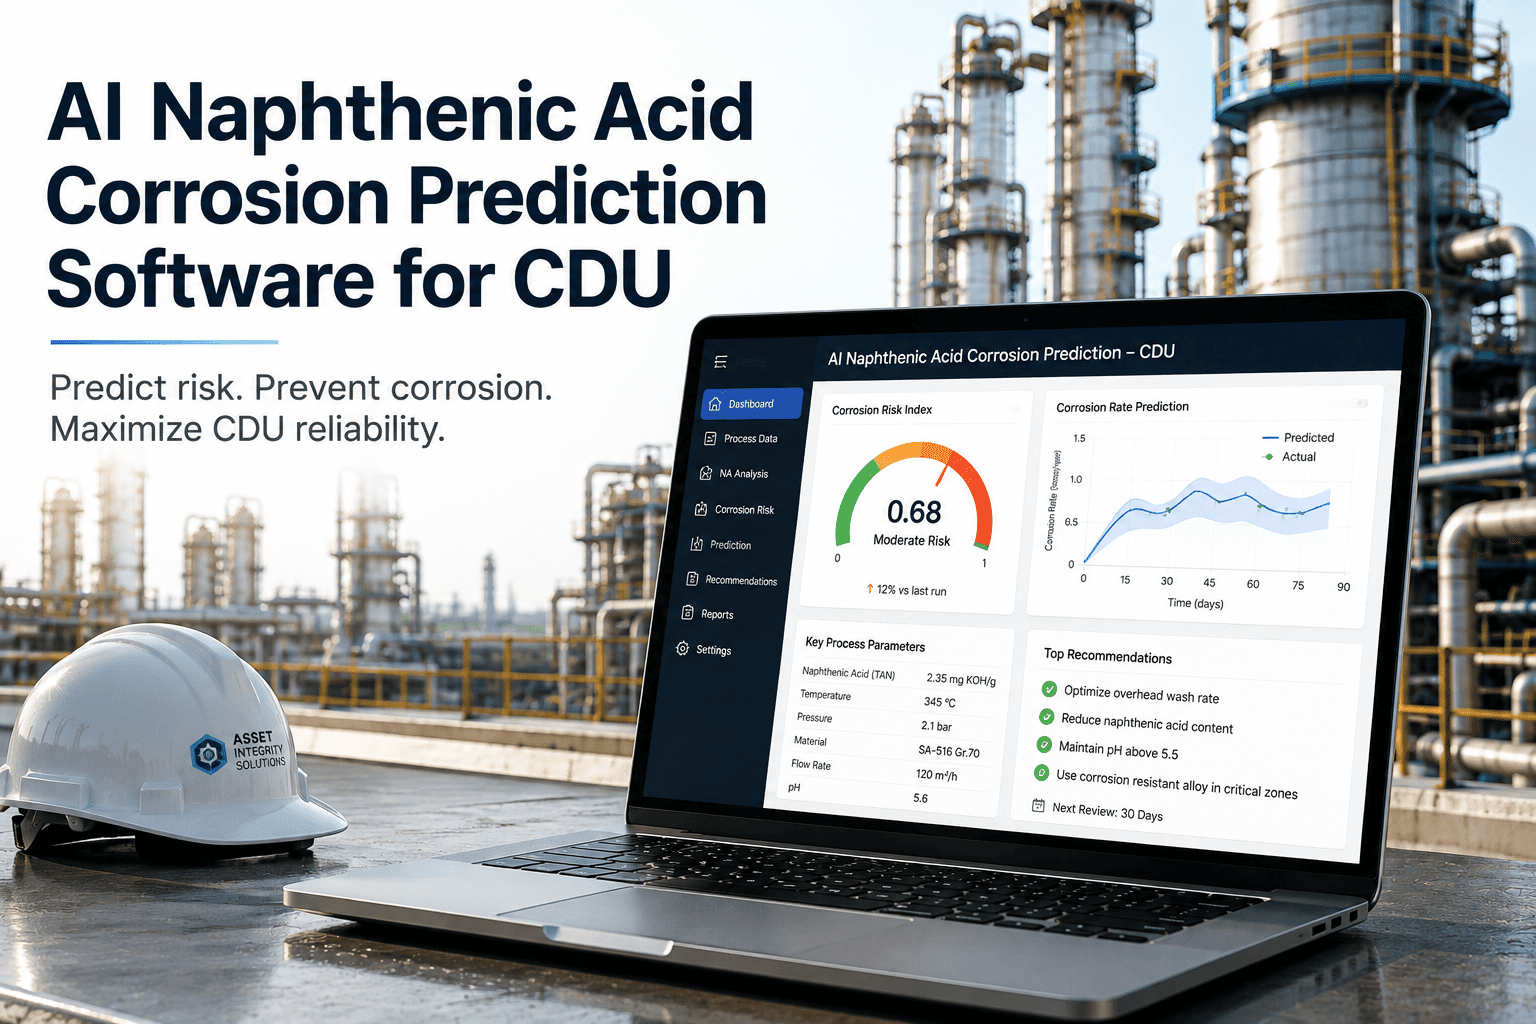
A typical refinery corrosion program is really three separate programs pretending to be one. Condition monitoring locations track wall thickness by ultrasonic testing on a fixed inspection interval. Electrical resistance and linear polarization probes report near-continuous corrosion rate data from a handful of critical circuits. Corrosion coupons sit exposed in process streams for weeks at a time and get pulled, weighed, and logged separately from either of the other two. Each data source lives in its own spreadsheet, follows its own schedule, and rarely gets reconciled against the others until an inspector needs to justify an interval change. Talk to support about what it looks like to run all three as one connected corrosion program instead of three disconnected ones.
CMLs, Corrosion Probes, and Coupon Stations Are Measuring the Same Corrosion From Three Different Angles. Most Programs Never Connect Them.
Every refinery already collects the data needed to predict corrosion by circuit, prioritize inspection scope, and tune chemical treatment before the next turnaround. The problem is almost never a lack of data, it is that thickness readings, probe trends, and coupon results sit in three separate systems that nobody has time to reconcile. iFactory fuses all three into one corrosion program so the data finally works together.
CMLs, Corrosion Probes, and Coupons Each Tell Part of the Story
None of the three core corrosion monitoring methods used across a refinery is wrong, each is simply answering a different question, on a different timescale, at a different level of precision. A corrosion program that treats them as interchangeable, or worse, only pays attention to whichever one happens to be easiest to pull a report from, is working with a fraction of the picture available.
The gap is not in any single method, it is in the fact that these three data streams rarely get compared against each other systematically. Published comparisons between probe readings and coupon results have found agreement within an acceptable range in well under half of paired measurements, with a meaningful share differing by two to four times over. When that kind of divergence goes unreconciled, chemical treatment decisions and inspection interval decisions end up resting on whichever single data source happened to be checked most recently, not on the fused picture all three sources could provide together.
The Corrosion Engineer's Actual Bottleneck Is Not Analysis, It Is Data Wrangling
Ask most refinery corrosion engineers what limits their program and the honest answer is rarely a lack of technical understanding. It is time. A facility running tens of thousands of CMLs across dozens of circuits, alongside a smaller but critical population of probes and coupon stations, generates far more data than any manual review process can keep current. Before a turnaround, that same engineer is often the one manually cross-checking inspection dates, corrosion rate calculations, and circuit classifications across spreadsheets that were never designed to talk to each other, time that should be spent identifying which circuits actually need attention.
This is precisely the kind of high-volume, low-judgment data reconciliation work that AI handles well, freeing the corrosion engineer to spend that reclaimed time on the decisions that actually require their expertise: which circuits are trending toward a problem, which chemical treatment adjustments are working, and which inspection scope changes are justified by the data rather than driven by whatever deadline is closest.
Stop Reconciling Three Corrosion Data Sources by Hand
iFactory connects CML thickness data, probe trends, and coupon results into one program per circuit, so your corrosion engineer spends time on judgment calls instead of spreadsheet reconciliation before every turnaround.
Predicting Corrosion Rate by Circuit Instead of by Individual Data Point
Corrosion loop or circuit classification, the approach codified in API 970, groups piping and equipment that share the same metallurgy, thermal envelope, and fluid phase, on the logic that they should also share a similar damage mechanism profile and corrosion behavior. That grouping is what makes circuit-level prediction possible in the first place, but it only works if the data feeding the model actually reflects every input relevant to that circuit's real corrosion behavior.
Fusing these four input categories at the circuit level, rather than reviewing each data source in isolation, is what allows a corrosion rate prediction to actually hold up against what shows up at the next scheduled inspection. It also surfaces circuits where the different data sources disagree meaningfully, which is often the earliest and most useful signal that something about that circuit's corrosion behavior has changed and deserves a closer look before the next code-mandated inspection interval would have caught it.
Manual Reconciliation Versus a Fused Corrosion Program
The practical difference between a manually reconciled corrosion program and an AI-fused one shows up most clearly in how each handles the routine tasks that consume a corrosion engineer's time between turnarounds.
| Program Task | Manual, Spreadsheet-Based Program | AI-Fused Corrosion Program |
|---|---|---|
| Reconciling CML, probe, and coupon data | Performed manually, typically only before a turnaround | Continuous, automatic cross-check across all three sources per circuit |
| Corrosion rate prediction | Extrapolated from the most recent CML reading alone | Modeled from combined CML, probe, and coupon trend data |
| Inspection scope prioritization | Based on fixed interval schedules and engineer judgment | Ranked by predicted corrosion rate and data source disagreement |
| Chemical treatment adjustment | Reviewed periodically against coupon results | Correlated continuously against probe trend and process conditions |
| Turnaround scope preparation | Weeks of manual data compilation and reconciliation | Circuit-level scope generated directly from the maintained data model |
The gap between these two approaches compounds over time. A manually reconciled program tends to catch problems only when the next scheduled review happens to fall at the right moment, while a continuously fused program surfaces a diverging circuit as soon as the data itself starts disagreeing, often months before a fixed inspection interval would have flagged it.
Tying Inhibitor Dosing to Actual Corrosion Rate Instead of a Fixed Schedule
Chemical treatment, whether corrosion inhibitor, neutralizer, or wash water dosing, is usually set on a schedule determined months earlier and adjusted only when a coupon result or an operational upset forces a review. That approach systematically over-treats some circuits, wasting chemical cost, while under-treating others that have quietly drifted into a higher corrosion regime since the dosing rate was last reviewed. Probe data is uniquely suited to closing this gap because it responds to a dosing change within hours or days, not the weeks a coupon exposure cycle requires.
Correlating probe trend data against dosing rate and process conditions in near real time turns chemical treatment from a periodically reviewed line item into an actively managed control loop, one that can catch both the overdosing and the underdosing failure modes before either shows up as a cost overrun or a corrosion rate excursion at the next inspection.
Building a Fused Corrosion Program Without Disrupting the Current One
Replacing an existing corrosion program outright is rarely realistic given how much institutional process is already built around it. The rollout sequence below reflects how most refineries integrate AI-fused monitoring alongside their existing inspection and chemical treatment workflows rather than replacing them wholesale.
Where Corrosion Program Optimization Efforts Fall Short
Most corrosion management initiatives that stall out are not undone by bad data or bad modeling, they are undone by a handful of avoidable structural mistakes made early in the program.
Common Questions on AI for Refinery Corrosion Management
Why do probe and coupon corrosion rates disagree so often on the same circuit?
Probes measure an instantaneous or near-continuous corrosion rate at a single fixed point, which is sensitive to short-term fluctuations in flow, temperature, and chemistry, while coupons average corrosion behavior over the full exposure period, typically weeks, smoothing out those same fluctuations into a single number. Neither measurement is wrong, they are simply answering the question over different timescales, which is exactly why published comparisons find meaningful disagreement between the two methods on a large share of paired readings. Book a demo to see how reconciled probe and coupon data looks across your circuits.
Does AI-fused corrosion monitoring replace the API 570 and API 510 inspection program?
No, it strengthens the data feeding that program rather than replacing the code-mandated inspection requirements themselves. CML thickness readings taken under API 570 and API 510 remain the authoritative record for remaining life calculation and interval scheduling, and a fused corrosion program uses probe and coupon data to prioritize where inspection attention goes and to catch drift between scheduled inspections, not to skip or substitute for the inspections themselves. Contact support to review how this fits alongside your current inspection code compliance.
How does circuit classification under API 970 affect corrosion rate prediction accuracy?
Corrosion loop or circuit classification groups piping and equipment that share metallurgy, thermal envelope, and fluid phase on the assumption that they will also share a similar damage mechanism profile, and a prediction model built on top of an incorrectly grouped circuit inherits that error directly. Revalidating circuit boundaries against actual service conditions before building predictive models on top of them is one of the highest-leverage steps in the whole program, since it affects every prediction the model produces for that circuit afterward. Book a demo to see circuit classification validation applied to your unit data.
Can this reduce chemical treatment cost, or does it mainly affect inspection scope?
It affects both, and the chemical treatment side is often where savings show up fastest, since correlating probe trend data against dosing rate and process conditions can identify circuits that are being overdosed relative to their actual corrosion rate as well as circuits that are quietly under-protected after a process change. Bringing that correlation into a continuous, per-circuit view rather than a periodic coupon-based review is what allows dosing to be tuned tighter without increasing corrosion risk. Contact support to discuss chemical treatment correlation for your program.
How long does it take to fuse existing CML, probe, and coupon data into one program?
The data consolidation phase is typically the fastest part of the process, since it involves pulling existing data into a shared circuit-level model rather than collecting new data from scratch, though the timeline depends heavily on how many separate systems the data currently lives in and how consistent circuit naming has been across those systems historically. Most refineries see a working, reconciled data model on their pilot units within the first few weeks, with circuit classification validation and prediction model tuning following as the pilot expands. Book a demo to get a timeline estimate based on your current data systems.
Your Corrosion Data Already Exists in Three Places. It's Time It Worked as One Program.
iFactory fuses CML thickness history, corrosion probe trends, and coupon results into a single circuit-level model, so inspection scope and chemical treatment decisions are driven by the full picture instead of whichever data source was checked last.