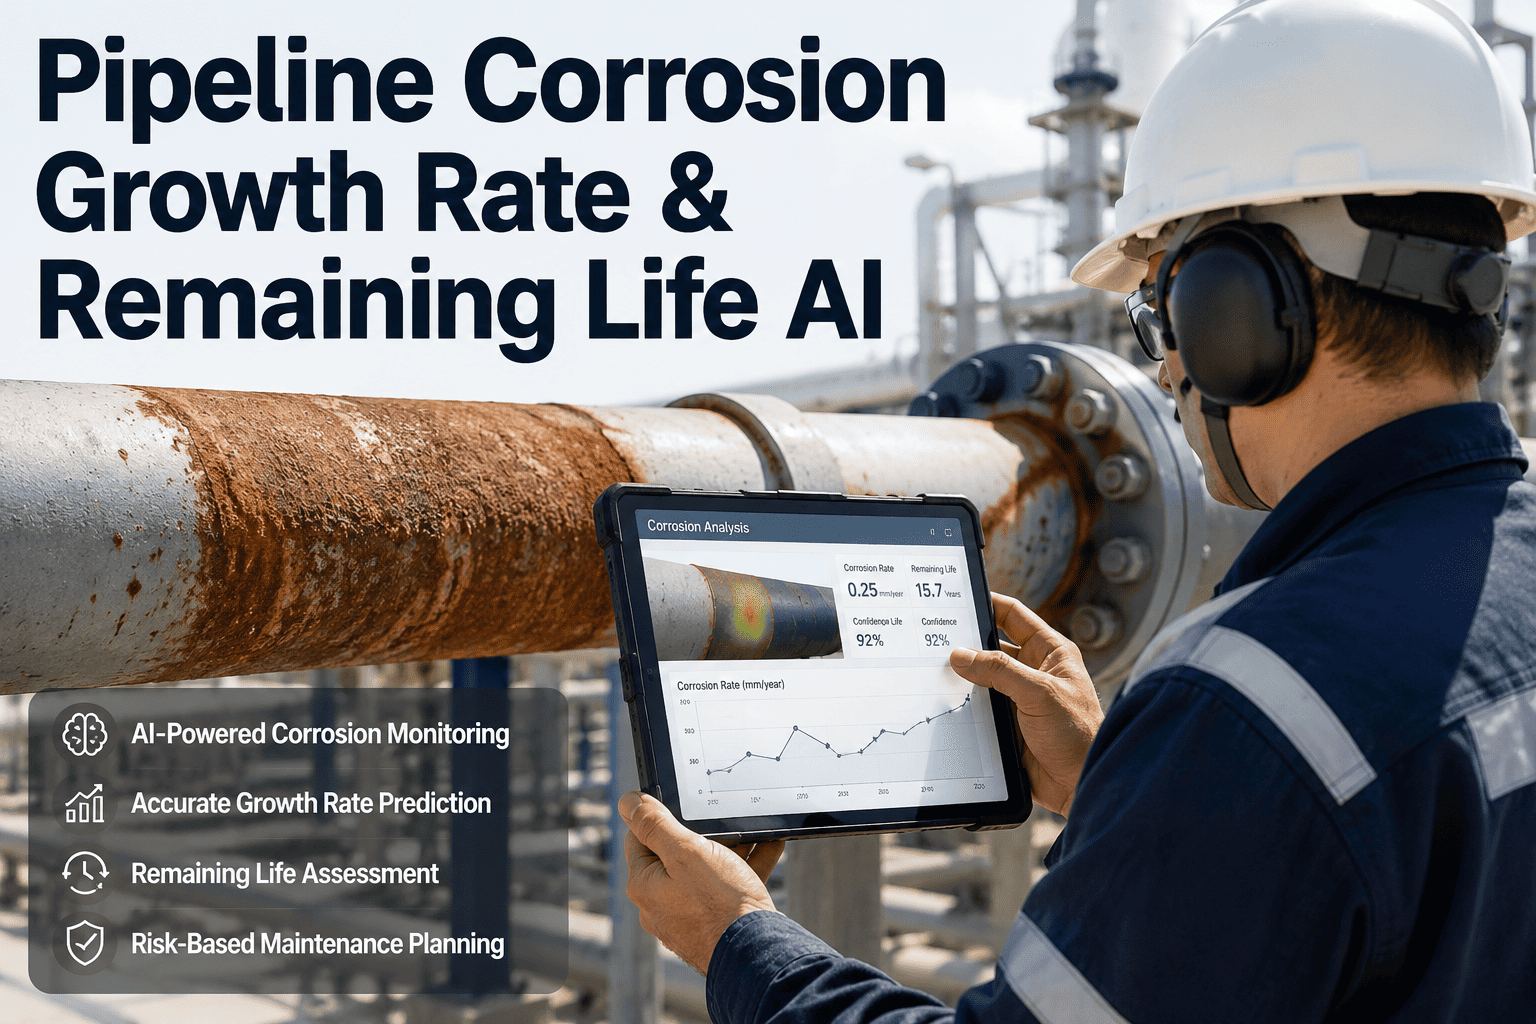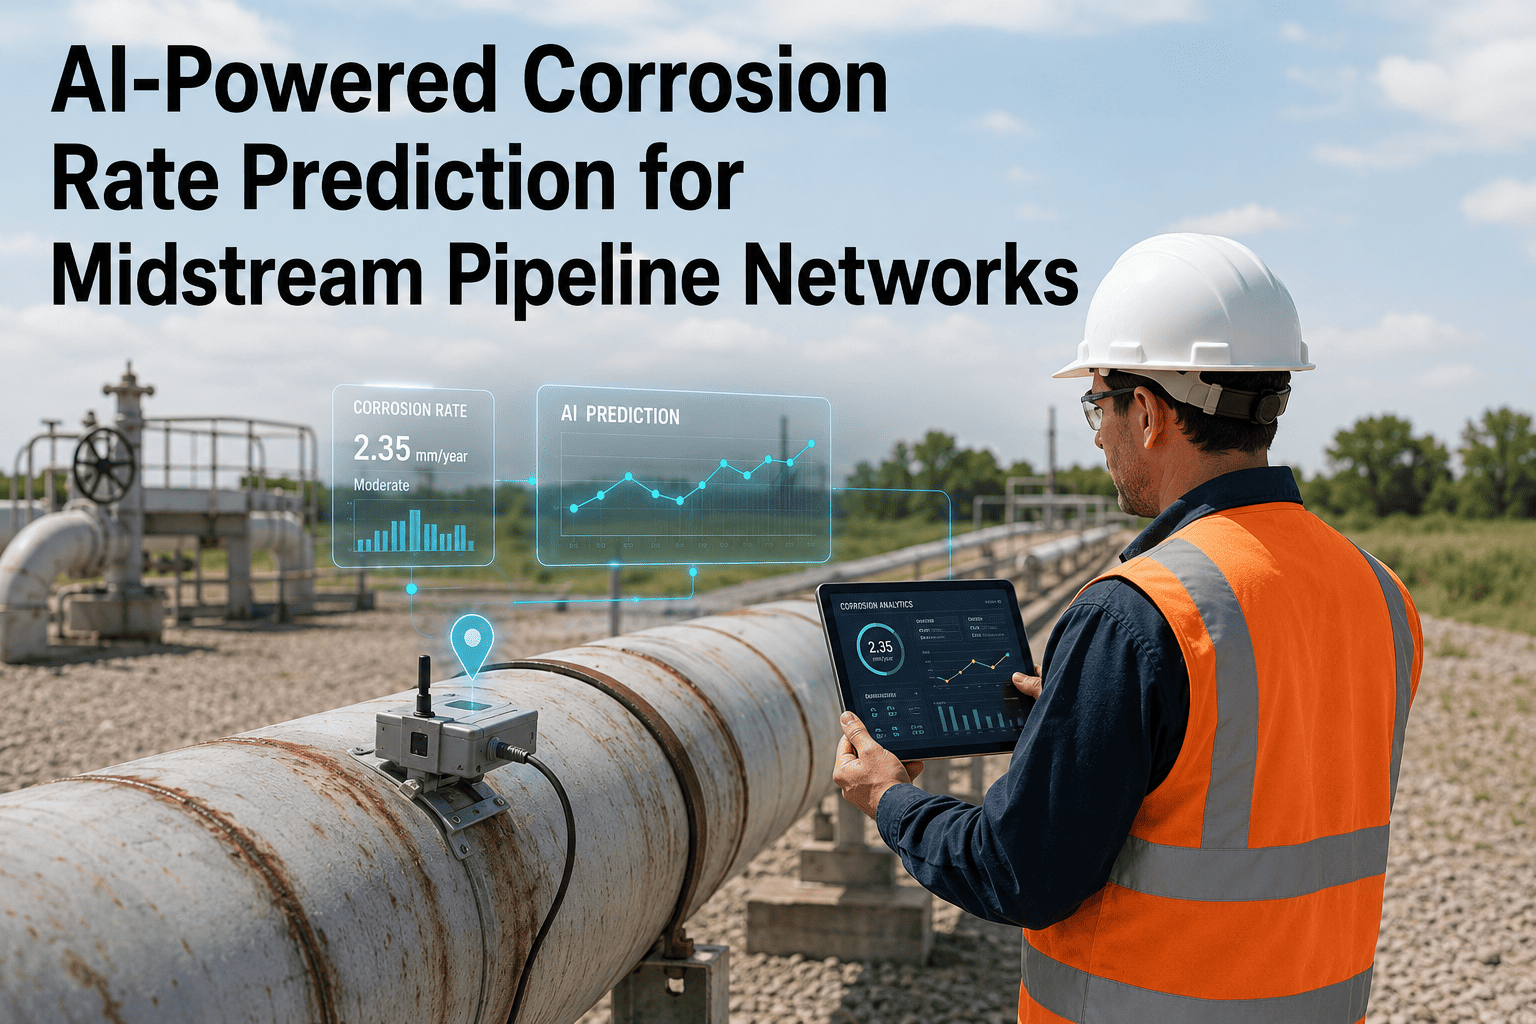
Internal corrosion is the failure mode midstream pipeline operators worry about most and see the least, because it happens on the inside of a pipe wall that nobody can visually inspect without shutting the line down and running an intelligent pig. Integrity teams have relied on models like de Waard-Milliams for decades to estimate corrosion rates from CO2 partial pressure and temperature, but real pipeline conditions rarely match the clean lab assumptions those models were built on. iFactory AI adds a machine learning layer on top of established corrosion models, correlating live process data against actual inspection results so predicted corrosion rates track reality far more closely — Book a Demo to see the model run against your own pipeline network data.
Why de Waard-Milliams Alone Isn't Enough Anymore
The de Waard-Milliams model has been the industry reference for CO2 corrosion prediction since the 1990s, and it remains a genuinely useful starting point — but it was built on controlled laboratory conditions and a limited set of input variables, primarily CO2 partial pressure and temperature. Real midstream pipeline networks introduce variables the base model was never designed to fully account for: variable water wetting along the pipe wall, H2S interactions that can either accelerate or inhibit corrosion depending on concentration, flow regime changes that affect where water settles out of the hydrocarbon stream, and the physical realities of pipe metallurgy and coating condition that vary segment by segment.
This is why integrity teams so often see a gap between what de Waard-Milliams predicts and what an in-line inspection actually finds — the model isn't wrong so much as incomplete for the specific conditions of any given pipeline segment. Rather than replacing the model, iFactory AI trains a machine learning layer that learns the correction factors specific to your network from historical inspection data, so the physics-based foundation gets calibrated against ground truth instead of applied as a generic default.
The Five Variables That Actually Drive Internal Corrosion
CO2 Partial Pressure
The foundational driver in de Waard-Milliams, still the strongest single predictor but insufficient on its own for accurate segment-level estimates.
H2S Content
Can form protective iron sulfide scale at certain concentrations or accelerate localized pitting at others, making its effect highly condition-dependent.
Flow Velocity
Determines whether water separates out and pools at low points or stays entrained in the flow, directly affecting where corrosion concentrates along a segment.
Water Wetting
The presence and persistence of a water film on the pipe wall is often the single biggest differentiator between segments that corrode and segments that don't.
Temperature
Affects both reaction kinetics and scale formation, with corrosion rate typically peaking in a mid-range temperature band rather than rising linearly.
How the AI Correction Layer Is Built
Base Model vs AI-Corrected Prediction
| Aspect | de Waard-Milliams Alone | AI-Corrected Model |
|---|---|---|
| Input variables | Primarily CO2 and temperature | CO2, H2S, flow velocity, water wetting, temperature |
| Calibration | Generic lab-derived coefficients | Segment-specific, learned from your inspection history |
| Prediction granularity | Single estimate applied broadly | Per-segment estimate reflecting local conditions |
| Accuracy vs actual ILI results | Often over- or under-predicts locally | Continuously validated and re-calibrated against ILI findings |
Where Segment-Level Predictions Change Dig and Repair Decisions
The practical value of an AI-corrected corrosion model shows up most clearly in how it changes dig and repair prioritization decisions. A fleet-average or generic corrosion rate estimate tends to push integrity programs toward one of two costly patterns: over-conservative dig programs that spend budget excavating segments that never needed it, or under-conservative programs that miss a genuinely aggressive corrosion zone because the average masked a local outlier. Segment-level predictions calibrated against actual inspection results correct both failure modes at once, since each segment's estimate reflects its own measured history rather than a network-wide assumption.
This granularity also changes how remaining life calculations feed into capital planning. Instead of treating an entire pipeline as aging at a uniform rate, integrity teams can identify the specific segments driving the shortest remaining life estimates and target inspection, coating repair, or chemical treatment programs at those locations specifically — often extending the useful life of the surrounding, lower-risk segments simply by not diverting limited maintenance budget toward them unnecessarily.
Integrating Corrosion Inhibitor and Chemical Treatment Data
Corrosion inhibitor injection is one of the most common mitigation strategies on CO2 and H2S-affected lines, but its effectiveness is notoriously difficult to quantify without a model that can separate the inhibitor's contribution from the other variables already at play. iFactory AI's platform incorporates inhibitor dosage and injection frequency as an additional correlated input alongside the five core process variables, allowing the model to estimate how much of the observed corrosion rate reduction is attributable to treatment versus natural variation in flow or composition.
Dosage Correlation
Inhibitor concentration is tracked against corrosion rate trends to show whether current dosing is actually achieving its intended effect.
Coverage Gaps
Segments where inhibitor coverage is inconsistent or where treatment appears less effective are flagged for closer review.
Cost Justification
Quantified corrosion rate reduction gives integrity teams a defensible basis for chemical treatment spend during budget reviews.
What an Integrity Engineer Reported
We had segments where de Waard-Milliams said we had years of margin and the pig run found pitting we weren't expecting, and other segments where the model was overly conservative and we were scheduling digs that turned out unnecessary. Once the AI layer was trained on two inspection cycles of our own data, the predicted corrosion rates lined up with what we were actually finding to a degree the base model never got close to, and our dig program is now targeted instead of a guess.