Pipeline operators running in-line inspections every 5 to 10 years face a fundamental data gap between each ILI run. Corrosion does not pause between inspections, yet most integrity management programs treat each ILI report as a standalone snapshot rather than one data point in a continuous degradation curve. The result is that re-inspection intervals are set conservatively, repair dig lists are prioritized by worst-case depth rather than growth trajectory, and pipelines with slow-growing corrosion are excavated at the same frequency as those with actively accelerating metal loss. AI-driven corrosion growth rate analysis changes this by modeling how each anomaly evolves over time with quantified confidence intervals. See how iFactory does this by booking a demo.
The Data Gap Between ILI Runs: Why Single-Run Assessment Is Insufficient
A single in-line inspection provides a cross-section of anomaly depths at one point in time. It tells you where corrosion exists and how deep it is on the day the tool passed through the pipeline. What it cannot tell you is how fast each anomaly is growing, whether the growth rate is accelerating or decelerating, or how many years remain before any individual feature reaches a critical depth that requires intervention. Most pipeline operators address this uncertainty by applying a generic corrosion rate — typically 0.1 mm/year or a value derived from industry averages — to all anomalies uniformly. This approach has two severe limitations that directly impact integrity management decisions and operating costs.
First, a uniform corrosion rate ignores the reality that corrosion growth is driven by local conditions: coating disbondment geometry, soil chemistry, cathodic protection availability at the defect location, pipeline operating temperature, product composition including CO2 and H2S partial pressures, and flow regime. An anomaly beneath a coating holiday in acidic clay soil with intermittent CP coverage may be growing at 0.18 mm/year, while an anomaly of identical initial depth in well-drained sandy soil with robust CP may be growing at 0.02 mm/year. Applying the same rate to both produces fundamentally wrong remaining life predictions — overestimating life for the fast-growing feature and underestimating life for the slow-growing one.
Second, single-run assessment cannot distinguish between anomalies that are active and those that have stabilized. A 40% wall thickness anomaly that has not grown in 8 years does not carry the same risk as a 25% wall thickness anomaly that has grown 5% in the last 3 years. Without growth rate data, both are assessed by their current depth alone, and the 40% feature receives higher repair priority despite being stable — a misallocation of integrity spend that diverts resources from the feature that actually poses the growing risk.
Corrosion Growth Timeline: What Happens Between Inspections
The following timeline illustrates how AI models construct a continuous corrosion growth profile from discrete ILI data points, interpolating between confirmed measurements and projecting forward to predict future depths with confidence bounds. This is the core analytical capability that transforms interval-based integrity management into condition-based decision making.
ILI Comparison Analysis: How AI Models Match Anomalies Across Multiple Runs
The foundation of corrosion growth rate calculation is accurate anomaly matching between ILI runs. When a pipeline is inspected by the same vendor with the same tool technology, matching is relatively straightforward — spatial coordinates, axial position, and feature morphology provide sufficient correlation confidence. However, when tool vendors change between inspections, sensor technology upgrades produce different resolution and characterization, or the pipeline has been recoated or repaired in the interim, matching becomes a significant technical challenge that manual methods handle poorly.
iFactory's ILI comparison engine applies a multi-criteria matching algorithm that evaluates spatial proximity, circumferential position, anomaly length and width, depth profile shape, and surrounding feature density to assign a match confidence score to each anomaly pair. Features below the confidence threshold are flagged for manual review rather than force-matched, which prevents the single largest source of growth rate error: incorrect anomaly pairing that produces spurious growth rates — either negative (suggesting metal addition) or extremely high (suggesting runaway corrosion where none exists).
After matching, the engine applies three growth rate models in parallel — linear regression, power law fitting, and a physics-informed neural network that incorporates operating pressure, temperature, CP survey data, and coating condition as input features. The model with the lowest residual error for each anomaly is selected as the primary growth rate, and the ensemble disagreement between models is reported as uncertainty bounds on the prediction. This multi-model approach prevents any single mathematical assumption from biasing the growth rate estimate.
Remaining Life Prediction Methods: From B31G to AI-Driven Models
Pipeline remaining life prediction has evolved through three generations of analytical methods, each offering progressively more accurate but more data-intensive results. The following comparison shows where each method excels and where it falls short for modern integrity management programs that must optimize re-inspection intervals across thousands of anomalies.
Original ASME B31G method uses a simplified parabolic approximation of the metal loss profile to calculate the maximum allowable defect depth and length. It was designed for rapid field assessment of single anomalies from one ILI run and intentionally produces conservative results.
RSTRENG (Remaining Strength of Corroded Pipe) uses the actual measured depth profile from ILI data rather than a parabolic approximation, producing less conservative failure pressure predictions. It still requires a single ILI run and cannot inherently model corrosion growth over time.
Physics-informed machine learning model trained on matched anomaly pairs from multiple ILI runs, incorporating operating conditions, CP surveys, coating assessments, and soil data. Delivers per-anomaly growth rate, remaining life prediction with confidence intervals, and anomaly-specific re-inspection recommendations.
Re-Inspection Interval Optimization: Traditional vs AI-Driven Approach
The re-inspection interval is the single most consequential decision in pipeline integrity management. Set it too short and the operator incurs unnecessary ILI costs — a single MFL run on a 200 km pipeline can cost $400,000 to $800,000 depending on diameter, routing complexity, and permitting requirements. Set it too long and an undetected fast-growing anomaly may reach critical depth between inspections, creating a safety exposure and potential regulatory violation. AI-driven growth rate analysis replaces the uniform interval with anomaly-specific reassessment timelines that concentrate inspection resources where the data indicates elevated risk.
| Integrity Decision | Traditional Interval-Based | AI Growth Rate-Based | Impact on ILI Scheduling |
|---|---|---|---|
| Re-Inspection Interval Setting | Fixed 5 or 10 year cycle for entire pipeline system regardless of corrosion activity | Per-segment interval based on maximum anomaly growth rate within each segment, with minimum 3 year and maximum 15 year bounds | High-growth segments inspected at 3–5 years; low-growth segments extended to 10–15 years |
| Repair Dig Prioritization | Ranked by current anomaly depth only — deepest features dug first regardless of whether they are growing | Ranked by composite score: current depth weighted by growth rate, predicted time to critical depth, and consequence of failure at that location | Active growing features at 30% WT prioritized over stable features at 50% WT |
| Anomaly Re-Classification | Re-classified only at next ILI run when new depth data becomes available | Continuously re-classified as growth rate models update with new CP survey data, coating condition reports, or operating condition changes | Features accelerating from 0.05 to 0.12 mm/yr flagged between ILI runs without waiting for next inspection |
| Temporary Pressure Reduction | Applied uniformly to all anomalies exceeding a depth threshold until repair is completed | Applied only to anomalies whose predicted remaining life at current operating pressure falls below the repair lead time | Pressure reductions lifted on stable anomalies, maintaining throughput revenue on unaffected segments |
| Regulatory Filing (IMP Updates) | Conservative assumptions documented as basis for interval setting; no growth rate evidence provided | Per-anomaly growth rate data, model validation results, and confidence intervals submitted as quantitative evidence supporting interval extension | Regulator receives data-driven justification rather than conservative default; approval probability increases |
Risk-Based Repair Prioritization Matrix
When a pipeline has hundreds or thousands of annotated anomalies, the repair dig program must prioritize which features to address first. The matrix below combines current anomaly depth (the severity axis) with corrosion growth rate (the urgency axis) to produce a risk zone classification that directly translates to dig scheduling priority. This is the operational output that integrity engineers use to build their annual repair programs.
Measurable Impact of AI-Driven Corrosion Growth Rate Analysis
The operational and financial impact of deploying AI-driven corrosion growth rate modeling is measurable within the first re-inspection cycle after implementation. The following results are derived from operators who have applied iFactory's pipeline corrosion analytics across their ILI-managed systems.
Fitness for Service Assessment Under AI-Driven Corrosion Modeling
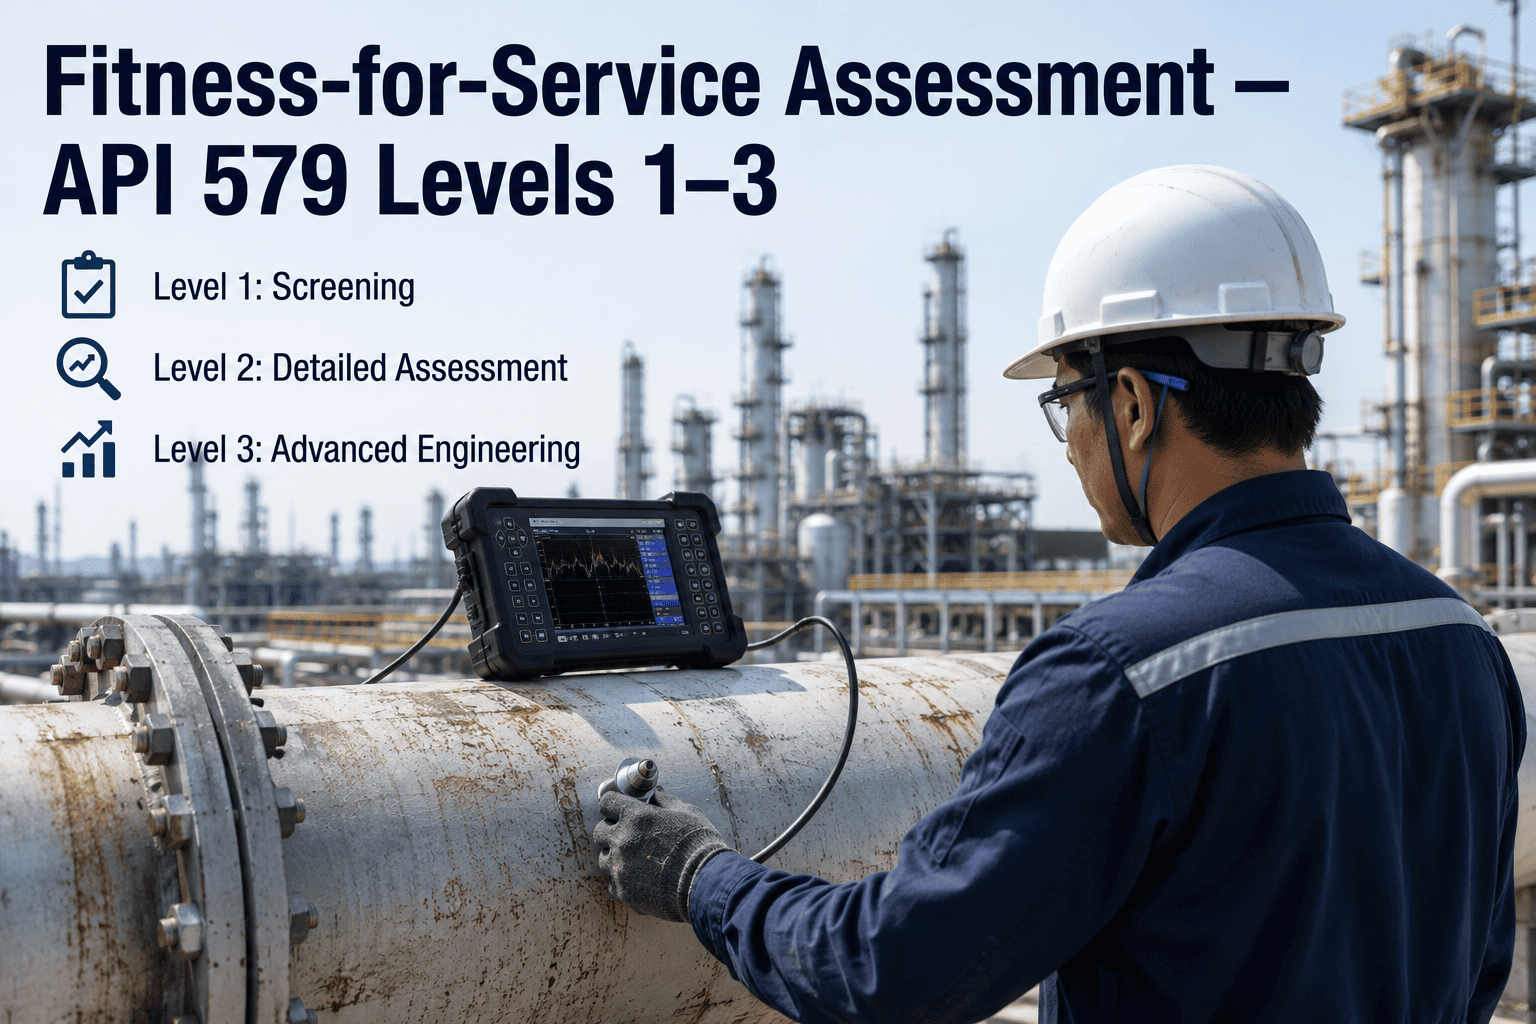
Fitness for service (FFS) assessment determines whether a corroded pipeline segment can continue operating safely at its current pressure, at a reduced pressure, or requires immediate repair. Traditional FFS relies on a single ILI depth measurement plugged into B31G or RSTRENG to calculate a failure pressure and compare it against the maximum allowable operating pressure (MAOP). The result is binary: the feature passes or it fails, and if it fails, the operator must either reduce pressure or dig.
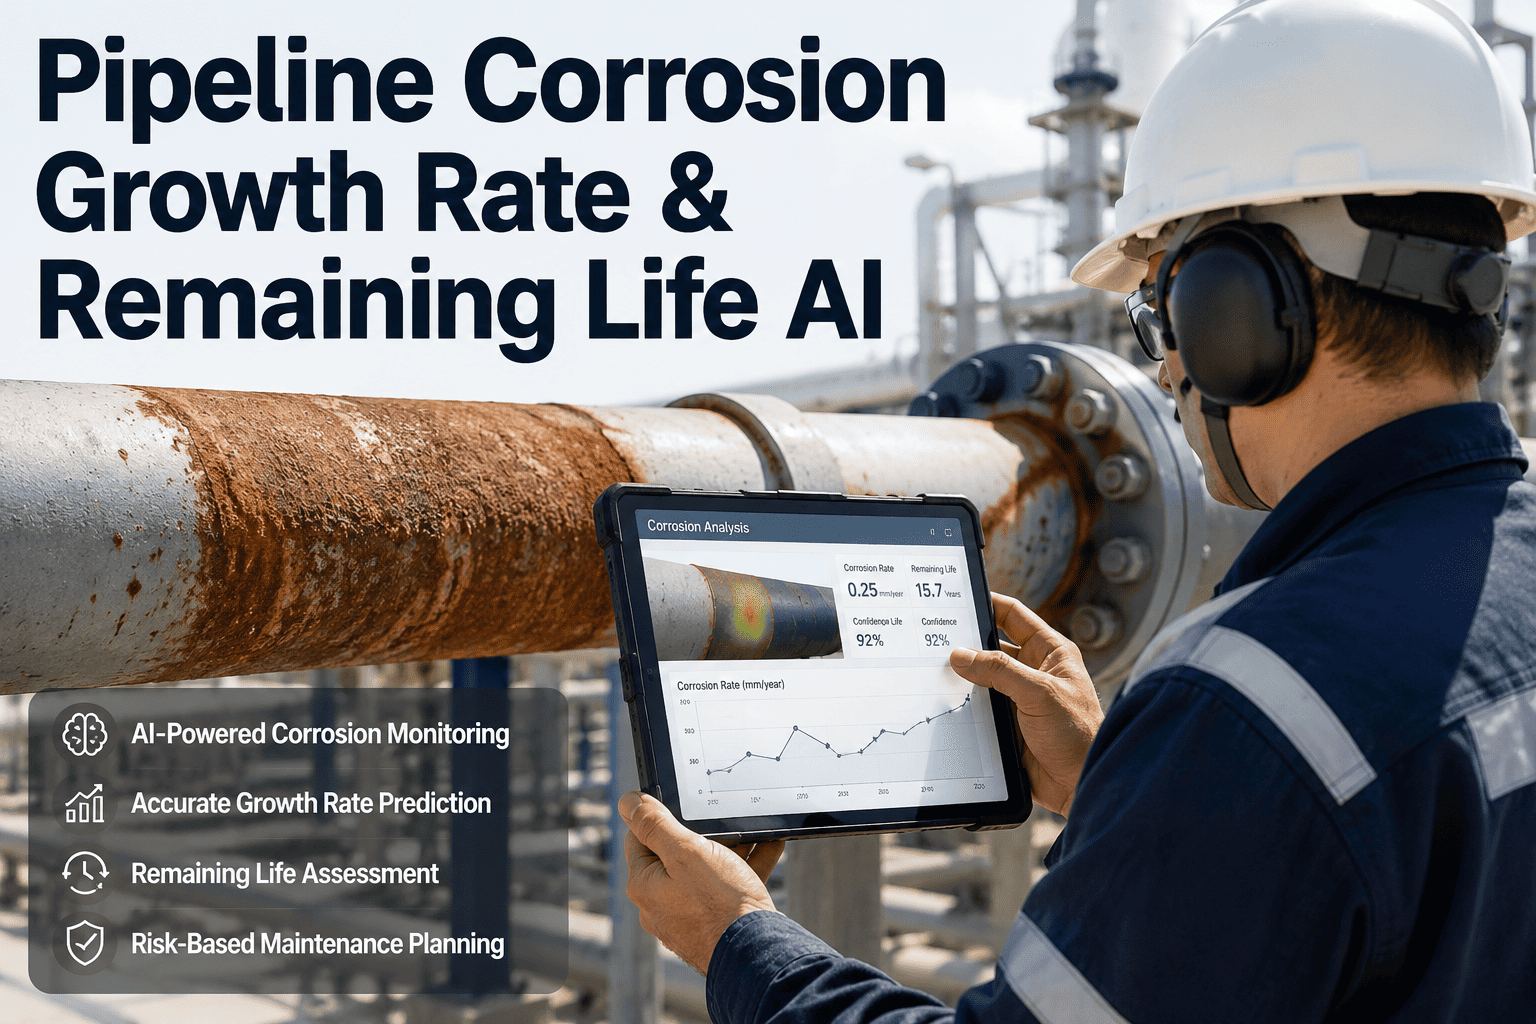
AI-driven FFS adds a temporal dimension that fundamentally changes the decision framework. Instead of asking "is this feature safe today?" the assessment asks "how long will this feature remain safe at current operating conditions?" The AI model delivers a remaining life estimate with confidence bounds — for example, "Anomaly C-1247 has a predicted remaining life of 14.2 years to 80% WT depth at current MAOP, with a 90% confidence interval of 11.8 to 17.1 years." This output enables three decisions that binary FFS cannot support: extending the re-inspection interval with quantified risk, deferring a repair dig when remaining life exceeds the next scheduled ILI by a sufficient margin, and prioritizing limited repair budgets toward features with the shortest remaining life rather than the deepest current depth.
The integration with operating condition data further refines the assessment. If an operator plans to reduce MAOP on a segment due to market conditions, the AI model recalculates remaining life at the lower pressure and reports the life extension gained — often 5 to 12 additional years for features in the 40–60% WT range, which may eliminate the need for scheduled repairs entirely. This pressure-life sensitivity analysis is not available from any single-run assessment method and represents one of the highest-value applications of AI-driven corrosion modeling for pipeline operators managing aging infrastructure.
Expert Perspective: Why Growth Rate Data Is the Missing Variable in Pipeline Integrity
I have managed integrity programs for over 8,000 km of gas transmission pipeline across the U.S. Gulf Coast and Midcontinent regions, and the single most expensive error I see operators make is treating ILI data as a snapshot rather than a time series. We had a 24-inch pipeline where we excavated 38 anomalies based on depth ranking from a single ILI run. After deploying growth rate analysis on the subsequent run, we discovered that 22 of those 38 anomalies had growth rates below 0.03 mm/year — they had been stable for the entire interval and would not have reached actionable depth for another 25 to 40 years. Meanwhile, we had six anomalies at 28 to 35% wall thickness with growth rates of 0.14 to 0.19 mm/year that were not in our original dig list because their current depth placed them below the excavation threshold. Those six features were the actual integrity risk, and we had walked past them to dig features that posed no near-term threat. The cost of those 22 unnecessary digs was approximately $1.8 million. The cost of the six deferred digs that should have been prioritized was nearly a regulatory incident. Growth rate analysis is not a nice-to-have optimization. It is the variable that determines whether your dig program is addressing actual risk or just checking boxes on depth ranking. Book a demo to see how this analysis works in practice.
Frequently Asked Questions
iFactory applies a multi-criteria spatial matching algorithm that evaluates axial position, circumferential position, anomaly length, anomaly width, depth profile shape, and surrounding feature density to assign a match confidence score to each candidate anomaly pair between two ILI runs. When tool vendors differ, the engine applies resolution normalization — adjusting for differences in sensor sampling interval, minimum detectable feature size, and depth measurement uncertainty — before comparing profiles. Features where the confidence score falls below the configurable threshold are excluded from growth rate calculation and flagged for manual engineering review rather than force-matched. This prevents the most common source of growth rate error, which is incorrect anomaly pairing that produces either negative growth rates or implausibly high values. Book a demo to see the matching engine in action.
A minimum of two ILI runs on the same pipeline segment is required to calculate an empirical corrosion growth rate — the rate is simply the depth difference divided by the time interval between runs. However, two runs provide only one data point per anomaly, which means the growth rate is an average over the entire interval and cannot reveal whether growth is linear, accelerating, or decelerating. Three or more ILI runs enable trend fitting — linear regression, power law, or polynomial — that characterizes the growth trajectory and produces more reliable forward predictions. iFactory recommends at least three ILI runs for high-confidence remaining life predictions, and the model accuracy improves measurably with each additional run as the algorithm has more data points to distinguish between true corrosion growth and measurement noise from tool uncertainty.
Yes. AI-based growth rate analysis can support engineering justification for inspection interval optimization when supported by validated data and regulatory requirements.
Anomalies that appear in a subsequent ILI run but have no match in the previous run are classified as new features, and iFactory handles them through a structured triage process. First, the engine checks whether the feature falls below the detection threshold of the previous tool — if the previous run used an MFL tool with 5 mm minimum detection length and the new feature is 4 mm long, it was likely present but undetected. In this case, a minimum depth is assumed for the previous run based on tool detection capability, and a maximum growth rate is calculated. Second, if the feature should have been detected by both tools, it is classified as a new corrosion event — possibly caused by coating disbondment that occurred after the previous inspection. Third, if the feature is near a repair sleeve, a welded repair, or a location where the pipeline was disturbed, it may be a reporting artifact. Each classification path produces a different growth rate treatment and risk score, and all unmatched features are flagged for engineering review regardless of the automated classification. Contact support for details on unmatched anomaly handling.
While ILI depth data from multiple runs is the primary input for growth rate calculation, iFactory's models improve significantly when supplemented with operating condition data that influences corrosion kinetics. The high-impact data sources include: cathodic protection survey data (pipe-to-soil potential readings along the pipeline route, with timestamps aligned to ILI runs), coating condition assessment reports (identifying coating holidays and disbonded areas that create localized corrosion cells), operating pressure and temperature records (higher temperature accelerates CO2 corrosion kinetics; pressure cycling can induce fatigue at corrosion pits), product composition data (CO2 and H2S partial pressures, water content, and pH for sour service pipelines), and soil condition data (resistivity, pH, chloride content, and moisture content from soil surveys along the right-of-way). The model can run on ILI data alone, but incorporating these supplementary data sources typically improves growth rate prediction accuracy by 25 to 40 percent and reduces the uncertainty bounds on remaining life estimates.