Every major process safety incident investigation ends up finding the same thing: a barrier that had been quietly degrading for weeks, sometimes months, before it was finally called on to work and did not. The safety instrumented valve that had not been proof-tested on schedule. The alarm that had been in a permanent bad-actor state so long nobody flagged it anymore. The inspection that was logged as complete in a spreadsheet nobody had opened since the last audit. None of these are single dramatic failures. They are barriers going dark one at a time, in a system built to track them once a quarter instead of continuously, which is exactly the gap a process safety demo is built to close.
Your Barriers Are Only as Strong as the Last Time Someone Checked Them
Refinery safety cases are built on the assumption that every safety critical barrier is available on demand. In practice, barrier health is usually tracked across separate spreadsheets, work order systems, and inspection binders that nobody cross-references until an audit or, worse, an incident forces the question. A small number of well-defined bowties, often as few as ten to twelve, capture the majority of critical barriers on a typical refinery unit. The problem was never identifying them. It has always been keeping their real-time status visible.
From Static Bowtie to Live Barrier Dashboard
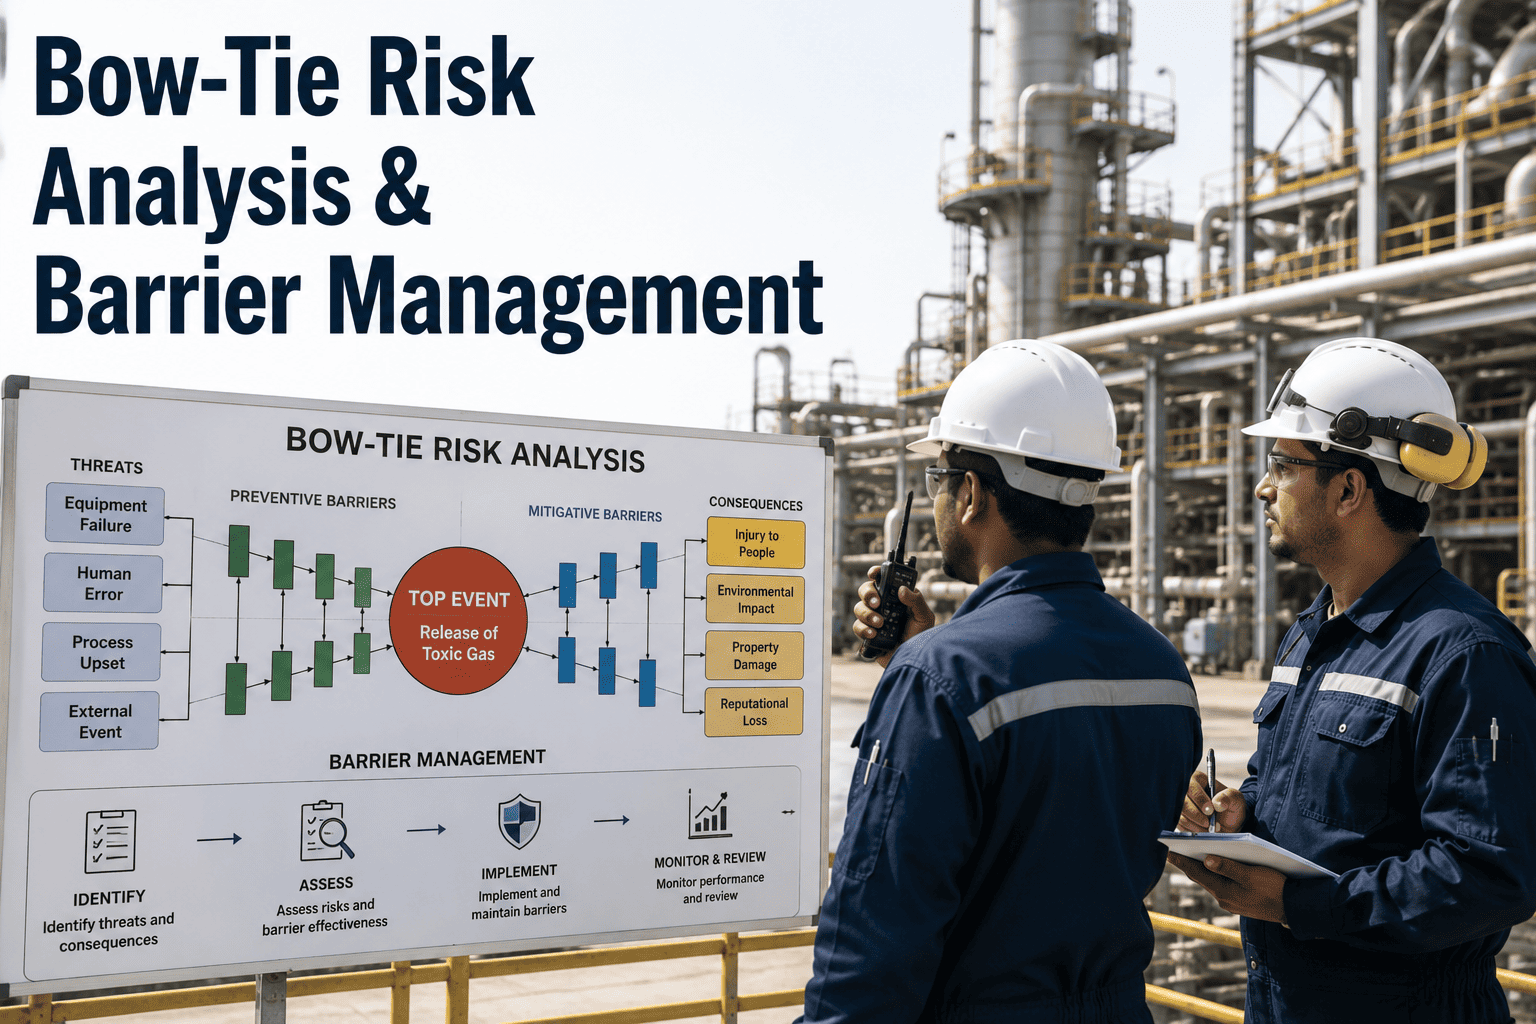
A bowtie diagram is the standard way safety engineers map how a threat could escalate into a top event, and which barriers stand between them. Drawn once during a HAZOP or bowtie workshop, it is a snapshot of intent rather than a record of reality. The value it should deliver every single day comes from turning each barrier node into a live status, fed by real inspection, testing, and maintenance data instead of the quiet assumption that nothing has changed since the workshop concluded. Below is a simplified example of what that live view looks like once the same bowtie your team already built is connected to current field data.
Fully availableDegradedOverdue or unacceptable
See Your Own Barriers on a Live Dashboard, Not a Spreadsheet
Book a walkthrough of iFactory's Safety Analytics platform and see how your critical bowties turn from a static workshop diagram into a real-time barrier health view.
What the Platform Actually Tracks, Barrier by Barrier
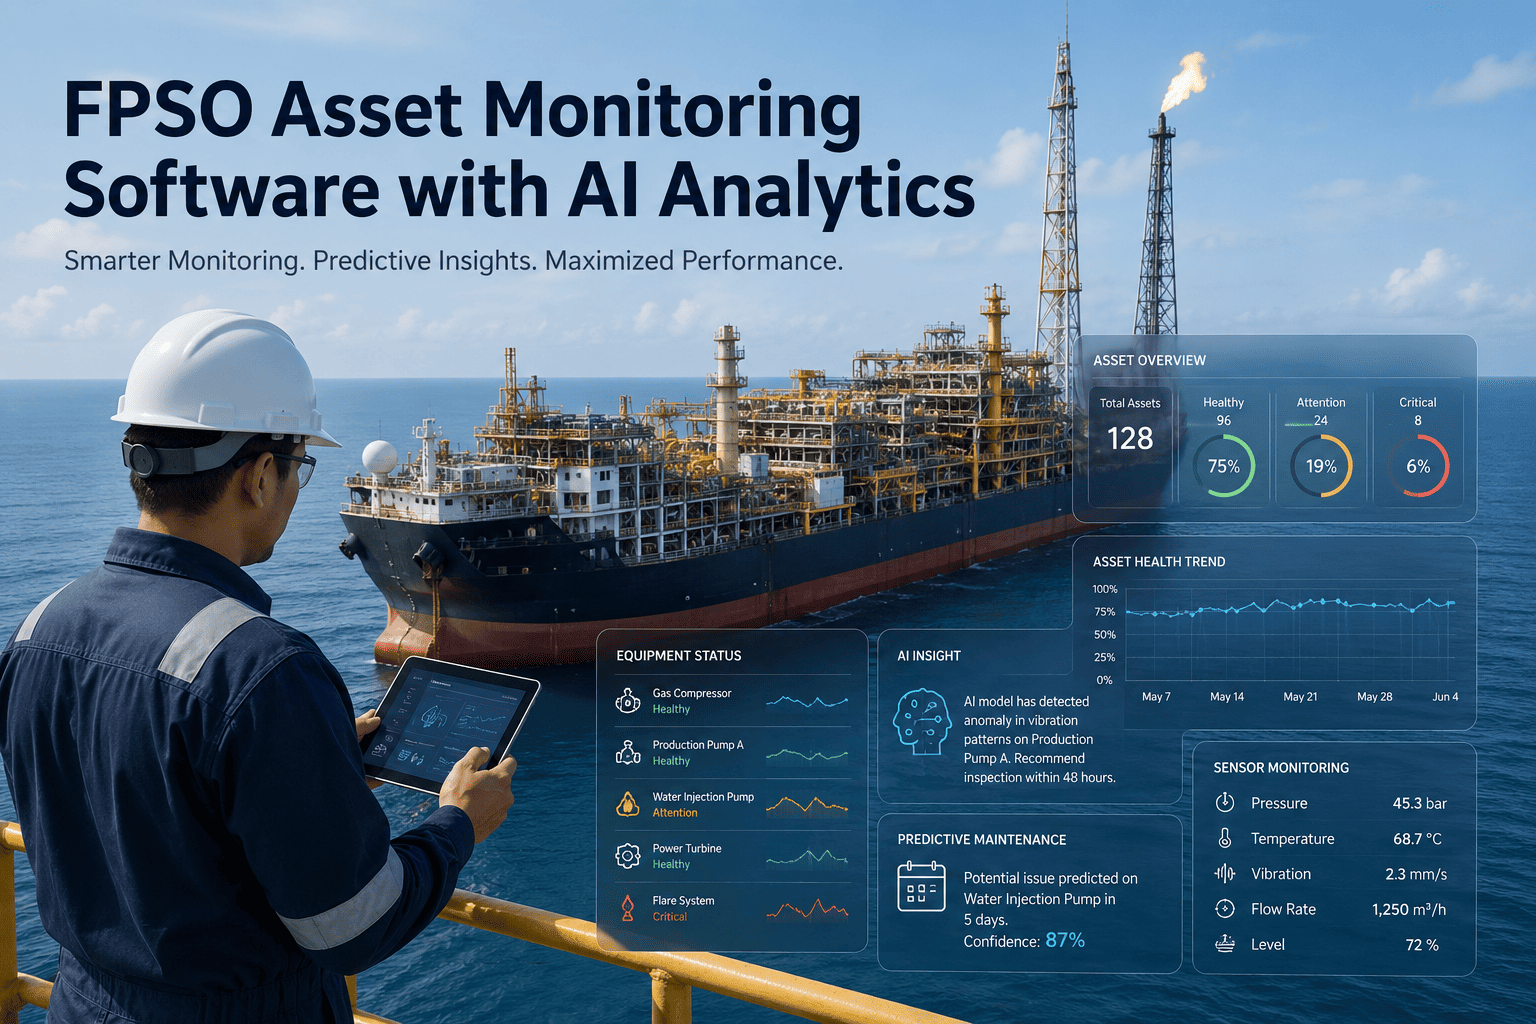
Barrier health is not one number. It is a rollup of test status, inspection evidence, maintenance backlog, and how long a safeguard has been sitting in a degraded or bypassed state. Most incident investigations find that no single one of these signals looked alarming in isolation, and that the real warning only appears once they are viewed together against the barrier they support. The platform pulls each of these signals into a single view per barrier, so a degraded state is visible the day it happens, not the week of the next audit.
Barrier Health Status
Every safety critical element is rated fully functional, degraded, or unacceptable, based on defined performance criteria rather than a manual judgment call made once a quarter.
Inspection Evidence
Proof-test results, inspection reports, and calibration records attach directly to the barrier they support, so evidence is retrievable in seconds during an audit instead of a multi-day search.
Alarm and SIS Correlation
Safety instrumented system trip history and bad-actor alarm patterns are linked to the specific barrier they represent, surfacing chronic degradation that a single alarm event would hide.
Maintenance Backlog
Overdue work orders tied to safety critical equipment are ranked by the risk contribution of the barrier they affect, not just by how long the ticket has been open.
Time-in-Degraded-State
The platform tracks how long a barrier has remained degraded or bypassed, since a temporary override that quietly becomes permanent is one of the most common precursors to a major incident.
Compensating Measure Tracking
When a barrier is degraded, any compensating measure put in place is logged and expires automatically if the underlying barrier is not restored within the agreed timeframe.
Spreadsheet-Based Tracking vs Live Barrier Monitoring
Most refineries already have the underlying data: work order history, proof-test logs, inspection reports, alarm history. What they usually lack is a single place where that data becomes a real-time barrier status instead of a quarterly reconciliation exercise.
| What Changes | Spreadsheets and Binders | Live Barrier Monitoring |
|---|---|---|
| Update frequency | Manually reconciled monthly or quarterly | Continuous, as inspection and test data is logged |
| Visibility of degraded barriers | Discovered during audit or incident review | Flagged the day the degradation occurs |
| Evidence retrieval during audit | Days spent locating test and inspection records | Attached directly to the barrier, retrievable in seconds |
| Compensating measures | Tracked informally, easy to forget or extend indefinitely | Logged with an expiry tied to barrier restoration |
| Prioritization of maintenance backlog | First in, first out, regardless of safety risk | Ranked by the risk contribution of the affected barrier |
One Barrier View, Fed by the Systems You Already Run
The platform does not ask you to re-enter data anywhere. It connects to the systems that already generate barrier evidence and pulls that evidence into the bowtie view automatically, so the record your safety case depends on is already assembled long before an auditor or an incident investigator ever asks for it.
Built Around the Frameworks Your Safety Case Already Uses
The platform is not a new methodology to learn. It is built to reflect the barrier and hazard frameworks your process safety team already uses to satisfy the regimes your facility is regulated under, so adoption looks like connecting existing evidence rather than rebuilding your safety case from scratch.
OSHA Process Safety Management
Barrier evidence and mechanical integrity records map directly to the elements auditors expect to see documented.
Seveso and COMAH
Major accident hazard barriers are tracked with the same bowtie logic used across European high-hazard regulatory regimes.
ISO 45001
Continuous barrier status monitoring supports the ongoing risk assessment and corrective action tracking the standard expects.
HAZOP, LOPA, and Bowtie Studies
Existing hazard study outputs become the structure of the live dashboard rather than being replaced by a separate system.
Process Safety Manager Perspective
We found out during an internal audit that a compensating measure on one of our relief valves had been in place for four months instead of the two weeks it was supposed to cover. Nobody had done anything wrong, exactly, it had just fallen out of anyone's daily view. Once we had barrier status on a live dashboard, that kind of thing surfaces on its own instead of waiting for someone to go looking for it.
— Process Safety Manager, Gulf Coast Refinery
Frequently Asked Questions
Do we need to redo our bowties or hazard studies to use this platform?
No. The platform is built to take your existing bowtie, HAZOP, or LOPA outputs and turn the barriers already identified in those studies into a live monitored dashboard. Most refineries only need a small number of well-defined bowties, often around ten to twelve per unit, to capture the majority of critical barriers, so the scope of work is usually smaller than teams expect. You can book a process safety demo to see how your existing studies map onto the platform.
How does the system decide whether a barrier is degraded versus fully functional?
Each barrier has defined performance standards and test criteria, established during the hazard study or barrier assessment process. The platform compares live inspection, test, and maintenance data against those criteria continuously, rating each barrier as fully functional, degraded, or unacceptable, using the same classification logic your process safety engineers already apply manually today.
Can this replace our alarm management or SIS testing program?
No, and it is not meant to. The platform reads from your existing alarm management system and SIS proof-test records rather than replacing either program. What it adds is the correlation between those data sources and the specific barrier they represent, which is the connection that is usually missing when each system is reviewed in isolation.
What happens when a barrier is flagged as degraded?
The dashboard surfaces the degraded barrier immediately along with any compensating measure already logged against it, and tracks how long that compensating measure has been in place relative to its agreed expiry. This is designed specifically to prevent a temporary workaround from quietly becoming a permanent gap, which is one of the most common contributing factors identified in major incident investigations.
How long does implementation typically take for a single refinery unit?
Implementation scope depends on how many bowties and safety critical barriers are already documented for the unit and how many source systems need to be connected, such as the CMMS, SIS testing records, and alarm management platform. The iFactory support team can review your existing hazard studies and give you a realistic implementation timeline before you commit to a pilot.
The Barrier Was Never Missing. Its Status Was.
Almost every refinery already has the studies, the test records, and the inspection evidence needed to know whether its critical barriers are healthy. What is usually missing is a single place where that evidence adds up to a status you can see today, not a status you reconstruct after something has already gone wrong. Turning the bowtie from a workshop artifact into a live dashboard is what closes that gap, and it is built on data your teams are already generating every shift. The safety case does not need to change. What needs to change is how quickly a degraded barrier becomes visible to the people who can still do something about it.
Ready to See Your Barriers in Real Time?
Book a walkthrough of iFactory's Safety Analytics platform and see how your bowties, inspection records, and maintenance data come together into one live barrier health view.