The Piper Alpha investigation did not just count the dead. It traced, barrier by barrier, exactly how a permit-to-work gap and a failed isolation turned a routine maintenance error into the worst offshore disaster in history, and that reconstruction became the blueprint for how the industry visualizes major accident hazards today. The bow-tie diagram it inspired puts a hazard at the center, threats branching in from the left, consequences fanning out to the right, and every barrier standing between them drawn where it actually sits in the chain. Facilities that still manage barriers as line items in a spreadsheet rather than a living picture can book a demo to see what a connected barrier system looks like in practice.
BOW-TIE ANALYSIS · BARRIER MANAGEMENT · MAJOR ACCIDENT HAZARDS
See Every Barrier Standing Between a Threat and a Disaster
Bow-tie diagrams turn abstract risk registers into a picture everyone on the floor can read at a glance. Here is how to build one that actually holds up under an audit.
Anatomy of a Bow-Tie Diagram
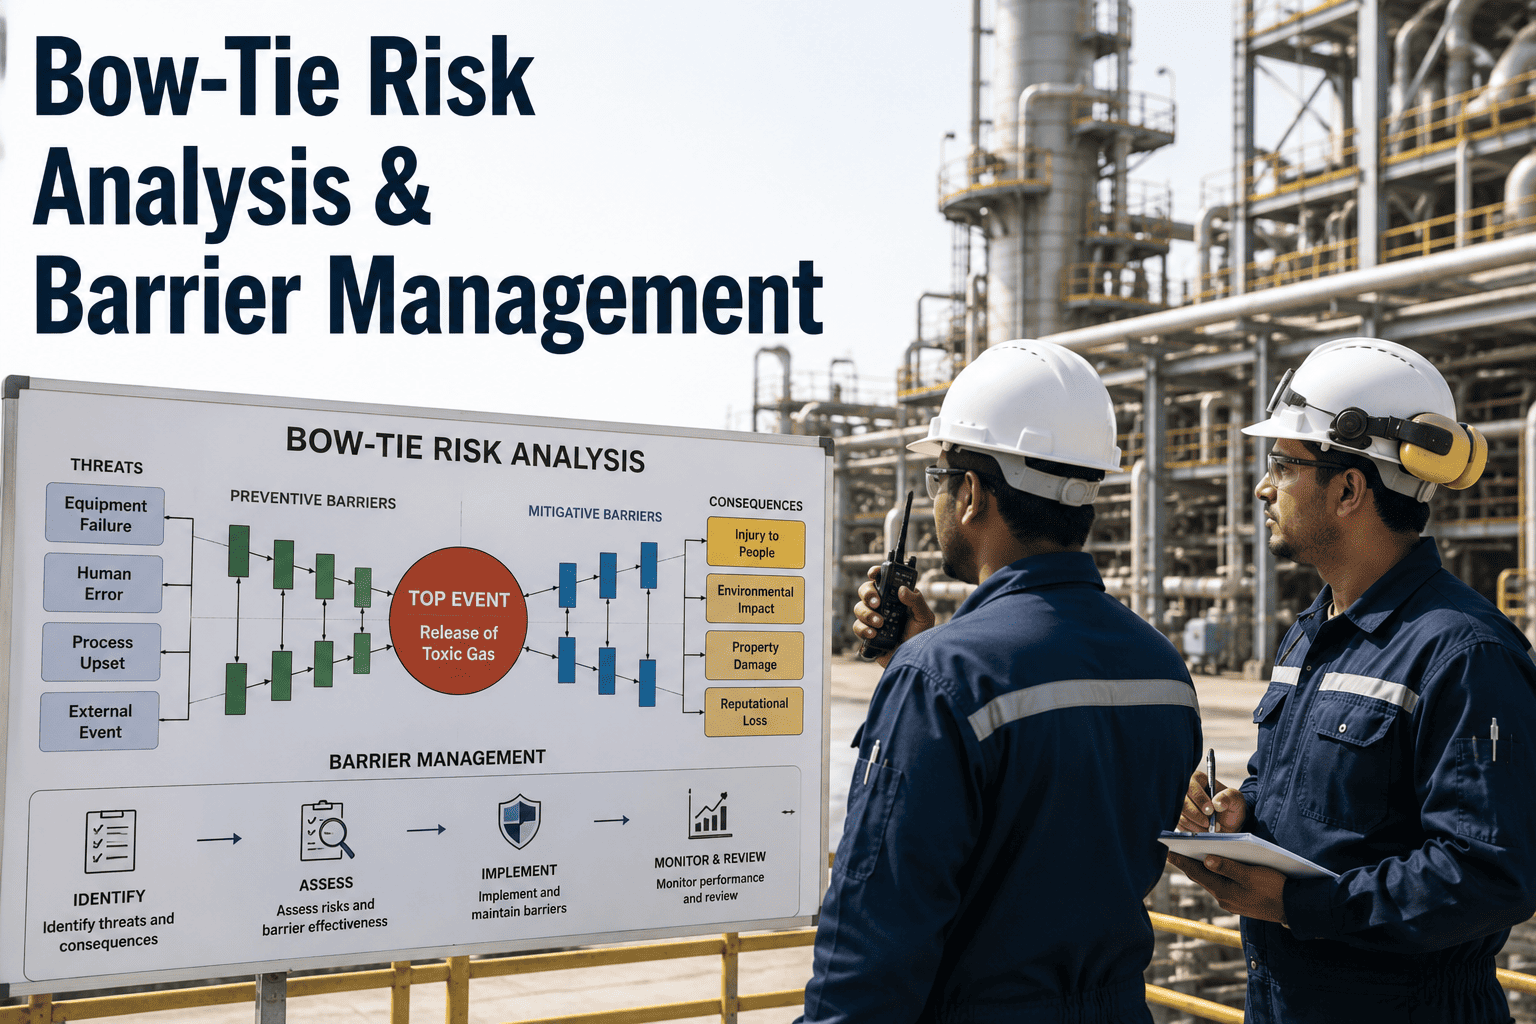
A bow-tie diagram reads left to right around a single hazard. Threats on the left represent every way a top event could be triggered, preventive barriers stand between each threat and the hazard, the top event sits at the center where control is lost, mitigative barriers stand between the top event and each possible consequence, and the consequences fan out on the right. The shape earns its name from how it looks once every branch is drawn.
Threats
Corrosion under insulation
Overpressure during startup
Human error on valve lineup
Preventive Barriers
Corrosion monitoring program
Relief valve sized to scenario
Permit-to-work verification
Loss of Containment
Mitigative Barriers
Gas detection and shutdown
Fire and blast protection
Emergency response plan
Consequences
Vapor cloud explosion
Personnel injury or fatality
Extended production loss
1988
The Piper Alpha disaster that drove modern barrier-based risk visualization
IOGP 415
Industry report setting quality standards for bow-tie development
2 types
Paper bow-ties as static records versus live bow-ties tied to real barrier data
1 hazard
Each bow-tie diagram is built around a single major accident hazard, not a whole unit
Why Paper Bow-Ties Stop Protecting You
A bow-tie diagram built once during a PHA workshop and filed away is a snapshot, not a management system. IOGP Report 415 draws a hard line between paper bow-ties, which document the risk picture as it looked on the day of the workshop, and live bow-ties, which stay connected to inspection records, performance testing, and action tracking so the diagram reflects reality months or years later.
The gap matters because barriers degrade. A gas detection system that passed its commissioning test can drift out of calibration, a permit-to-work process that looked airtight on paper can erode under production pressure, and an escalation factor nobody flagged at the workshop can quietly compromise a barrier's reliability. A live bow-tie surfaces that decay before it becomes the missing link in an incident investigation instead of after.
Barrier Types Worth Distinguishing
| Barrier Type | Function | Example |
|---|---|---|
| Hardware | Physically stops or slows a threat or consequence | Relief valve, blast wall, fireproofing |
| Safety Instrumented | Detects a deviation and triggers automatic action | High-pressure shutdown interlock |
| Procedural | Relies on trained personnel following a defined step | Permit-to-work, lockout-tagout |
| Organizational | Sustains barrier integrity over time | Inspection and testing program |
Building a Bow-Tie That Survives Contact With an Audit
1
Define the Hazard
Name a single major accident hazard, such as loss of containment of hydrocarbons from a specific vessel or line.
2
Map Threats and Consequences
List every credible cause on the left and every credible outcome on the right, without collapsing similar ones together.
3
Assign Real Barriers
Attach barriers that genuinely exist and are independently verifiable, not aspirational controls that sound protective.
4
Flag Escalation Factors
Identify what could quietly weaken each barrier, and assign a control for the escalation factor itself.
LIVE BARRIER MANAGEMENT
From Static Diagram to Living Barrier Record
Connect every barrier in your bow-ties to real inspection and performance data instead of a diagram that goes stale the week it is drawn.
What Barrier Owners Are Saying
Our bow-ties used to live in a PDF nobody opened after the workshop ended. Now every barrier on the diagram links back to its last inspection date, and when one starts slipping, the diagram itself tells us before it becomes a finding in the next audit.
Process Safety Engineer, Offshore Platform
Escalation Factors: The Detail Most Bow-Ties Miss
A barrier drawn on a bow-tie diagram implies a level of reliability that the barrier may not actually deliver under real conditions, and escalation factors are what expose the difference. An escalation factor is anything that can degrade a barrier's effectiveness without removing it entirely, such as corrosion reducing a relief valve's set-point accuracy, staffing gaps weakening a permit-to-work process during a turnaround, or extreme weather compromising a fire and gas detection network right when it is needed most. A bow-tie that lists barriers without also naming their escalation factors tells only half the risk story.
Mature bow-tie practice treats each escalation factor as its own small risk chain, complete with an escalation factor control that protects the original barrier's reliability. A corrosion monitoring program is not just a barrier against loss of containment on its own; it is also the escalation factor control that keeps the relief valve barrier functioning as designed. Diagrams that stop at the first layer of barriers, without this second layer of controls, tend to overstate how protected a facility actually is.
Turning Barriers Into Numbers Leadership Actually Reads
A live bow-tie is only as useful as the reporting built on top of it. The most effective barrier management programs summarize barrier health as a small set of leading indicators, such as the percentage of safety-critical barriers currently within their inspection interval, the count of open escalation factor actions, and the number of barriers operating with a known degradation. Presented this way, barrier performance becomes something a plant manager can scan in a weekly meeting rather than something only a process safety engineer can interpret from a full diagram.
This matters because barrier degradation is rarely dramatic. A barrier does not usually fail outright; it drifts, one missed calibration or one delayed inspection at a time, until it is no longer providing the level of protection the bow-tie assumes it does. Leading indicators built from live barrier data catch that drift while there is still time to act, which is the entire premise behind moving from a static diagram to a connected barrier management system in the first place.
Frequently Asked Questions
Does OSHA require bow-tie analysis specifically?
OSHA's Process Safety Management standard requires a process hazard analysis but does not mandate the bow-tie method by name, so facilities can meet the PHA requirement through HAZOP, What-If analysis, or other recognized techniques. In practice, bow-tie diagrams are widely used as a complementary tool within PHA workshops because they communicate the full risk picture more clearly than a hazard log alone. Facilities building their PHA program around bow-ties can review how it fits their existing process through support.
How is a bow-tie different from a HAZOP study?
A HAZOP study works node by node through a process, applying guidewords to identify deviations and their causes across the entire system. A bow-tie takes a single major accident hazard already identified, often through HAZOP, and lays out the complete picture of every threat, barrier, and consequence connected to that one hazard on a single diagram. The two methods are complementary rather than competing, with HAZOP typically feeding the hazards that later become bow-tie diagrams.
What makes a barrier count as independent on a bow-tie?
An independent barrier must be capable of functioning on its own to prevent the threat or mitigate the consequence, without relying on the same failure that triggered the scenario in the first place. A pressure gauge that an operator might check is not the same as an automatic shutdown interlock, and listing procedural checks as if they carry the same reliability as engineered barriers is one of the most common quality problems in bow-tie diagrams submitted for audit review.
How often should a bow-tie diagram be revalidated?
Bow-ties should be revisited whenever the underlying PHA is revalidated, typically on a five-year cycle, and immediately after any management-of-change that affects a listed threat, barrier, or consequence. A live bow-tie tied to real inspection data narrows this gap further, since barrier degradation surfaces continuously rather than only at the scheduled revalidation date. Teams can book a demo to see how continuous barrier tracking works alongside a standard revalidation cycle.
Can bow-tie diagrams support an incident investigation?
Yes, barrier-based investigation tools built on the bow-tie structure are commonly used to trace which specific barriers failed, degraded, or were absent during an actual event, rather than relying on a narrative root-cause description alone. This approach makes it far easier to identify whether the failure was isolated or reflects a systemic weakness across every bow-tie sharing that same barrier, which is often the more valuable finding for preventing recurrence.
BARRIER MANAGEMENT
Give Your Barriers a Pulse, Not Just a Diagram
Talk through how your existing bow-ties can connect to live inspection and performance data.