For facilities managing Major Accident Hazards, a written narrative buried in a process safety report rarely tells a maintenance technician or control room operator what actually stands between a routine deviation and a catastrophic loss of containment. Bowtie analysis solves that communication gap by turning a hazard scenario into a single visual diagram: threats on the left, the top event in the center, consequences on the right, and the preventive and mitigative barriers that separate one from the other laid out in plain sight. The method has become a core element of safety case documentation across oil and gas, chemical, and heavy process manufacturing precisely because it makes barrier ownership and barrier health visible to everyone in the room, not just the engineer who built the model. iFactory's Digital Twin and AI Vision platform extends that visibility further, connecting the static bowtie diagram to live plant data so barrier degradation is tracked continuously rather than discovered during the next scheduled audit. Book a Demo.
Turn Your Bowtie Diagrams Into Live Barrier Health Dashboards
iFactory connects threat lines, consequence lines, and barrier performance standards to real-time plant data, so degraded barriers are flagged before they fail on demand.
Why Threats, Top Events, and Consequences Need to Sit on One Diagram
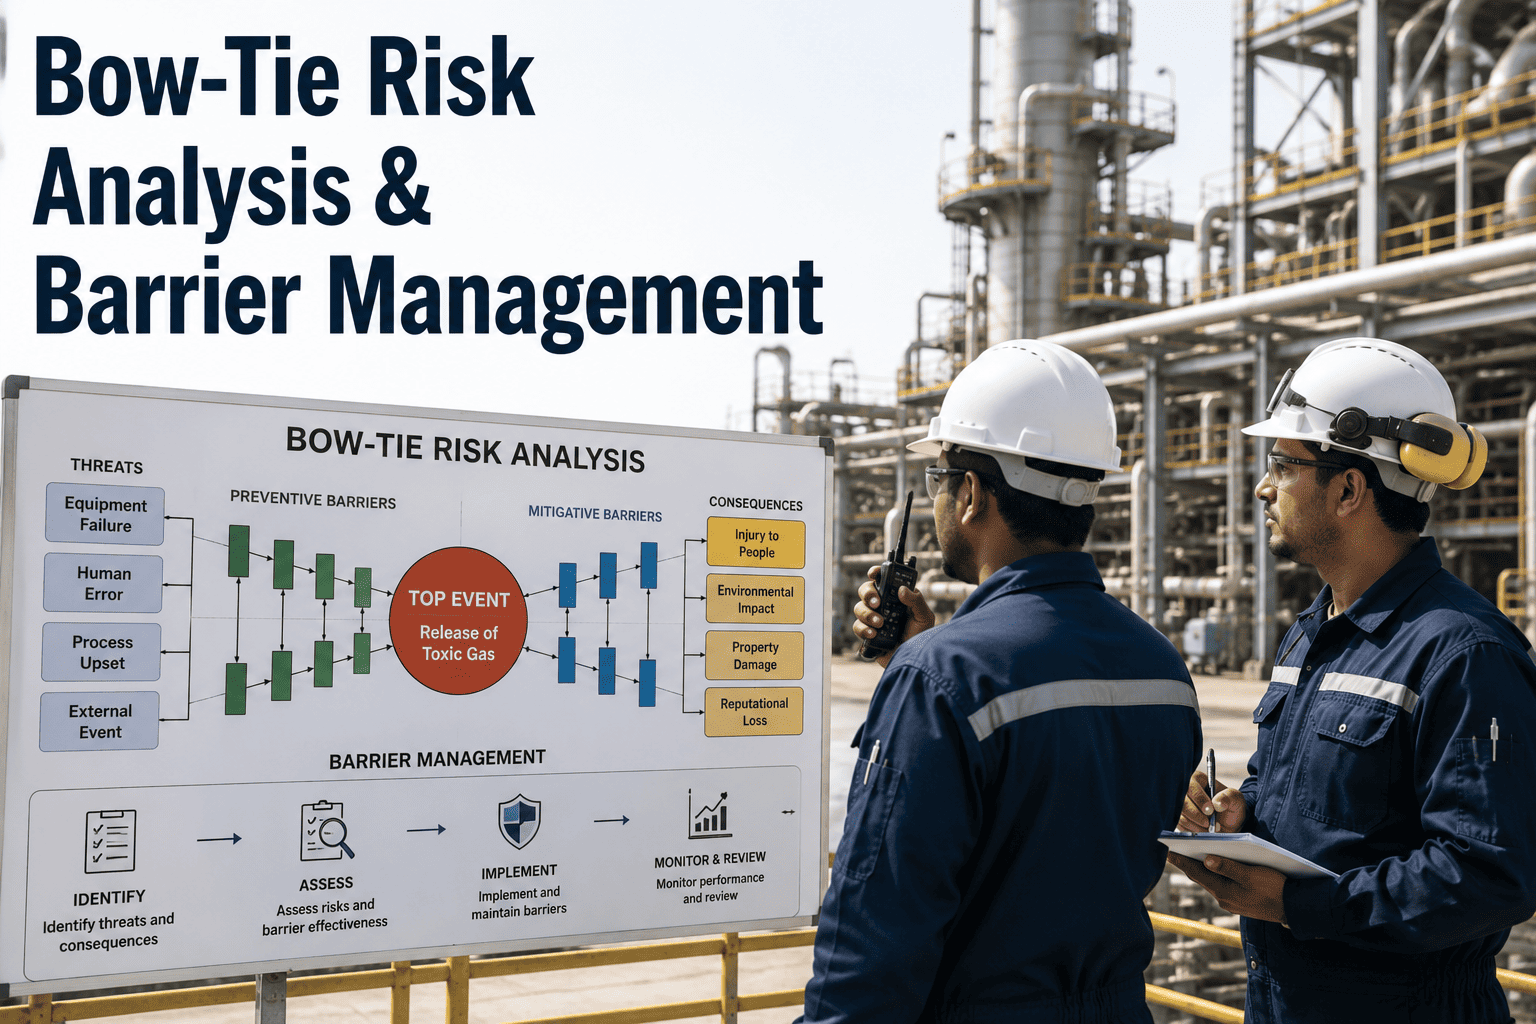
A bowtie diagram exists to answer two questions side by side: what could cause us to lose control of this hazard, and what happens if we do? On the left side of the diagram, threat lines represent the distinct causal pathways that could trigger the top event — equipment failure, human error, loss of utilities, or external interference. The top event itself marks the precise moment control over the hazard is lost, before any actual damage occurs. On the right side, consequence lines branch out to show the range of outcomes if no barrier holds. Every line through the diagram tells the story of one credible incident scenario, and the discipline of keeping each threat and consequence specific rather than vague is what makes the analysis useful during an audit instead of just decorative during a presentation.
Threat Lines
The left-hand causal pathways that could initiate loss of control, such as corrosion-driven leaks, procedural deviations, or instrumentation failure.
Top Event
The defined moment control over the hazard is lost — a clear, specific trigger point rather than a broad or ambiguous statement.
Consequence Lines
The right-hand outcomes that follow if barriers fail, ranging from contained releases to multi-fatality, asset-loss scenarios.
iFactory Barrier Tracking
Live IoT and inspection data linked directly to each barrier in the diagram, so degradation is visible as it happens rather than during the next review.
"The bowtie diagrams we built five years ago were excellent documents on the day they were drawn. The problem was that nobody updated them as inspections slipped or equipment was bypassed. Once we connected our safety-critical barriers to live maintenance and sensor data, we stopped treating barrier health as something we checked once a quarter and started treating it as something we monitor every shift."
Preventive vs. Mitigative Barriers: Two Different Jobs
Every barrier in a bowtie sits on one side of the top event or the other, and the distinction matters because the two barrier types are managed differently. Preventive barriers, placed between threats and the top event, exist to stop the loss of control from happening at all — pressure relief systems, interlocks, and inspection programs are typical examples. Mitigative barriers, placed between the top event and consequences, accept that control has already been lost and work to limit how bad the outcome becomes — fire suppression, emergency shutdown systems, and evacuation procedures fall into this category. A facility that wants to Book a Demo of how iFactory separates these barrier categories in its asset hierarchy typically finds it clarifies which teams own which side of the diagram.
| Barrier Attribute | Preventive Barrier | Mitigative Barrier |
|---|---|---|
| Position on Diagram | Between threat and top event | Between top event and consequence |
| Primary Function | Stop the loss of control from occurring | Limit severity once control is lost |
| Typical Examples | Relief valves, interlocks, inspection programs | Fire water systems, ESD valves, evacuation plans |
| Assurance Focus | Proof testing and calibration intervals | Response readiness and drill performance |
| Failure Consequence | Threat escalates toward the top event | Consequence severity increases unchecked |
Why Barriers Quietly Lose Effectiveness Between Audits
A barrier drawn on a diagram is not the same as a barrier functioning on demand. Escalation factors are the conditions that reduce a barrier's effectiveness without removing it from the diagram entirely — a sensor drifting out of calibration, an overdue proof test, a bypassed interlock left in place after a temporary repair, or an undertrained contractor performing a safety-critical task. Each escalation factor identified in a thorough bowtie analysis should have its own escalation factor barrier, such as a calibration schedule or a competency verification step, so the diagram captures not just what the barrier is but what could quietly undermine it. Facilities that rely on a static, paper-based bowtie often discover these escalation factors only during an incident investigation, well after the gap mattered. Teams looking to close that gap can Book a Demo to see how live data closes it instead.
Building a Bowtie Program That Stays Current
A bowtie diagram earns its place in the safety case only if it reflects how the plant actually operates today, not how it was designed a decade ago. Moving from a one-time workshop exercise to a living barrier management program follows a structured progression. Book a Demo to see how iFactory supports each phase below.
Hazard and Top Event Definition
Identify the Major Accident Hazard and define a specific, unambiguous top event for each diagram, drawing on HAZOP outputs, incident history, and operating experience to scope the threats and consequences that matter most.
Barrier Identification and Ownership
Map preventive and mitigative barriers to each threat and consequence line, assigning a named owner responsible for inspection, testing, and training so the diagram reflects real accountability, not abstract controls.
Continuous Degradation Monitoring
Connect performance standards, proof-test intervals, and live sensor data to each safety-critical barrier so degradation is flagged automatically, converting the bowtie from a static document into a working risk-management tool.
Bowtie Analysis and Barrier Management — Frequently Asked Questions
How is a bowtie different from a HAZOP?
HAZOP examines a process node by node to find deviations and causes. Bowtie organizes those findings around one top event to show how threats, barriers, and consequences interact visually.
What makes a barrier "safety-critical" in a bowtie diagram?
A barrier is safety-critical when its failure removes a meaningful layer of protection against the top event, typically tied to a defined performance standard the facility must keep current.
Why do bowties need escalation factors if barriers are already listed?
Escalation factors reveal how a listed barrier can quietly stop working — through calibration drift, bypasses, or overdue tests — long before it shows up as a missing control.
Can iFactory connect bowtie barriers to live sensor and maintenance data?
Yes. iFactory links each barrier to relevant IoT data, inspection schedules, and bypass status, surfacing degradation as it happens rather than at the next scheduled audit.
How often should a bowtie diagram be reviewed and updated?
Bowties should be revisited after incidents, near-misses, or process changes, and reviewed periodically as part of the broader safety case rather than treated as a one-time deliverable.
A Diagram Is Only as Strong as the Barrier Behind It
Bowtie analysis gives process safety teams a shared visual language for explaining how a Major Accident Hazard is controlled, but the diagram's value depends entirely on whether the barriers it depicts are still functioning as designed. Facilities that pair their bowtie diagrams with continuous barrier degradation tracking close the gap between what the safety case documents and what is actually happening on the plant floor today. iFactory's platform exists to make that connection automatic, linking performance standards, escalation factors, and live operational data so barrier health is something your team monitors continuously, not something they hope holds true between audits.
Keep Every Barrier in Your Safety Case Visible and Verified.
iFactory connects your bowtie diagrams to live plant data, so degraded barriers are surfaced before they're tested by a real demand.