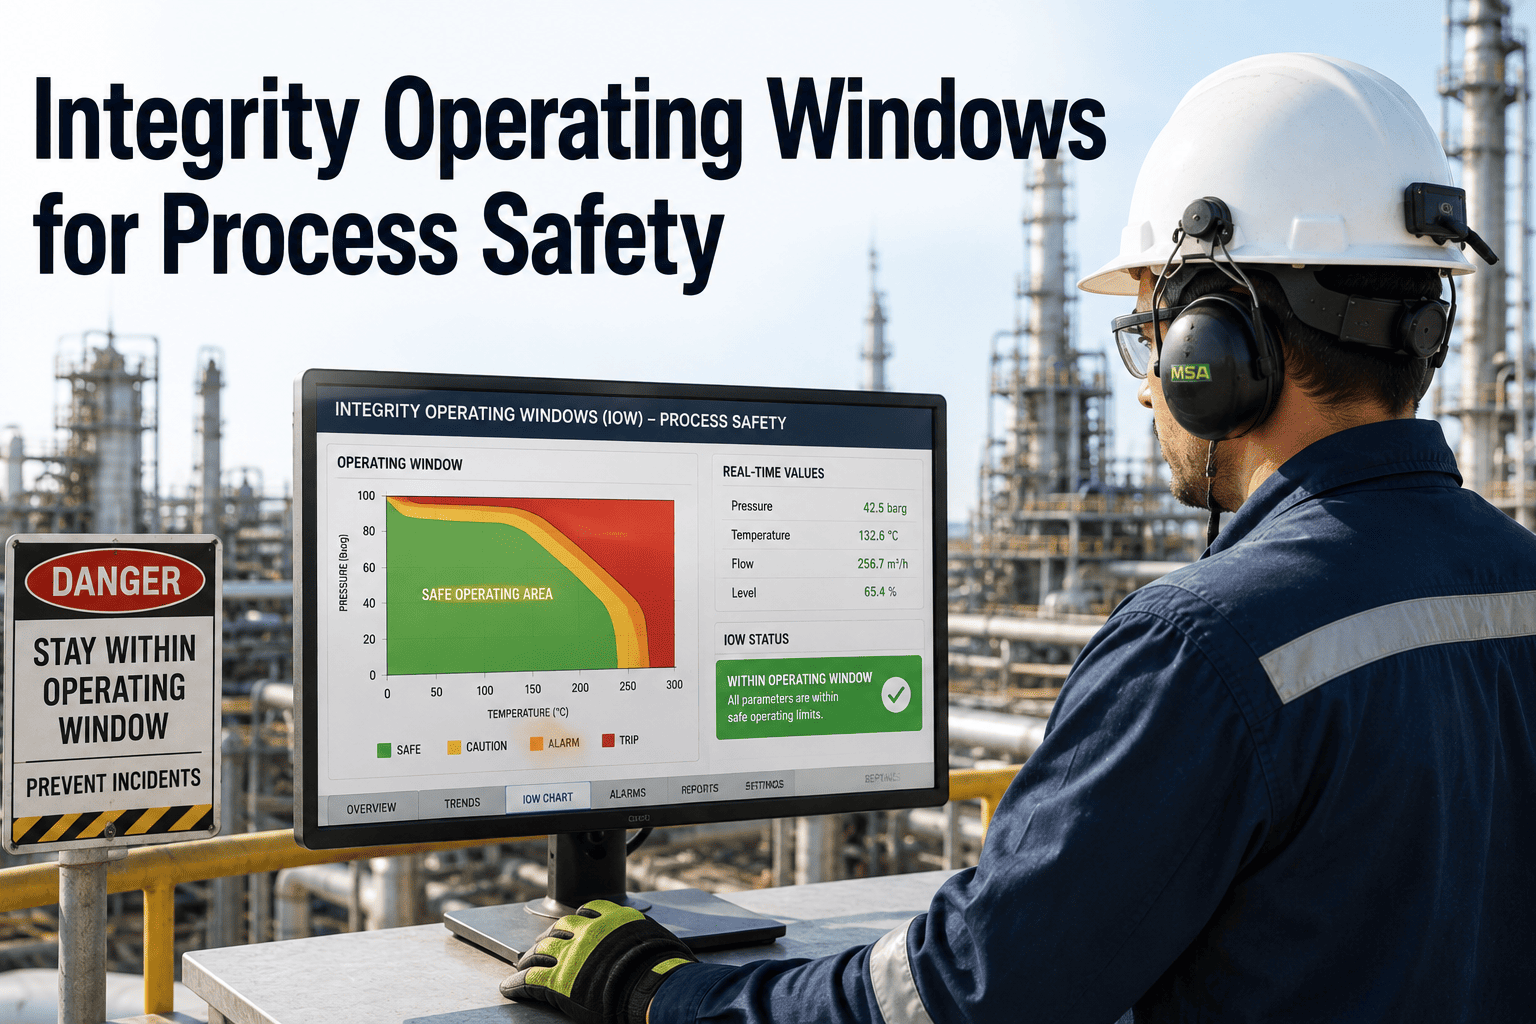
Process alarms in an oil and gas facility are designed to protect product quality and prevent immediate operational failures like pump trips or compressor surges, but they do not protect the physical integrity of the equipment itself. A separator might operate perfectly well from a process perspective at 280 degrees Fahrenheit, producing clean oil and gas at the right pressure, but if the metallurgy of that vessel is only rated for 250 degrees due to a specific hydrogen sulfide concentration, those 30 extra degrees are silently accelerating a damage mechanism that will not cause an alarm today but will cause a loss of containment in six months. This is the gap that Integrity Operating Windows are designed to close, by defining the process parameter limits that keep equipment damage rates at or below the rates assumed in the facility's risk and inspection plans. iFactory's digital operations platform turns static IOW matrices into real-time monitored limits, ensuring operators know the moment a process deviation crosses from an operational concern into an integrity threat.
Your DCS alarms protect the process. IOWs protect the steel.
Integrity Operating Windows define the process parameter boundaries where equipment damage rates stay within design assumptions. Digital IOW monitoring closes the gap between process control and mechanical integrity, preventing the cumulative deviations that drive unexpected containment losses.
Why standard process alarms do not protect equipment integrity
The fundamental disconnect between process safety and mechanical integrity in most control rooms starts with how alarms are configured. A Distributed Control System is engineered to maintain the process within its optimal operating envelope for product quality, throughput, and energy efficiency. The high-high alarm on a reactor temperature is set at the point where the reaction becomes uncontrollable, the catalyst degrades, or the relief valve lifts. These are process limits, not integrity limits. The integrity limit, the temperature at which the reactor shell begins to experience accelerated high-temperature hydrogen attack, might be significantly lower than the process alarm setpoint, meaning the reactor can operate in a state that is perfectly stable from a control room perspective but actively destroying itself from a metallurgical perspective.
This gap exists because DCS systems and Risk-Based Inspection programs are typically managed by completely different engineering disciplines using completely different data systems. Process engineers define the control limits and configure the DCS alarms. Mechanical and integrity engineers define the damage mechanisms and set the inspection intervals. In facilities where these two disciplines do not actively collaborate on alarm rationalization, the DCS alarm database contains no reference to the equipment's integrity limits. The operator has no visibility into the fact that operating at 95 percent of the high-high process alarm might represent 130 percent of the allowable limit for caustic cracking, because that information lives in a spreadsheet maintained by the inspection department, not in the control system where the operator works.
The consequence of this disconnect is that operators routinely make control decisions that optimize the process in the short term while systematically degrading the equipment in the long term. An operator might hold a distillation column at a slightly higher bottom temperature to meet a product spec during a feed change, not knowing that the higher temperature pushes the bottom portion of the column into a naphthenic acid corrosion regime that was identified as a critical damage mechanism during the last RBI assessment. Without the IOW limit visible in the control system, the operator has no way to know that the decision to meet the product spec just consumed six months of the column's remaining corrosion allowance in a single eight-hour shift.
The damage mechanism matrix that defines every IOW
An Integrity Operating Window is not an arbitrary limit chosen conservatively to provide a margin of safety. It is a calculated boundary derived directly from the specific damage mechanisms that affect a specific piece of equipment, based on the materials of construction, the process fluid composition, and the operating conditions. API 571 catalogs dozens of damage mechanisms active in oil and gas facilities, and nearly all of them are driven by one or more process parameters. Sulfide stress cracking is driven by hydrogen sulfide concentration, pH, and temperature. High-temperature hydrogen attack is driven by temperature and hydrogen partial pressure. Erosion is driven by fluid velocity and particulate loading. The IOW is simply the numerical expression of the parameter boundary where the damage rate stays within the range that the inspection plan was designed to accommodate.
When a facility performs its Risk-Based Inspection assessment per API 580 and API 581, the inspection interval and technique are calculated based on an assumed operating condition. If the assumed temperature for a sour gas pipeline is 150 degrees Fahrenheit, and the inspection interval is set at ten years based on the predicted corrosion rate at 150 degrees, then operating the pipeline at 170 degrees invalidates the inspection interval assumption. The IOW for that pipeline is 150 degrees, with a defined allowable excursion time, because exceeding that temperature changes the damage rate in a way that the ten-year inspection interval did not account for. The table below illustrates how common oil and gas damage mechanisms map directly to specific process parameters that become IOWs.
| Damage Mechanism | Primary IOW Parameter | Secondary Parameter | Typical Equipment Affected | Failure Mode if Exceeded |
|---|---|---|---|---|
| Sulfide Stress Cracking | H2S Partial Pressure | pH / Temperature | Sour gas pipelines, wellhead components, separators | Sudden brittle fracture without prior wall loss warning |
| High-Temp Hydrogen Attack | Temperature | Hydrogen Partial Pressure | Hydrotreater reactors, hydrocracker reactors, hot gas piping | Internal decarburization and micro-fissuring leading to catastrophic rupture |
| Naphthenic Acid Corrosion | Temperature | Acid Number (TAN) / Velocity | Vacuum distillation columns, transfer lines, heat exchangers | Localized high-rate wall thinning in crude units processing high-TAN crudes |
| Erosion-Corrosion | Fluid Velocity | Solids Content / pH | Pipeline bends, choke valves, orifice meters, flow restrictions | Thinning at flow disturbances leading to pinhole leaks or rupture |
| Caustic Stress Corrosion Cracking | Caustic Concentration | Temperature / Stress | Hydrotreater effluent air coolers, sour water strippers | Stress-corrosion cracking under insulation or at welds causing sudden leaks |
| Amine Stress Corrosion Cracking | Amine Concentration | CO2 Loading / Temperature | Amine absorbers, strippers, regeneration heat exchangers | Cracking at weld heat-affected zones in carbon steel equipment |
Every IOW in a facility should be traceable back to a specific damage mechanism identified in the RBI assessment. If an IOW exists but cannot be linked to a documented damage mechanism, it is either unnecessary or the integrity basis for it has been lost and needs to be re-established. This traceability is what separates a robust IOW program from a simple list of conservative operating limits. A robust program allows an operator to understand not just that a limit exists, but why it exists, what specific damage is being prevented, and what the consequence of exceeding the limit is in terms of equipment life and containment risk.
Cumulative time outside the window is what destroys equipment
A single brief excursion beyond an IOW limit rarely causes immediate failure. The danger of IOW excursions is cumulative, and it is precisely this cumulative nature that makes them so difficult to manage in a facility that relies on operator memory and shift logs to track deviations. A vessel might exceed its caustic cracking IOW by five degrees for two hours on a Tuesday, then by three degrees for four hours on a Thursday, then by seven degrees for one hour the following Monday. Each individual excursion might be minor enough that it does not trigger a formal incident report or a management of change review, but over the course of a year, these minor excursions can accumulate to hundreds of hours of operation in a damage regime that the inspection plan did not anticipate.
The cumulative exposure problem is compounded by the fact that damage mechanisms are often non-linear. A ten-degree increase in temperature might double the corrosion rate, meaning that operating ten degrees above the IOW for 100 hours does the same damage as operating at the IOW limit for 200 hours. When these non-linear damage rates are combined with poor tracking of cumulative excursion time, the result is a facility that believes its equipment is operating within its design envelope because no individual excursion was severe, while the actual cumulative damage is far beyond what the inspection plan anticipated. When the next inspection is performed and the measured wall thickness is significantly below the predicted thickness, the facility faces an unplanned shutdown for repair or replacement because the IOW exposure was never tracked and the inspection interval was never adjusted to account for the accumulated damage.
This is the specific scenario that digital IOW monitoring is designed to prevent. By connecting the IOW limits directly to the real-time process data and automatically accumulating the time spent outside each window, the system maintains a running total of integrity exposure for every monitored piece of equipment. When the cumulative exposure reaches a predefined threshold, the system triggers a review that forces the integrity engineering team to assess whether the accumulated damage requires an inspection interval adjustment, a thickness monitoring campaign, or a process change to eliminate the root cause of the excursions. This shifts IOW management from a reactive exercise triggered by major excursions to a proactive discipline that catches the slow accumulation of damage before it invalidates the inspection plan.
Are your operators seeing the integrity limits alongside the process alarms?
iFactory integrates your IOW limits directly into the operational workflow, tracking cumulative deviations in real time and alerting both operators and integrity engineers before the damage accumulates.
Five failure modes that turn good engineering into paper compliance
Most oil and gas facilities have some form of IOW program in place, driven by API 580 requirements and audited by regulatory bodies and insurance underwriters. The program typically produces a well-documented matrix listing every piece of damage-critical equipment, the relevant IOW parameters, the upper and lower limits, and the maximum allowable excursion time. On paper, the program looks comprehensive and compliant. In practice, the program often fails to deliver its intended risk reduction because the IOW data is disconnected from the systems and workflows that actually determine how the facility is operated. Understanding the specific failure modes is essential to building a program that works in the control room, not just in the audit binder.
Invisible to Operators
The IOW limits exist in a spreadsheet or a document management system but are not configured as visible limits or alarms in the DCS. Operators have no real-time awareness of where the integrity limits are relative to the current operating point, so they make process decisions without integrity context. This is the most common and most dangerous failure mode because it means the people controlling the process cannot protect the equipment even if they want to.
No Cumulative Tracking
Excursions are recorded in the shift log when they are noticed, but there is no automated system that accumulates the total time spent outside the IOW over a month, quarter, or year. The integrity team has no way to know whether cumulative exposure is within acceptable limits until they perform a manual audit of shift logs, which typically happens only after an inspection reveals unexpected damage. The data exists but is too fragmented to be useful for integrity management.
Undefined Excursion Response
The IOW matrix defines the limit but does not define what the operator is supposed to do when the limit is exceeded. Is the operator expected to return to the limit within ten minutes, one hour, or one shift? Is a notification required to the supervisor, the process engineer, or the integrity engineer? Without a defined response procedure, each operator handles excursions differently, and the integrity team is not consistently informed when exposure is occurring.
Stale Damage Mechanism Reviews
The IOW limits were set during the original RBI assessment and have not been reviewed since, even though the process chemistry, operating conditions, or equipment metallurgy may have changed through management of change events. An IOW limit that was correct for the original crude slate may be incorrect for the current crude slate, but the integrity team has not re-evaluated the damage mechanism basis since the feed change was approved.
No Link to Inspection Planning
Even when cumulative IOW exposure is tracked, the data is not fed back into the RBI assessment to adjust inspection intervals or techniques. A vessel that has accumulated 500 hours above its IOW should have its next inspection interval shortened or its inspection method upgraded to a more sensitive technique, but this adjustment does not happen automatically and is often overlooked during the next RBI reassessment cycle.
These five failure modes are interconnected. When IOWs are invisible to operators, excursions happen more frequently. When there is no cumulative tracking, the frequency and duration of those excursions go unmeasured. When there is no defined response, even the excursions that are noticed do not generate the right notifications. When damage mechanism reviews are stale, the limits themselves may be wrong. When there is no link to inspection planning, the cumulative damage that results from all of the above does not trigger the compensating inspection activity that would catch the damage before it becomes a containment failure. Breaking this chain of failures requires a system that addresses all five modes simultaneously, which is why spreadsheet-based programs consistently underperform digital solutions.
How real-time IOW monitoring works from sensor to assessment
Implementing digital IOW monitoring does not require replacing the DCS or installing new process sensors. The data required to evaluate IOW compliance, temperatures, pressures, flow rates, and in some cases composition analyzer readings, is already being measured and recorded by the existing process control infrastructure. The implementation challenge is not data acquisition but data integration: pulling the relevant parameters from the process historian, comparing them against the IOW limit matrix in real time, and delivering the resulting compliance status and cumulative exposure data to the right people in the right format at the right time.
Limit Definition and Ingestion
The IOW limit matrix, including upper limits, lower limits, maximum allowable excursion durations, and the associated damage mechanisms, is ingested into the digital platform and linked to the specific process tags in the historian that measure each parameter.
Real-Time Boundary Evaluation
The platform continuously compares the current process values against the defined IOW boundaries. When a parameter crosses an IOW limit, the system initiates an active deviation event, starting a timer that tracks the duration of the excursion against the maximum allowable time.
Operator Alerting and Response Guidance
When an IOW deviation is detected, the system delivers a targeted alert to the control room that includes the specific limit being exceeded, the current value, the maximum allowable excursion time, and the required corrective action to return to the safe operating envelope.
Cumulative Exposure Accumulation
Every second of IOW deviation time is accumulated against the equipment's annual exposure budget. The running total is visible to both operators and integrity engineers, providing a clear measure of how much integrity risk has been consumed by operational deviations.
Inspection and MOC Integration
When cumulative exposure exceeds predefined thresholds, the system automatically generates a notification to the integrity engineering team to evaluate whether the RBI inspection interval needs adjustment or whether a management of change review is required.
The most critical element of this architecture is step three, the operator alerting. An IOW alert must be designed differently from a standard process alarm to avoid contributing to the alarm floods that already overwhelm operators during upsets. IOW alerts should be configured as advisory notifications rather than critical process alarms, clearly distinguished visually and audibly from process alarms, and accompanied by enough context for the operator to understand the integrity implication of the deviation. The operator needs to know not just that a temperature is high, but that the high temperature is accelerating a specific damage mechanism and that they have a defined window to return to the limit before the exposure becomes significant enough to require an integrity engineering review.
This contextual approach to IOW alerting is what transforms the operator from a passive participant in the integrity program into an active one. Instead of simply reacting to process alarms, the operator is now making control decisions with direct visibility into the integrity consequences of those decisions. Over time, this visibility changes the control room culture, as operators begin to anticipate IOW limits during process adjustments rather than discovering them after the fact. The result is a measurable reduction in both the frequency and duration of IOW excursions, which translates directly into reduced equipment damage rates and longer inspection intervals.
What facilities measure after implementing digital IOW monitoring
The effectiveness of an IOW program is measured by its ability to keep process parameters within the boundaries that protect equipment integrity, and to capture and respond to deviations quickly enough to prevent cumulative damage. The metrics below represent the standard key performance indicators that oil and gas facilities use to evaluate whether their IOW program is functioning as a risk reduction tool or merely a compliance exercise. Facilities that implement digital IOW monitoring typically see significant improvement in all of these metrics within the first year, as the combination of real-time visibility and automated tracking addresses the systemic failure modes that degrade manual programs.
Beyond these direct metrics, facilities also report significant improvements in the efficiency of their RBI reassessment cycles. When IOW exposure data is available digitally, the integrity engineering team can incorporate actual operating history into the reassessment rather than assuming the equipment operated exactly at the design conditions for the entire interval. This actual operating history often reveals that equipment was operated more conservatively than assumed, which can justify extending inspection intervals and reducing inspection costs. Conversely, it can reveal previously unknown exposure that justifies shortening an interval, which prevents the far more costly outcome of discovering unexpected damage during an inspection that was scheduled based on overly optimistic assumptions.
The regulatory and insurance benefits of a robust digital IOW program are also substantial. Regulatory bodies, including OSHA in the United States under the Process Safety Management standard, increasingly expect facilities to demonstrate that they are actively managing the parameters that affect equipment integrity, not just documenting them in a binder. Insurance underwriters evaluate IOW program maturity as a leading indicator of mechanical integrity risk, and facilities with automated IOW monitoring consistently receive more favorable risk ratings than facilities relying on manual programs. The investment in digital IOW monitoring pays for itself through a combination of reduced inspection costs, avoided unplanned shutdowns, improved insurance terms, and reduced regulatory exposure.
Integrity Operating Windows, explained plainly
Turn your IOW matrix from an audit document into a living safeguard
iFactory connects your IOW limits to real-time process data, tracks cumulative deviations automatically, and alerts both operators and integrity engineers before cumulative damage invalidates your inspection plans.