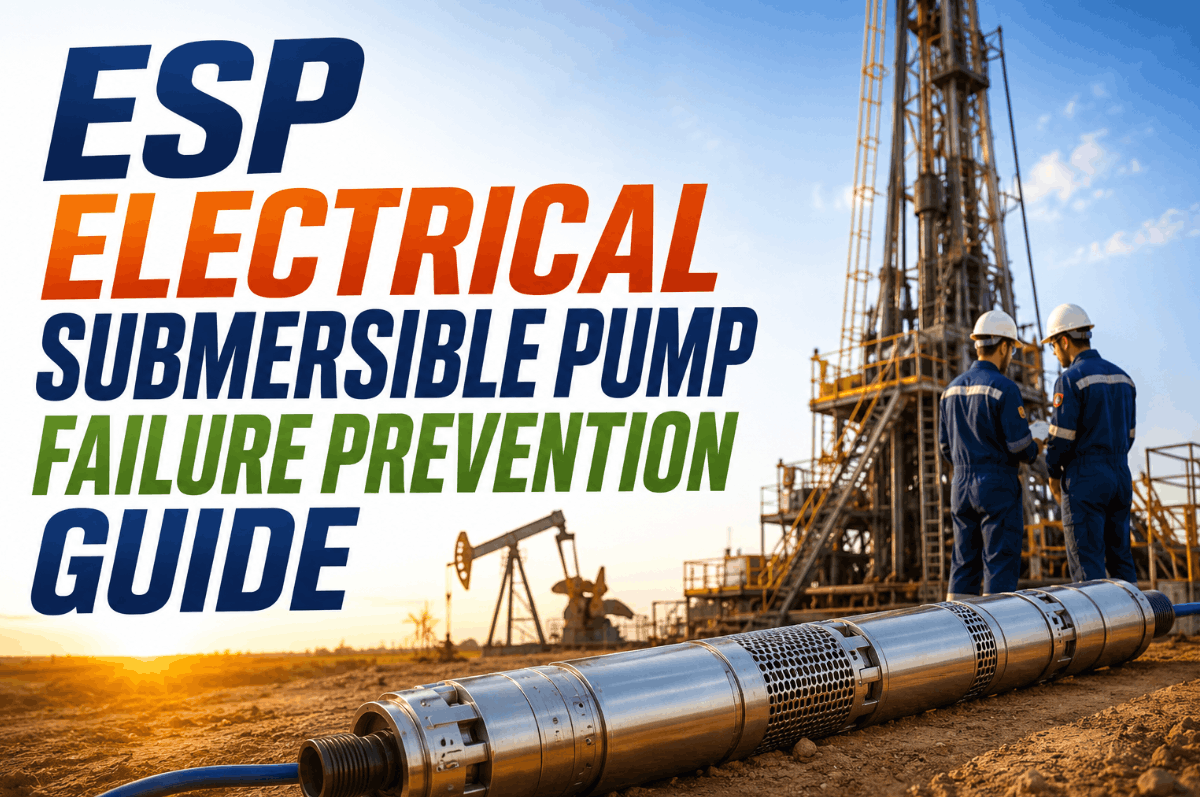
In high-volume oil and gas production, Electrical Submersible Pumps (ESPs) are the workhorse of artificial lift—quietly moving thousands of barrels per day from depths that no conventional pump can reach. Yet for all their output, ESPs remain one of the most failure-prone assets in a wellfield. Industry data consistently shows average run lives hovering between 12 and 18 months, a fraction of what modern engineering makes possible. Gas lock, sand erosion, motor burnout, and scale deposition are not random events—they are predictable failure chains that leave a clear trail in downhole sensor data, ammeter charts, and VSD telemetry long before they cause a pull. The companies extending ESP run life to five years and beyond are not using better hardware alone; they are using smarter diagnostics. This guide walks U.S. production engineers through the failure modes, the signals that precede them, and the AI-driven monitoring architecture that turns reactive workover spending into proactive asset management. Book a Demo to see how iFactory's platform can be deployed across your ESP fleet today.
ESP Failure Prevention: Extending Run Life with Predictive Intelligence
A technical framework for deploying downhole sensors, ammeter analysis, and VSD data to detect gas lock, sand ingress, motor degradation, and scale buildup before they trigger a costly workover.
Six ESP Failure Chains That Drain Workover Budgets
A single ESP pull in a deep horizontal well can cost $250,000 or more once you account for rig time, replacement equipment, and deferred production. Yet most failures trace back to one of six well-understood mechanisms—each with detectable precursors if the right data is being collected. Book a Demo to map iFactory's sensor architecture to your specific well conditions.
Gas Lock
Free gas entering the pump intake causes the impellers to spin in vapor rather than fluid, generating no pressure and severe thermal stress. iFactory's intake pressure and motor temperature analytics flag the onset of gas slugging before the pump deadheads.
Sand and Solids Erosion
Produced sand abrades impeller vanes and diffusers, reducing pump efficiency over weeks. Vibration signature analysis and motor current trending detect the gradual efficiency loss that signals accelerating wear before catastrophic failure.
Motor Burnout
Insufficient cooling flow, voltage imbalance, or repeated thermal cycling degrade motor winding insulation. Continuous winding temperature monitoring and insulation resistance trending through the VSD provide 2–4 weeks of warning before a motor burn.
Scale and Deposition
Calcium carbonate and barium sulfate scale build inside pump stages and reduce flow area, driving pump intake pressure up and discharge pressure down. iFactory correlates pressure differential trends with produced water chemistry logs to predict deposition events.
Cable and Power System Faults
ESP power cables run thousands of feet in high-temperature, high-pressure environments. Insulation breakdown manifests as ground faults and current leakage detectable in VSD output data, giving operators days to plan a controlled pull rather than an emergency workover.
Fluid Underload and Pump-Off
When reservoir inflow drops below the ESP's minimum rate, the pump runs against near-zero fluid—generating heat and vibration that accelerate wear. iFactory's underload detection algorithm integrates motor amperage, wellhead pressure, and flow data to trigger a timely speed reduction via the VSD.
The ESP Diagnostic Stack: Sensors, Data, and AI Layers
Effective ESP failure prevention is not a single sensor—it is a layered architecture where downhole instruments, surface VSD data, and AI analytics work together to close the detection gap that reactive maintenance leaves open.
Downhole Sensor Module (PDC / MWD-class gauges)
Permanent downhole gauges stream real-time pump intake pressure (PIP), pump discharge pressure (PDP), motor temperature, and vibration. PIP trending is the earliest indicator of gas influence or reservoir depletion. A falling PIP paired with rising motor temperature is the classic gas lock precursor signature.
Variable Speed Drive (VSD) Telemetry
The VSD is the ESP's surface brain and its best passive sensor. Output voltage, current per phase, operating frequency, and harmonic distortion data reveal motor health, cable integrity, and pump hydraulic efficiency without any additional hardware. iFactory ingests VSD data via Modbus TCP or SCADA feed at 1-second resolution.
Ammeter Chart Analysis and Motor Current Signature (MCSA)
Historical ammeter charts encode the entire life story of an ESP installation. iFactory's AI digitizes analog ammeter records and applies Motor Current Signature Analysis to detect impeller wear, partial phase loss, and developing mechanical imbalance—patterns invisible to the human eye in raw current traces.
AI Predictive Engine and Alert Layer
iFactory's ML models are trained on failure signatures from thousands of ESP installations across multiple basins. When a combination of sensor trends matches a known precursor pattern, the platform generates a prioritized alert with a plain-language explanation, recommended action, and estimated time-to-failure window—delivered to the production engineer's mobile dashboard.
Reactive vs. Predictive: What the Numbers Look Like
The shift from reactive to predictive ESP management is not an incremental improvement—it is a structural change in how production costs are allocated. The comparison below reflects field data from operations that have deployed iFactory's ESP monitoring platform.
| KPI | Reactive Maintenance | iFactory Predictive | Improvement |
|---|---|---|---|
| Average ESP Run Life | 12–18 months | 48–72 months | 3–4× longer |
| Emergency Workover Events / Year | 4–6 per fleet | 0–1 per fleet | ~85% reduction |
| Mean Time Between Failures (MTBF) | 8–10 months | 36+ months | 4× increase |
| Motor Burnout Rate | 18–22% annually | 3–5% annually | ~80% reduction |
| Cost per Workover Event | $180,000–$400,000 | Planned pull: $80,000–$120,000 | 40–60% lower |
| Production Deferment per Event | 5–14 days | 0–2 days (planned) | Near elimination |
Deploy Predictive ESP Monitoring Across Your Wellfield
iFactory's platform connects to your existing VSD infrastructure and downhole gauges in days—not months. Speak with a production intelligence specialist about protecting your ESP fleet from the six failure modes that cost the industry billions annually.
Deployment Architecture: Four Phases for ESP Fleet Digitization
iFactory's phased deployment model lets operators start with surface-level VSD integration and progressively add downhole instrumentation and AI analytics as the business case compounds. Each tier delivers measurable ROI before the next begins. Book a Demo to align the deployment roadmap with your fleet size and basin conditions.
VSD Data Integration
Connect iFactory's IoT gateway to existing VSDs via Modbus TCP or OPC-UA. Immediately begin trending motor current, voltage imbalance, and operating frequency across the fleet. No downhole work required.
Downhole Gauge Activation
Integrate permanent downhole gauge streams (PIP, PDP, motor temp, vibration) into the iFactory platform. Enable gas lock and pump-off detection algorithms tuned to each well's fluid and reservoir characteristics.
AI Failure Prediction Models
Deploy basin-specific ML models trained on historical failure data. Enable automated MCSA on ammeter archives. Generate prioritized workover scheduling recommendations based on predicted time-to-failure windows.
Autonomous VSD Optimization
Close-loop integration between iFactory's AI and VSD controllers enables autonomous speed adjustments in response to gas slugging, underload conditions, and thermal stress—without operator intervention.
Regulatory and Reporting Alignment
iFactory's ESP monitoring platform generates the auditable production and equipment records required under U.S. federal and state reporting frameworks, while supporting corporate ESG commitments tied to artificial lift efficiency.
| Framework | Data Requirement | iFactory Value |
|---|---|---|
| BSEE / BOEM | Equipment integrity and failure event reporting for offshore operations | Automated failure event logs with timestamped sensor data for regulatory submissions |
| EPA Subpart W | Fugitive emissions associated with well operations and artificial lift | Motor runtime and operational event data supporting emissions calculation accuracy |
| ISO 55001 | Asset management system documentation and maintenance records | Complete maintenance history, alert logs, and condition-based maintenance evidence |
| ESG / Scope 1 Reporting | Operational efficiency and deferred production metrics | Run life improvement and energy consumption per barrel data for sustainability reports |
"We were pulling ESPs every 14 months on average in our Permian Basin horizontal wells—mostly gas lock and motor burns we never saw coming. After deploying iFactory's monitoring across 40 wells, we've gone 38 months without an emergency pull. The platform flagged three developing motor faults and two gas lock conditions in the first quarter alone. Those five planned interventions would have been five unplanned workovers. The ROI was obvious within six months."
ESP Failure Prevention: Frequently Asked Questions
Q: How does iFactory detect gas lock before the pump deadheads?
The platform monitors pump intake pressure and motor amperage simultaneously—a dropping PIP combined with rising motor temperature and decreasing current is the earliest detectable gas lock signature, typically appearing 12–48 hours before pump deadhead.
Q: Can the platform work with existing VSDs from multiple manufacturers?
Yes. iFactory connects to Schneider Electric, ABB, Siemens, and other major VSD brands via standard Modbus TCP or OPC-UA protocols, so no VSD replacement is required to get started.
Q: How long does initial deployment take?
Surface VSD integration is typically complete within 2–5 days per well cluster; downhole gauge integration and AI model baseline establishment follow within 30–45 days of live data collection.
Q: Does iFactory support offshore ESP installations?
Yes. The platform's IoT gateways are rated for offshore environments and support satellite and subsea fiber connectivity, with full BSEE-compliant data logging for offshore regulatory reporting.
Q: How does the platform handle sand erosion monitoring without a downhole sand probe?
iFactory's AI tracks pump hydraulic efficiency degradation through VSD current and pressure data—a consistent efficiency decline of 0.5–1.5% per week is a reliable proxy for abrasive wear even without a dedicated sand sensor.
Conclusion: The Run Life Gap Is a Data Gap
The difference between an ESP fleet that averages 14 months and one that averages 5 years is not the quality of the hardware—it is the quality of the monitoring. Gas lock, sand erosion, motor degradation, and cable faults all leave measurable signatures in downhole sensor data, VSD telemetry, and ammeter charts weeks before they cause a pull. The operators closing this gap are not waiting for failure; they are reading the data their equipment is already generating and acting on it. iFactory's AI platform is the analytics layer that turns raw sensor streams into prioritized maintenance decisions—protecting capital, reducing workover spending, and extending the productive life of every pump in the wellfield. Book a Demo and let our production engineers show you what your ESP fleet's data is already telling you.
Ready to Extend Your ESP Run Life Beyond 5 Years?
Connect with an iFactory production intelligence specialist and build a monitoring roadmap tailored to your basin, well count, and VSD infrastructure.