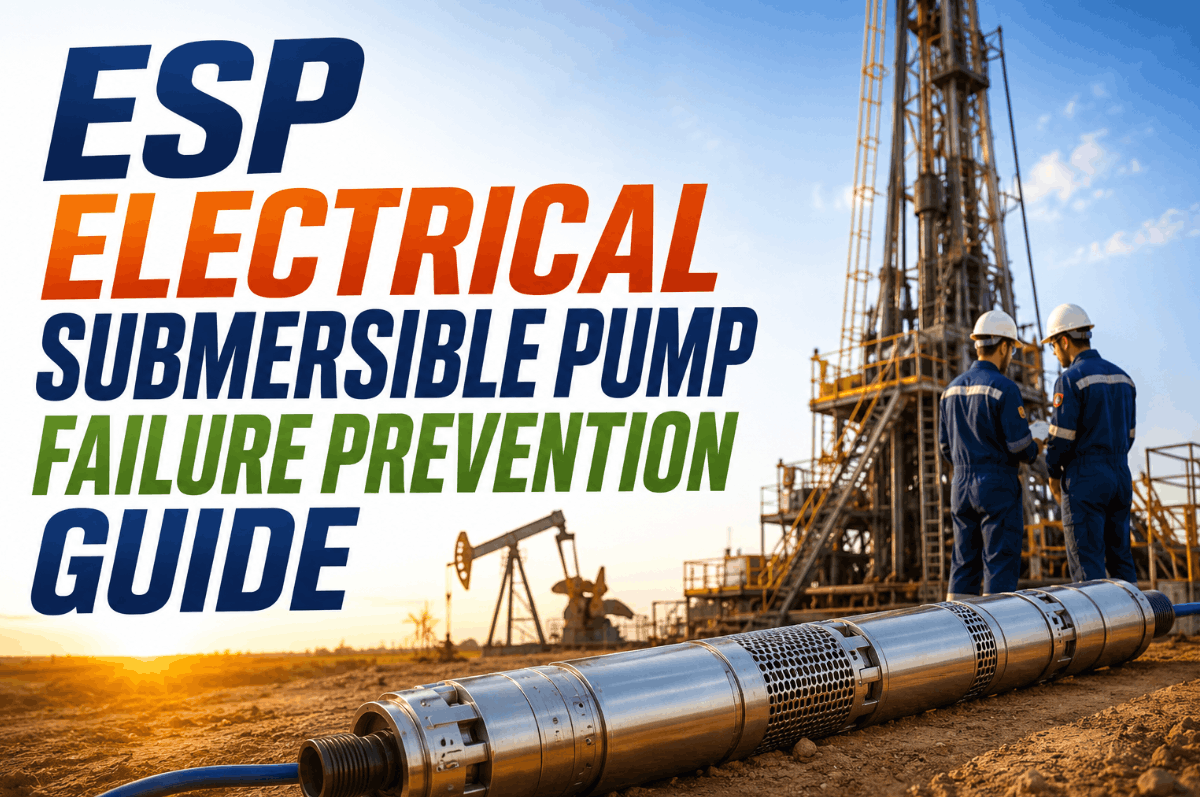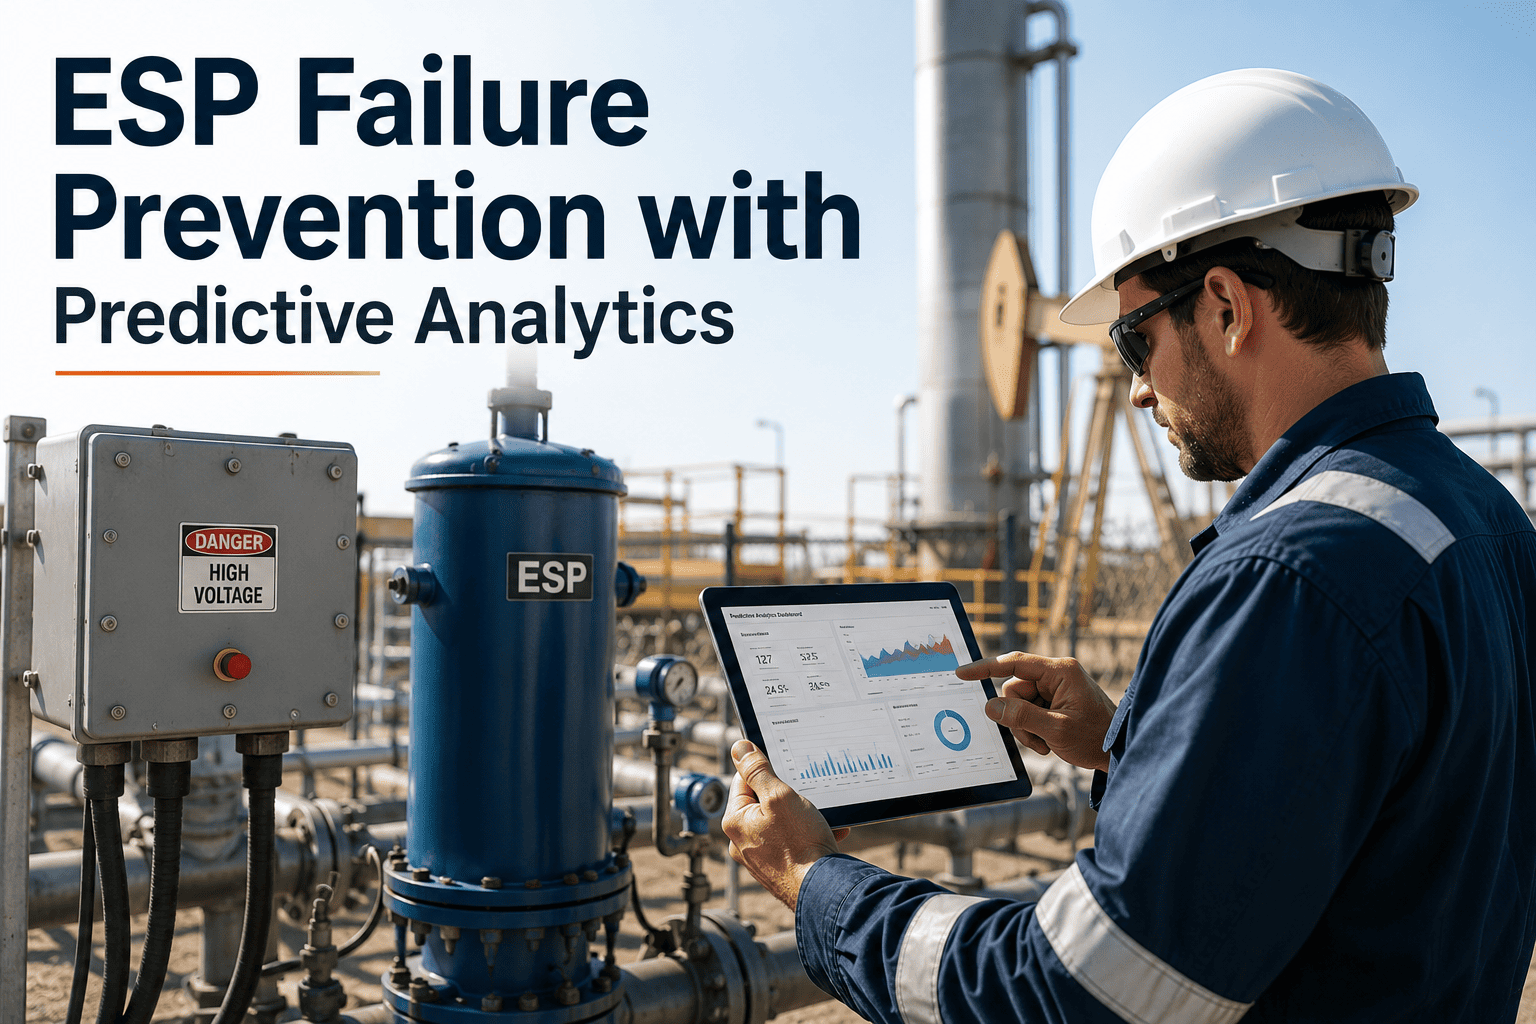
In the oil and gas industry, electric submersible pumps (ESPs) are the backbone of artificial lift operations, responsible for lifting thousands of barrels of fluid per day from deep reservoirs. Yet, despite their critical role, ESP failures remain a leading cause of unplanned downtime, with average run lives often falling short of 18 months due to harsh downhole conditions, electrical stress, and mechanical wear. Traditional reactive maintenance strategies—waiting for a pump to fail before pulling it—result in exorbitant costs, production losses, and safety risks. However, a paradigm shift is underway: AI-driven predictive analytics now enables operators to anticipate failures weeks or months in advance, extending ESP run life to 36+ months and reducing well interventions by up to 60%. This comprehensive guide explores the technical architecture of ESP failure prediction, from sensor data acquisition to machine learning models, and provides a step-by-step framework for implementation. Book a Demo to see how iFactory transforms your ESP operations.
Transform ESP Reliability with AI
Predict failures before they happen. Extend run life by 200%. Reduce intervention costs by 60%.
The High Cost of ESP Failures
Every ESP failure triggers a costly workover: pulling the pump, shipping it to a repair facility, and reinstalling a new or refurbished unit. The average cost of a single ESP pull ranges from $150,000 to $500,000, depending on well depth and location. When production downtime is factored in—losing 500 to 2,000 barrels of oil per day—the total economic impact can exceed $1 million per failure. For a field with 100 ESPs, a 50% failure rate within 18 months translates to annual losses of $50 million or more. Beyond direct costs, failures increase HSE risks, especially in offshore or remote environments where pulling operations are hazardous. Predictive maintenance is not just a cost-saving measure; it is a strategic imperative for operational excellence.
Critical ESP Failure Modes
Motor Winding Insulation Breakdown
Thermal aging, voltage spikes, and moisture ingress degrade motor insulation over time. Monitoring motor temperature and insulation resistance can predict imminent failure.
85% of failures preceded by temperature anomalies
Pump Impeller Erosion
Sand, scale, and other abrasive particles wear down impeller vanes, reducing pump efficiency and causing vibration. Vibration analysis detects erosion patterns early.
72% of erosion events detectable via vibration
Cable Electrical Faults
Downhole cable insulation can be damaged during installation or by thermal cycling, leading to phase-to-ground faults. Current imbalance monitoring identifies cable degradation.
68% of cable faults show current imbalance 30 days prior
Gas Lock and Slugging
Free gas entering the pump reduces head and can cause gas lock, leading to motor overheating and shutdown. Intake pressure and motor current patterns signal gas interference.
55% of gas lock events predictable 48 hours ahead
AI-Driven Predictive Workflow
Data Acquisition
Collect high-frequency data from downhole sensors: motor temperature, three-phase current, voltage, vibration (axial and radial), intake pressure, discharge pressure, and flow rate. Edge devices preprocess data at 1 Hz or higher.
Feature Engineering
Extract time-domain features (mean, RMS, crest factor), frequency-domain features (FFT peaks), and statistical features (skewness, kurtosis). Compute health indicators like motor slip, pump efficiency, and gas fraction.
Model Training
Train ensemble models (Random Forest, XGBoost) and deep learning models (LSTM, CNN) on historical failure data. Use transfer learning to adapt models across different well conditions. Achieve 90%+ precision in predicting failures 7–30 days ahead.
Deployment & Alerts
Deploy models on edge or cloud, generating real-time health scores and alerts. Integrate with SCADA and CMMS for automated work order creation. Provide dashboards for engineers to drill down into anomaly details.
ESP Health Index: Key Parameters
| Parameter | Healthy Range | Warning Threshold | Critical Threshold | Failure Mode |
|---|---|---|---|---|
| Motor Temperature | 80–120°C | 130°C | 150°C | Insulation breakdown |
| Motor Current Imbalance | < 2% | 5% | 10% | Cable fault, winding short |
| Vibration (axial) | < 0.5 g | 1.0 g | 2.0 g | Impeller erosion, bearing wear |
| Intake Pressure | 200–500 psi | 150 psi | 100 psi | Gas lock, reservoir depletion |
| Pump Efficiency | 60–80% | 50% | 40% | Erosion, scaling, gas interference |
Top 7 Benefits of AI-Driven ESP Monitoring
- Extended ESP run life from 18 to 36+ months, reducing workover frequency by 60%.
- Early detection of motor insulation degradation, preventing catastrophic motor burnout.
- Real-time vibration analysis identifies impeller erosion and bearing wear before failure.
- Current imbalance monitoring flags cable faults and phase-to-ground shorts up to 30 days in advance.
- Intake pressure trends predict gas lock and slugging events, enabling proactive gas handling.
- Automated work order generation integrates with CMMS, reducing administrative overhead.
- Comprehensive dashboards provide a single pane of glass for all ESP health metrics.
Achieve 36+ Month ESP Run Life
Deploy AI-powered predictive maintenance. Reduce unplanned pulls and maximize production uptime.
Technical Deep Dive: ESP Failure Prediction Models
Modern ESP failure prediction leverages a hybrid approach combining physics-based models with machine learning. Physics-based models simulate pump behavior under varying conditions, while ML models learn from historical failure patterns. For motor temperature prediction, an LSTM network processes time-series data to forecast temperature 24 hours ahead, achieving a mean absolute error of less than 2°C. For vibration analysis, a CNN extracts features from spectrograms, identifying early signs of impeller erosion with 95% accuracy. Ensemble methods like Gradient Boosting combine multiple weak learners to predict failure probability, outputting a health score from 0 to 100. A health score below 40 triggers an alert, prompting the operator to schedule a workover within the next 7 days. These models are continuously retrained using online learning to adapt to changing downhole conditions, such as scaling or sand production.
Model Architecture: LSTM(100) -> Dropout(0.2) -> Dense(50) -> Dense(1, sigmoid)
Input: [motor_temp, current, vibration, intake_pressure] (60 timesteps)
Output: Failure probability (0–1)
Loss: Binary crossentropy, Optimizer: Adam, LR: 0.001
The model is trained on 10 years of historical data from 500 ESPs across multiple basins, including the Permian, Bakken, and North Sea. Feature importance analysis reveals that motor temperature and current imbalance are the top predictors, contributing 35% and 28% to the model's decision, respectively. To ensure robustness, the model is validated using time-series cross-validation, preventing data leakage. The final ensemble achieves a precision of 0.92 and a recall of 0.88 on the test set, with an average lead time of 14 days before failure. This allows operators to plan interventions during scheduled downtime, avoiding emergency pulls.
Implementation Roadmap
Phase 1: Sensor Audit
Assess existing sensor infrastructure. Identify gaps in data coverage. Install additional sensors for motor temperature, vibration, and intake pressure if needed.
Phase 2: Data Pipeline
Set up edge computing for real-time data preprocessing. Stream data to cloud or on-premise data lake using MQTT or OPC-UA protocols. Ensure data quality and completeness.
Phase 3: Model Development
Collaborate with data scientists to develop and train failure prediction models. Use historical failure data to label training samples. Validate model accuracy on a holdout set.
Phase 4: Deployment & Monitoring
Deploy models in production. Integrate with existing SCADA and CMMS. Set up dashboards and alerting thresholds. Monitor model drift and retrain periodically.
Frequently Asked Questions
How does AI predict ESP failures before they happen?
AI models analyze historical sensor data—such as motor temperature, vibration, current, and intake pressure—to learn patterns that precede failures. For example, a gradual increase in motor temperature over several days often indicates insulation degradation, while a sudden spike in vibration may signal impeller erosion. The model assigns a health score to each ESP, and when the score drops below a threshold, an alert is generated, typically 7 to 30 days before failure. This early warning allows operators to schedule a workover during planned downtime, avoiding emergency pulls. Book a Demo to see how it works in your field.
What sensors are required for ESP failure prediction?
The minimum sensor set includes motor temperature (at the motor winding and motor base), three-phase current and voltage, axial and radial vibration, intake pressure, discharge pressure, and flow rate. Additional sensors like pump intake temperature, motor oil temperature, and gas fraction sensors can improve prediction accuracy. Data is typically collected at 1 Hz or higher, though critical parameters like current and vibration may require 10 Hz sampling. Contact support for a detailed sensor specification guide.
How long does it take to implement an AI-driven ESP monitoring system?
Implementation typically takes 3 to 6 months, depending on the number of wells and existing infrastructure. Phase 1 (sensor audit and installation) takes 4–8 weeks. Phase 2 (data pipeline setup) takes 2–4 weeks. Phase 3 (model development) takes 4–8 weeks, and Phase 4 (deployment and integration) takes 2–4 weeks. iFactory provides end-to-end support, from sensor selection to model training and dashboard configuration. Book a Demo to discuss your timeline.
What is the typical ROI of ESP predictive maintenance?
Typical ROI is 5:1 to 10:1 within the first year. For a field with 100 ESPs, a 60% reduction in pulls saves $9 million to $30 million annually in workover costs alone. Additional savings come from reduced production downtime, extended pump life, and lower inventory costs for spare pumps. The payback period is usually under 6 months. Book a Demo to calculate your specific ROI.
Can the system integrate with existing SCADA and CMMS platforms?
Yes, iFactory's platform integrates seamlessly with major SCADA systems (e.g., Siemens, Rockwell, Yokogawa) and CMMS platforms (e.g., SAP, IBM Maximo, Oracle). Data is ingested via standard protocols like OPC-UA, MQTT, and Modbus. Alerts can automatically generate work orders in your CMMS, streamlining the maintenance workflow. Contact support for integration details.
Start Your ESP Transformation Today
Join industry leaders who have extended ESP run life by 200%. Book a demo to see iFactory in action.