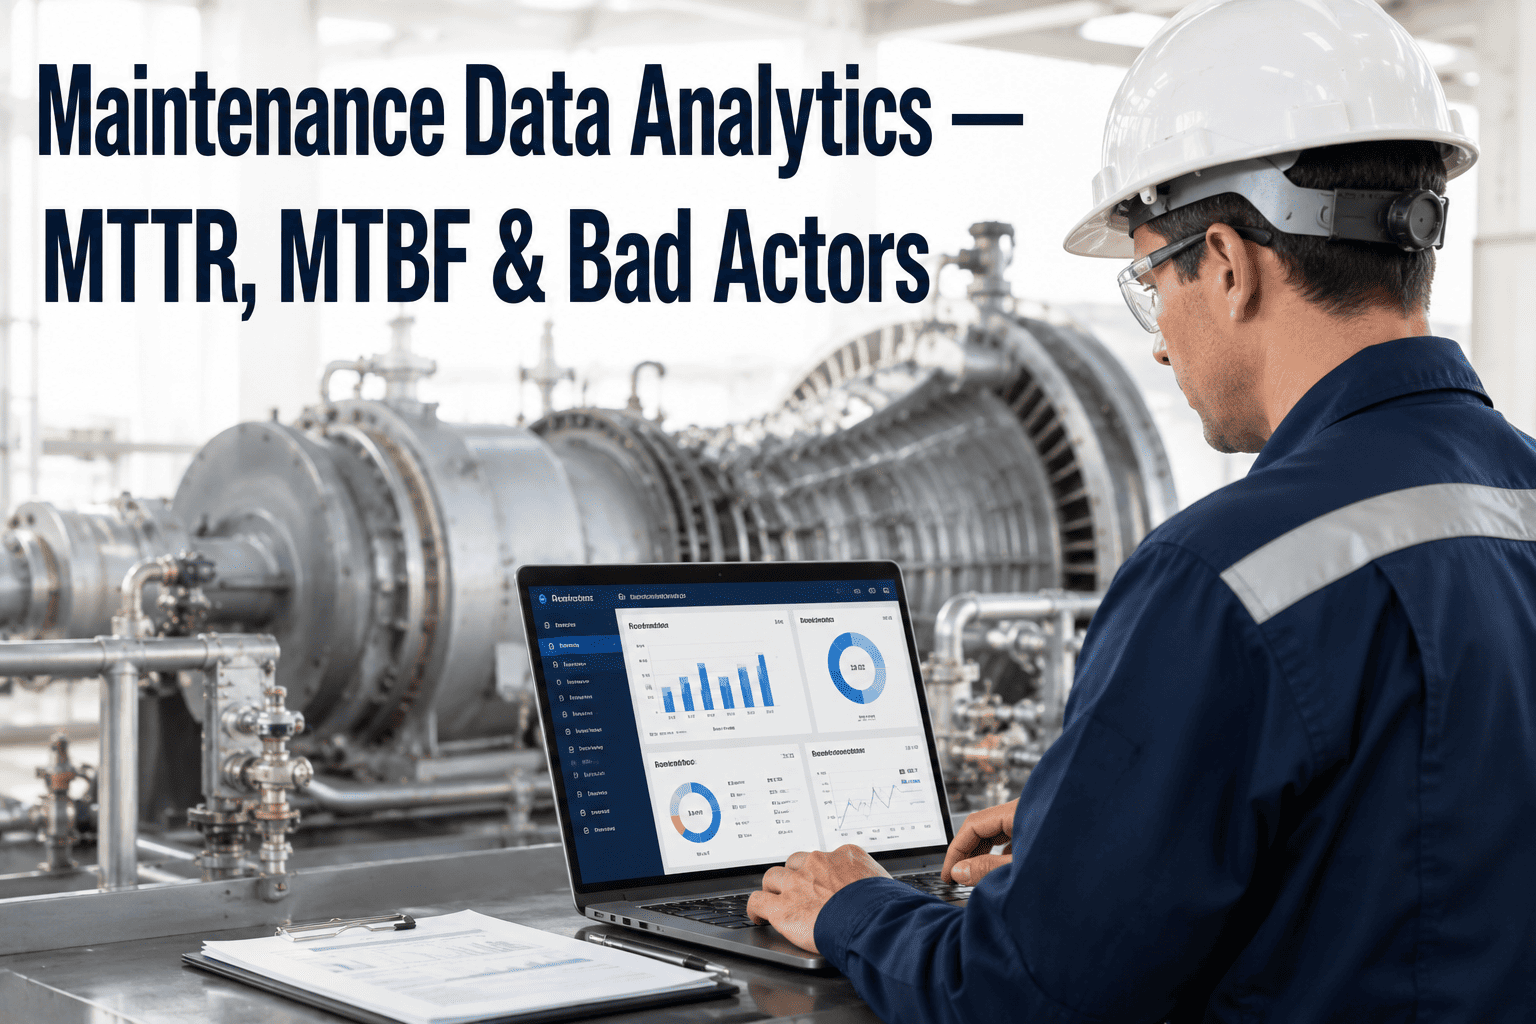
In the high-stakes environment of oil and gas operations, unplanned downtime can cost millions of dollars per hour. Traditional maintenance strategies are no longer sufficient to meet the demands of Industry 4.0. Maintenance data analytics, powered by AI and machine learning, offers a transformative approach to turn raw failure data into actionable reliability intelligence. By systematically tracking key performance indicators like Mean Time to Repair (MTTR) and Mean Time Between Failures (MTBF), and identifying bad actor equipment, plant managers and maintenance directors can prioritize improvement projects with the highest financial impact. This guide provides a deep-dive into the methodologies, technologies, and best practices for implementing a robust maintenance data analytics framework. For organizations ready to accelerate their digital transformation, Book a Demo with our team to see how iFactory's AI-driven platform can deliver measurable ROI.
Transform Your Maintenance Data into Profit
Unlock hidden savings by identifying chronic failures and optimizing repair workflows with iFactory's predictive analytics.
Why Maintenance Data Analytics Matters in Oil & Gas
The Cost of Unplanned Downtime
In the oil and gas sector, unplanned downtime can range from $500,000 to over $5 million per day depending on the facility. Traditional reactive maintenance leads to extended outages, safety risks, and lost production. Maintenance data analytics provides a proactive alternative by using historical failure data to predict and prevent equipment failures before they occur.
From Data to Decision Intelligence
Modern sensors and CMMS systems generate vast amounts of data. However, without proper analytics, this data remains siloed and underutilized. By applying statistical models and machine learning algorithms, maintenance teams can identify patterns, correlate failures with operating conditions, and make data-driven decisions that improve reliability and reduce costs.
Regulatory and Safety Compliance
Oil and gas facilities operate under strict regulatory frameworks (OSHA, API, ISO 55000). Maintenance data analytics helps ensure compliance by providing auditable records of equipment performance, maintenance activities, and failure trends. This transparency reduces the risk of fines and enhances safety culture.
Core Maintenance KPIs: MTTR, MTBF, and Beyond
Mean Time Between Failures (MTBF)
MTBF measures the average time between consecutive failures of a repairable system. A higher MTBF indicates greater reliability. In oil and gas, tracking MTBF for critical rotating equipment like compressors and pumps helps prioritize preventive maintenance schedules.
Industry benchmark: 12-18 months for critical pumps
Mean Time to Repair (MTTR)
MTTR calculates the average time required to restore a failed asset to operational status. Lower MTTR means faster recovery and less production loss. Analyzing MTTR trends helps identify inefficiencies in repair processes, spare parts availability, and technician training.
Target reduction: 20-30% through digital work orders
Overall Equipment Effectiveness (OEE)
OEE combines availability, performance, and quality to provide a holistic view of equipment productivity. For oil and gas, OEE is critical for identifying bottlenecks in upstream, midstream, and downstream operations.
World-class OEE: 85% or higher
Failure Frequency and Severity
Beyond averages, tracking the frequency and severity of failures helps classify bad actors. A pump failing once with a 10-hour repair is different from one failing 10 times with 1-hour repairs. Both require different strategies.
Severity index: 1-10 based on downtime cost
Identifying and Managing Bad Actor Equipment
Data Collection and Cleansing
Aggregate data from CMMS, SCADA, and IoT sensors. Cleanse for duplicates, missing timestamps, and inconsistent coding. This foundational step ensures accuracy in subsequent analysis.
Failure Mode Classification
Classify each failure by mode (e.g., bearing wear, seal leak, electrical fault). Use a standardized taxonomy like ISO 14224 to enable benchmarking across sites.
Pareto Analysis and Ranking
Apply the 80/20 rule: typically 20% of assets cause 80% of downtime. Rank equipment by total downtime cost, failure frequency, or MTBF deviation from target.
Root Cause Investigation
For top bad actors, conduct RCA using fishbone diagrams or 5-Whys. Determine if the root cause is design, operation, or maintenance-related.
Action Plan and Monitoring
Develop targeted improvement projects (e.g., redesign, upgraded materials, operator training). Track MTBF and MTTR post-intervention to validate ROI.
Ready to Eliminate Bad Actors?
Leverage AI-powered analytics to pinpoint chronic failures and prioritize improvements that maximize ROI. Schedule a personalized demo today.
Building a Maintenance Data Analytics Framework
Step 1: Define KPIs and Targets
Align on which metrics matter most: MTBF, MTTR, OEE, failure frequency, or maintenance cost per unit. Set realistic targets based on historical data and industry benchmarks.
Step 2: Integrate Data Sources
Connect CMMS, EAM, SCADA, and IoT platforms into a unified data lake. Use APIs or middleware to ensure real-time data flow. iFactory's platform offers pre-built connectors for major oil and gas systems.
Step 3: Implement Analytics Engine
Deploy statistical models for trend analysis, anomaly detection, and predictive maintenance. Machine learning algorithms can forecast failures 2-4 weeks in advance, giving teams time to plan interventions.
Step 4: Visualize and Report
Create dashboards that display real-time KPIs, bad actor rankings, and improvement project status. Use drill-down capabilities to investigate specific assets or failure modes.
Step 5: Continuous Improvement Loop
Review analytics outputs monthly with cross-functional teams. Update models with new failure data, adjust targets, and refine action plans. This closed-loop approach ensures sustained reliability gains.
Reactive vs. Predictive Maintenance: A Data-Driven Comparison
| Metric | Reactive Maintenance | Predictive Maintenance with Analytics |
|---|---|---|
| Average MTBF | 6 months | 18 months |
| Average MTTR | 24 hours | 8 hours |
| Unplanned downtime (hours/year) | 480 | 120 |
| Maintenance cost as % of RAV | 8% | 3% |
| Bad actor identification time | 3-6 months | 1-2 weeks |
Real-World Impact: Offshore Platform Case Study
A major offshore operator implemented iFactory's maintenance data analytics across 12 platforms. Within 6 months, they identified 47 bad actor assets responsible for 63% of all downtime. By focusing on these assets, they achieved a 28% reduction in MTTR and a 41% increase in MTBF for critical compressors. The annual savings exceeded $3.2 million, with a payback period of less than 4 months.
Frequently Asked Questions
What is a bad actor in maintenance analytics?
A bad actor is an asset that disproportionately contributes to downtime, maintenance costs, or safety incidents. These are typically identified through Pareto analysis of failure frequency, downtime hours, or repair costs. In oil and gas, common bad actors include centrifugal pumps, reciprocating compressors, and heat exchangers. Once identified, targeted improvement projects can be prioritized based on financial impact. For more details on how iFactory's platform automates bad actor identification, visit our support page or book a demo.
How do you calculate MTTR and MTBF in oil and gas?
MTTR is calculated by dividing total corrective maintenance time by the number of corrective maintenance actions over a given period. MTBF is calculated by dividing total operating time by the number of failures. Both metrics require accurate data on failure timestamps and operating hours. Advanced analytics platforms like iFactory automatically compute these KPIs from CMMS data, adjusting for planned downtime and seasonal variations. For a step-by-step guide, check our knowledge base.
What are the key benefits of maintenance data analytics?
Key benefits include reduced unplanned downtime (30-50% reduction), extended asset life (20-40% increase), lower maintenance costs (15-30% reduction), improved safety through fewer failure-related incidents, and enhanced regulatory compliance. Analytics also enables more accurate budgeting and resource allocation. To see how your organization can achieve these results, schedule a demo.
How often should maintenance KPIs be reviewed?
Leading organizations review high-level KPIs (MTBF, MTTR, OEE) on a weekly basis, with detailed bad actor analysis monthly. Real-time dashboards allow for immediate anomaly detection. Quarterly reviews should assess the effectiveness of improvement projects and adjust targets. iFactory's platform provides customizable reporting schedules and alerting for critical deviations. For best practices, visit our support portal.
What is the ROI of implementing maintenance data analytics?
ROI varies by facility size and current maintenance maturity, but typical payback periods range from 3 to 12 months. For a mid-size refinery with 500 critical assets, annual savings from reduced downtime, lower repair costs, and optimized inventory can exceed $2 million. iFactory's platform delivers measurable ROI through automated analytics and actionable insights. To calculate potential savings for your facility, book a demo.
Start Your Reliability Transformation Today
Empower your maintenance team with data-driven insights that reduce downtime, cut costs, and improve safety. Partner with iFactory to unlock the full potential of your maintenance data.