Sulfur Recovery Unit Performance Analytics with AI

By Johnson on July 4, 2026

sulfur-recovery-unit-performance-analytics-ai

Sulfur Recovery Units are among the most environmentally critical process units in any refinery, converting toxic hydrogen sulfide from amine treating systems into elemental sulfur while maintaining emissions compliance under increasingly strict regulatory frameworks. A single SO2 exceedance event can trigger fines ranging from $50,000 to over $500,000 depending on jurisdiction, not counting the operational disruption of reducing crude throughput or shutting down upstream units to eliminate the H2S feed source. Yet most refineries monitor SRU performance through periodic lab analysis, single-point DCS alarms, and manual log reviews that provide snapshot visibility rather than continuous process intelligence. AI-powered performance analytics from iFactory continuously correlates thermal stage efficiency, catalytic converter performance, tail gas composition, and incinerator conditions to detect deviations before they become compliance events.

Claus Process · TGTU · Incinerator · Tail Gas · Emissions

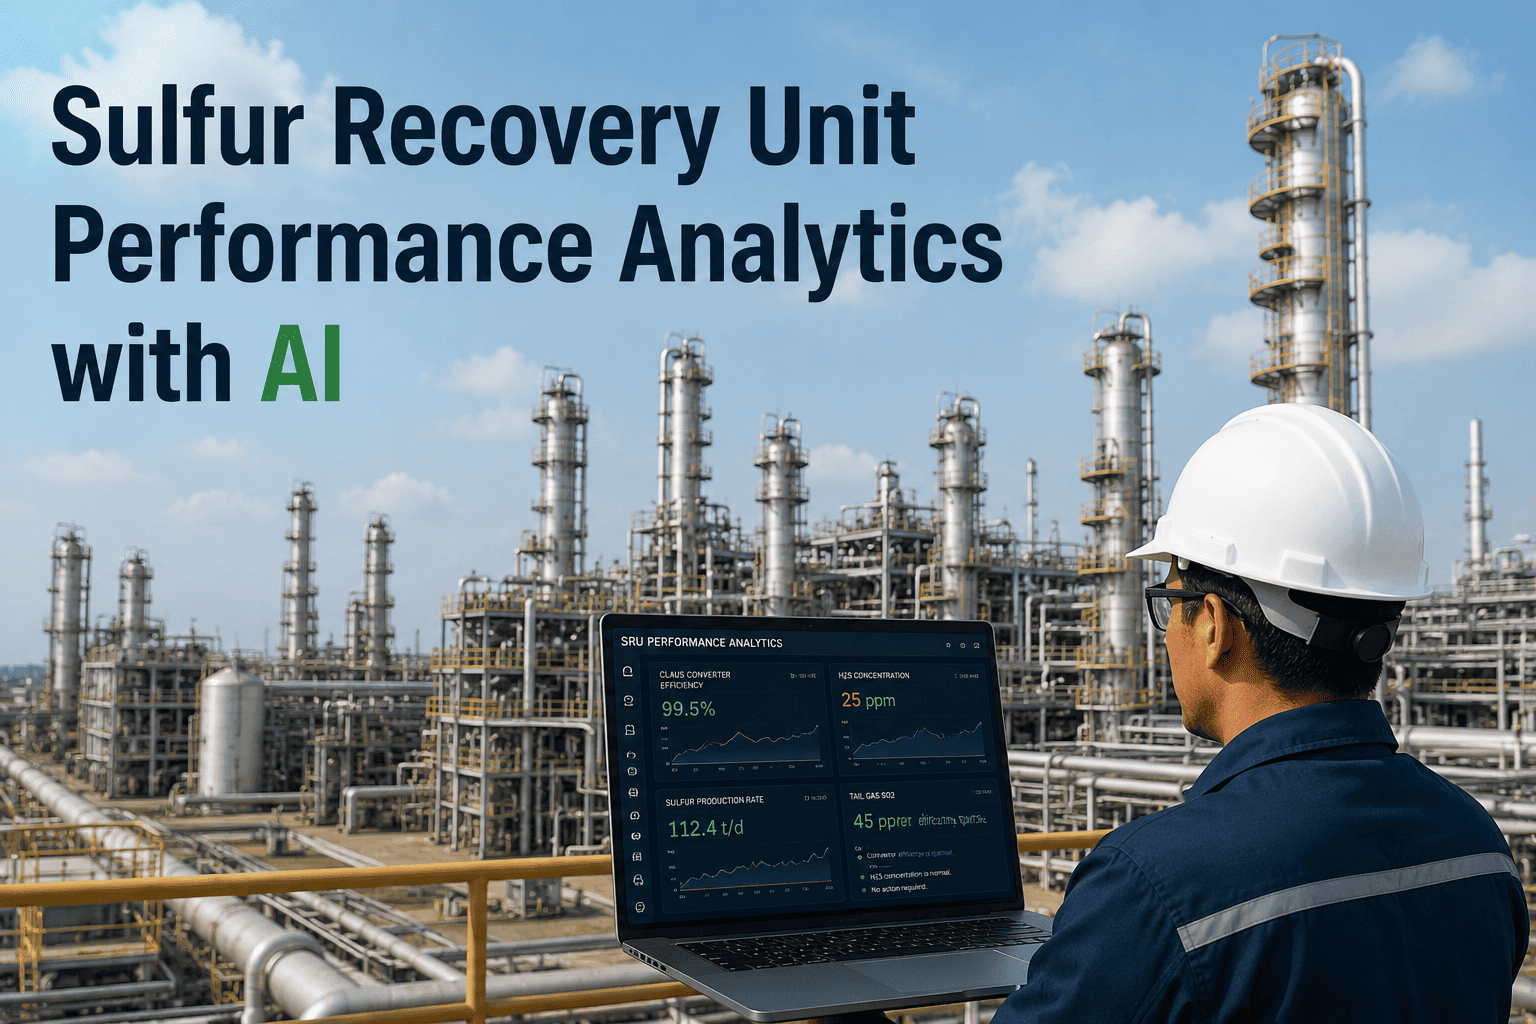
Sulfur Recovery Unit Performance Analytics: AI-Driven Monitoring for Compliance, Efficiency, and Reliability

iFactory delivers continuous process analytics across every stage of sulfur recovery — from acid gas feed through thermal combustion, catalytic conversion, condensation, tail gas treating, and incineration — giving SRU operators the early warning capability that periodic sampling and single-point alarms cannot provide.

99.5%+ Sulfur recovery efficiency required by EPA in many U.S. jurisdictions for refinery SRUs
$50K–$500K+ Potential fine range per SO2 exceedance event depending on state and severity level
92–97% Typical sulfur recovery from Claus process alone before tail gas treating is added
24–72 Hrs Average delay between SRU process deviation onset and detection through manual review
2.0:1 Ideal H2S to SO2 ratio in tail gas — the single most critical SRU control parameter

The Claus Process Stage by Stage: Where AI Monitoring Identifies Hidden Efficiency Loss

Sulfur recovery through the Claus process is a multi-stage chain reaction where each stage sets the conditions for every stage that follows. The thermal reactor determines the initial H2S conversion and the H2S:SO2 ratio that catalytic stages must work with. Each catalytic converter depends on precise inlet temperature control to maintain reaction kinetics while avoiding sulfur condensation on the catalyst surface. Condensers between stages must remove sulfur efficiently without cooling the gas below the sulfur dew point of the next stage. When any single stage operates off its optimal window, the efficiency loss compounds through every downstream stage — but traditional monitoring systems evaluate each stage independently, missing the cascading effects that provide the earliest indication of developing problems.

1
Acid Gas Feed and Conditioning
H2S-rich gas from amine treating units enters the SRU after knockout drum separation. Feed composition variability and hydrocarbon content directly affect thermal stage combustion stability and downstream conversion efficiency.
Flow Rate H2S Concentration HC Content
2
Thermal Reactor (Claus Furnace)
Operates at 1000–1400C converting one-third of H2S to SO2 through partial combustion. The H2S:SO2 ratio established here determines the theoretical maximum recovery achievable across all subsequent catalytic stages.
Furnace Temp Air Demand Flame Status
3
Waste Heat Boiler and First Condenser
Cools combustion products from furnace outlet temperature while generating steam. First-stage condenser removes approximately 60–70% of elemental sulfur produced in the thermal stage before gas enters catalytic conversion.
Outlet Temp Steam Gen Sulfur Drain
4
Catalytic Converters with Reheaters
Two to three catalytic stages each perform reheat, Claus reaction, and condensation. Bed inlet temperature must stay above sulfur dew point to prevent liquid sulfur condensing on catalyst and causing permanent deactivation.
Bed Inlet Temp Bed Outlet Temp Pressure Drop
5
Tail Gas Treating Unit
Raises overall recovery from 95–97% to 99.5%+ by converting remaining sulfur compounds. TGTU performance directly determines whether the SRU meets its environmental permit requirements for stack emissions.
Tail Gas H2S Solvent Loading Regeneration Temp
6
Thermal Oxidizer and Stack
Final stage destroys any remaining H2S and reduced sulfur compounds before stack discharge. Incinerator temperature must maintain above 600C with sufficient residence time to ensure complete combustion to SO2.
Incinerator Temp O2 Level Stack SO2

Three Performance Indicators That Reveal Whether Your SRU Is Optimized or Drifting

Most SRU performance problems do not announce themselves through a single alarm — they develop gradually through the interaction of multiple parameters that individually remain within acceptable ranges but collectively indicate a unit that is no longer operating at its optimal efficiency point. iFactory tracks three composite performance indicators that capture the overall health of the sulfur recovery process more effectively than any single DCS measurement.

2.0:1
H2S:SO2 Ratio Control Index
Measures how closely the actual tail gas ratio maintains the stoichiometric target. Each 0.1 deviation from 2.0 reduces overall sulfur recovery by 0.15–0.3 percentage points, directly increasing stack emissions.
Without AI: 1.6:1 to 2.8:1 typical swing range
With AI: Maintained within 1.9:1 to 2.1:1 continuously
99.5%+
Sulfur Recovery Efficiency Tracker
Calculates overall recovery in real time using mass balance across all stages rather than relying on periodic lab samples. A 0.5% efficiency loss represents 2–5 additional tons per day of sulfur released to atmosphere.
Without AI: Known only from 24-hour composite lab results
With AI: Continuous calculation updated every scan cycle
15%+
Stack Emissions Safety Margin
Tracks the distance between current SO2 stack concentration and the permit limit. Operating within 5–10% of limit means any process upset causes an exceedance — AI maintains margin through proactive ratio control.
Without AI: Typically operating 5–10% below permit limit
With AI: Maintained 15–25% below permit limit consistently

Emissions Risk Classification: Understanding Which SRU Deviations Put Your Permit at Risk

Not all SRU process deviations carry the same compliance consequence. Understanding the severity tier of each failure mode allows operations teams to prioritize response actions and allocate monitoring attention where it matters most for environmental compliance. iFactory classifies SRU deviations into three risk tiers based on their direct impact on stack emissions and permit compliance.

CRITICAL — Immediate Exceedance Risk
SO2 stack concentration approaching or exceeding permit limit — active compliance event requiring immediate air demand correction or unit rate reduction
Thermal reactor flame loss or instability — eliminates primary H2S conversion stage, causing massive sulfur throughput loss to tail gas and stack
Incinerator temperature below 600C minimum — leaves H2S and reduced sulfur species uncombusted, directly increasing toxic stack emissions
Liquid carryover from amine unit reaching Claus furnace — causes temperature excursions, flame instability, and potential thermal stage shutdown
HIGH — Compliance Risk Within 24–72 Hours
Catalytic converter bed temperature falling below sulfur dew point — causes liquid sulfur condensation on catalyst, permanently reducing activity and conversion
Tail gas analyzer failure or drift exceeding 15% — operators lose primary ratio control feedback, causing air demand to drift off stoichiometric target
Condenser outlet temperature rising above design specification — sulfur vapor carryover to next catalytic stage increases fouling and reduces conversion efficiency
Air-to-acid-gas ratio control loop oscillating — creates cyclical ratio swings that reduce average recovery efficiency and increase emission variability
MODERATE — Gradual Efficiency Degradation
Catalyst activity declining as measured by per-stage conversion efficiency trending downward over weeks — reduces total recovery capacity
Sulfur pit level control instability causing intermittent condenser drainage issues — affects condenser heat transfer performance
Minor H2S:SO2 ratio deviation within 10% of 2.0 target — recoverable through air demand adjustment but reduces margin to permit limit
Reheater steam consumption trending above normal — indicates declining heat exchange efficiency requiring maintenance scheduling

SRU Parameter Monitoring: Traditional DCS Alarms vs AI Process Analytics

The fundamental difference between traditional SRU monitoring and AI-driven analytics is not the data itself — both use the same instruments and measurements. The difference is in how the data is interpreted. DCS alarms evaluate each parameter against a fixed threshold independently. AI analytics evaluate parameters in the context of their interrelationships, operating conditions, and historical trends — identifying deviations that are invisible to threshold-based monitoring because no single parameter has crossed its alarm limit.

Scroll to compare monitoring approaches
SRU Parameter What Deviation Reveals Traditional DCS Monitoring iFactory AI Analytics
H2S:SO2 Tail Gas Ratio Stoichiometric balance of the Claus reaction — the single parameter that most directly determines sulfur recovery efficiency and stack emissions Alarm if ratio exceeds fixed limits (typically 1.8:1 to 2.2:1) — no compensation for analyzer lag, feed changes, or transient upsets Continuous ratio tracking with feed-forward compensation for acid gas composition changes and predictive air demand adjustment before ratio drifts
Converter Bed Temperature Differential Temperature rise across each catalytic bed indicates reaction rate and catalyst activity — declining differential means declining conversion Individual bed inlet and outlet temperature alarms — no calculation or trending of the differential that reveals catalyst degradation Real-time differential calculation with per-stage conversion efficiency trending and catalyst remaining life projection
Condenser Outlet vs Dew Point If condenser outlet temperature approaches sulfur dew point of the next stage, sulfur vapor carryover causes catalyst fouling Fixed high-temperature alarm on condenser outlet — dew point calculation not performed in DCS, so alarm does not account for gas composition Real-time sulfur dew point calculation based on actual gas composition with margin tracking to next-stage dew point
Thermal Furnace Temperature Profile Furnace temperature directly controls thermal stage conversion — declining temperature indicates air supply or burner problems Single-point temperature alarm at furnace outlet — no profile analysis or correlation with acid gas feed rate and composition Temperature profile trending correlated with feed rate, combustion air flow, and burner status — deviation detected relative to expected performance curve
Incinerator Temperature Margin Distance between actual incinerator temperature and 600C minimum — if margin disappears, H2S passes through to stack unburned Low-temperature alarm at 600C — no prediction of whether temperature is trending toward the limit under current operating conditions Rate-of-change monitoring with projection to minimum threshold — advance warning allows corrective action before margin reaches zero
See How iFactory Monitors Your SRU Performance in Real Time

iFactory connects to your existing DCS and historian to provide continuous AI-driven monitoring across the complete sulfur recovery process — from acid gas feed through stack emissions. No new instrumentation required. Deployed in five weeks with historian integration completed in under seven days.

SRU Compliance Readiness: What AI Covers That Manual Systems Miss

Environmental compliance for sulfur recovery units requires continuous demonstration that the unit is operating within its permitted emissions envelope. Manual monitoring systems create compliance gaps because they cannot provide the continuous, correlated, auditable record that regulators expect during an investigation or audit. The following checklist shows the difference between what AI-powered analytics covers continuously and what facilities relying on manual systems typically discover only after an event has occurred.

VERIFIED BY AI
Real-time H2S:SO2 ratio trending with feed-forward compensation for acid gas composition changes — ratio maintained within 5% of 2.0:1 target during normal operations and transient upsets
VERIFIED BY AI
Converter bed temperatures monitored against calculated sulfur dew point for each catalytic stage — alert generated before bed inlet temperature approaches condensation risk zone
VERIFIED BY AI
Tail gas analyzer readings cross-validated against process mass balance calculation — analyzer drift or malfunction detected within minutes rather than hours
VERIFIED BY AI
Incinerator temperature tracked with predictive margin to 600C minimum threshold — trend projection provides 30–60 minute advance warning of potential low-temperature condition
TYPICALLY MISSED
Gradual catalyst deactivation detected through per-stage conversion efficiency trending over weeks — manual reviews typically identify this only when outlet lab samples show declining recovery
TYPICALLY MISSED
Condenser fouling identified through slowly rising outlet temperature trend over multiple weeks — operators notice only when temperature exceeds the fixed DCS alarm setpoint
TYPICALLY MISSED
Correlation between amine unit upsets and downstream SRU performance degradation — facilities rarely connect liquid carryover events to subsequent catalyst fouling or efficiency loss
TYPICALLY MISSED
Cumulative sulfur loss quantified across all condenser drain points and compared to mass balance — discrepancies identify unmeasured sulfur losses that affect recovery calculations

Expert Perspective: Why Tail Gas Analyzer Reliability Is the Weakest Link in SRU Compliance

The fundamental problem with SRU compliance monitoring is that we have bet our entire permit compliance on a single tail gas analyzer that every SRU operator knows is unreliable. The analyzer measures H2S and SO2 in a hot, corrosive, sulfur-laden gas stream that fouls sample lines, poisons sensors, and drifts continuously. We calibrate it daily and it is still off by 10–20% within six hours of calibration. So we are controlling our air demand — the single most important variable for sulfur recovery — based on a measurement that we know is wrong. What iFactory does that changes this equation is cross-validate the analyzer reading against a mass balance calculation using flow meters and composition data that are far more reliable. When the analyzer says the ratio is 2.1:1 but the mass balance says it is actually 1.7:1, the system flags the discrepancy and operators know to trust the mass balance until the analyzer is recalibrated. That cross-validation capability alone probably prevents two to three exceedance events per year at our facility, because under the old system we would have been flying blind on ratio control for hours at a time without knowing it.
— SRU Process Engineer, Gulf Coast Refinery · 17 Years Sulfur Recovery Operations · Responsible for 200 LT/D Claus Unit with TGTU

Frequently Asked Questions

Q: How does iFactory monitor SRU performance without installing new field instruments?
iFactory connects to your existing DCS and historian infrastructure, ingesting the real-time process data that your SRU instruments already generate — temperatures, pressures, flow rates, and analyzer readings. The platform builds its analytics models using this existing data, applying multivariable correlations and mass balance calculations that extract far more information from your current instrumentation than DCS alarm systems can provide. No new field devices are required for deployment. Book a Demo to discuss your specific data infrastructure.
Q: What is the H2S:SO2 ratio and why is it considered the most critical SRU control parameter?
The H2S:SO2 ratio in the process gas leaving the final catalytic stage represents the stoichiometric balance of the Claus reaction (2H2S + SO2 = 3S + 2H2O). At exactly 2.0:1, the reaction proceeds to maximum theoretical conversion. When the ratio deviates from 2.0:1, one reactant is in excess and passes through unreacted, reducing overall sulfur recovery and increasing stack emissions. Because this ratio is controlled by adjusting combustion air flow to the thermal reactor — which has a 30–60 second response time — even brief analyzer errors or feed composition changes can cause significant ratio excursions that take minutes to correct.
Q: How does iFactory handle situations where the tail gas analyzer is unreliable or out of service?
iFactory maintains a parallel H2S:SO2 ratio calculation using mass balance principles — computing the expected ratio from acid gas flow rate, H2S concentration, combustion air flow rate, and measured conversion across each stage. When the tail gas analyzer reading diverges from the mass balance calculation by more than a configurable threshold, iFactory alerts operators that the analyzer may be drifting and recommends relying on the mass balance value for air demand control until the analyzer is validated or recalibrated. Contact our team to learn more about analyzer cross-validation.
Q: Can iFactory predict when SRU catalyst needs replacement before efficiency drops below permit requirements?
iFactory tracks per-stage conversion efficiency by calculating the actual H2S conversion across each catalytic bed using inlet and outlet composition data, bed temperature differentials, and pressure drop trends. As catalyst degrades, the conversion efficiency per stage declines gradually — typically over 18–36 months depending on operating conditions and upset history. iFactory projects this degradation trend forward to estimate when conversion will decline to the point where overall sulfur recovery falls below the permit-required level, giving turnaround planners 8–16 weeks of advance notice to schedule catalyst replacement during a planned window.
Q: How quickly can iFactory detect an SO2 exceedance risk after a process upset begins?
iFactory detects developing exceedance risk within seconds to minutes of a process deviation onset, depending on the type of upset. For air demand disturbances — the most common cause of ratio excursions — the system detects the ratio deviation within 1–2 scan cycles (typically 5–15 seconds) by comparing the measured ratio against the mass balance calculation. For slower-developing issues like catalyst degradation or condenser fouling, detection occurs within hours to days as the efficiency trend crosses statistical significance thresholds. In all cases, detection occurs well before the SO2 stack concentration reaches the permit limit, providing operators with sufficient time to take corrective action.
Sulfur Recovery Unit Analytics That Protects Your Environmental Compliance and Optimizes Efficiency

iFactory's AI-driven process analytics platform gives your SRU operations team continuous visibility into H2S:SO2 ratio control, catalyst health, condenser performance, tail gas treating efficiency, and incinerator conditions — detecting the deviations that lead to SO2 exceedances before they reach your stack.


Share This Story, Choose Your Platform!