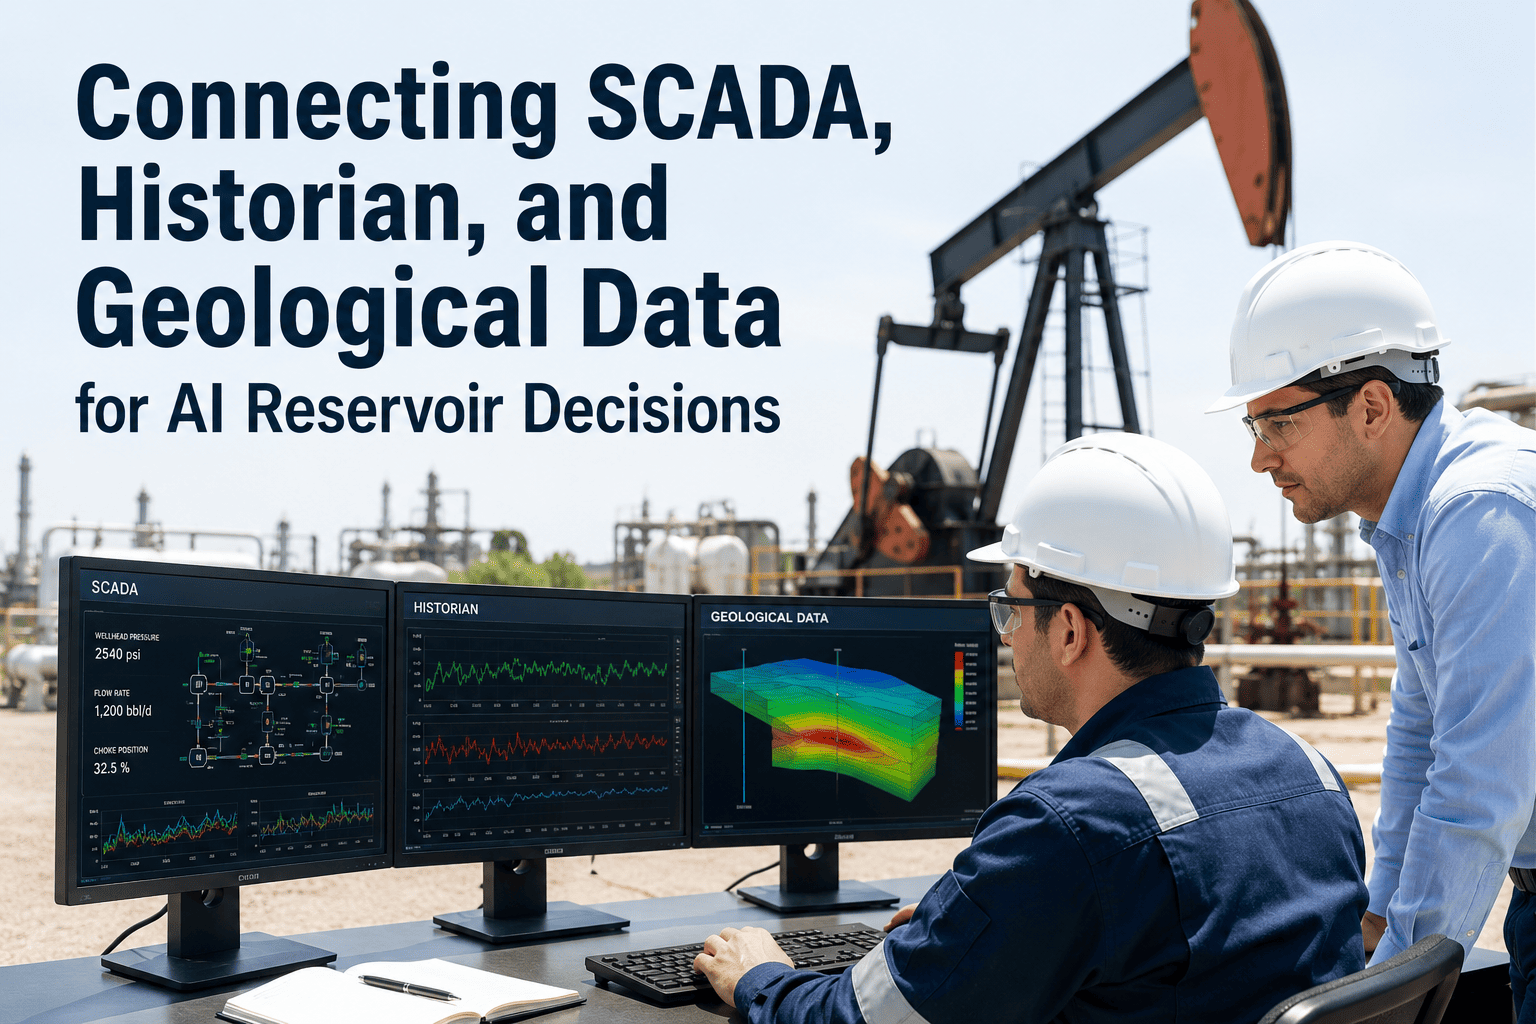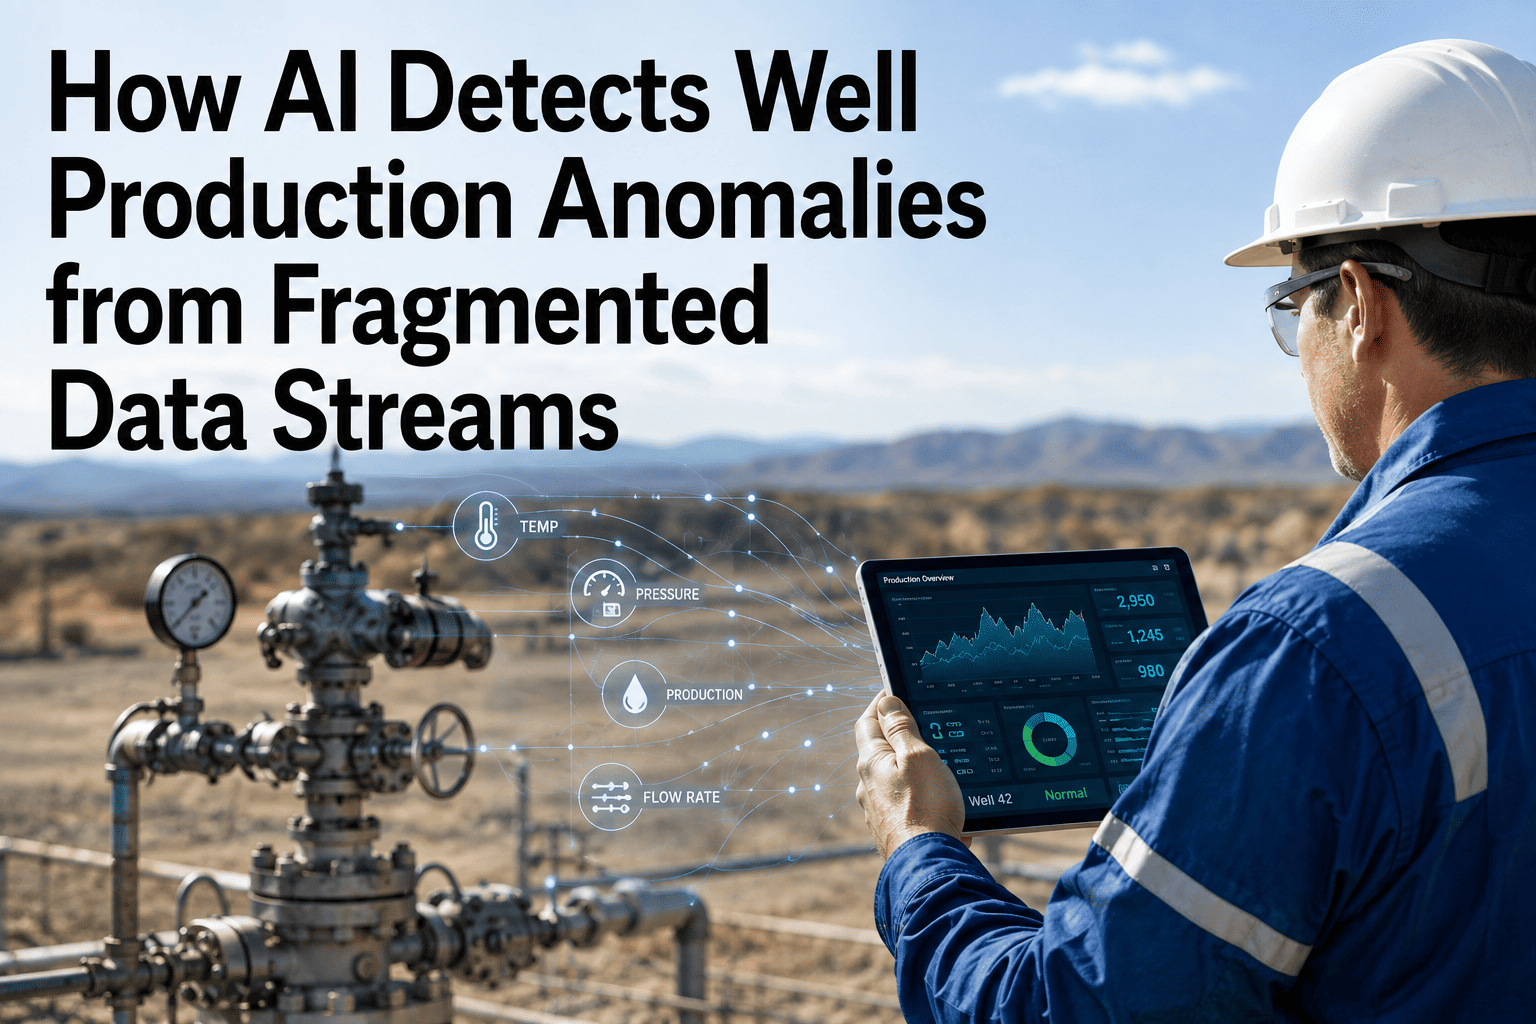
A well test result sits in a spreadsheet on a production engineer's laptop. SCADA pressure and flow readings stream into a historian that only the control room checks. Geological interpretation lives in Petrel on a subsurface workstation. Cost and allocation data sits in SAP, updated on its own schedule by a different team entirely. Four systems, four owners, and not one of them can see what the others know. When a well starts underperforming, the answer to why is usually scattered across all four places at once, and reservoir engineers spend hours reconstructing a picture that AI could assemble in seconds if the data were actually connected. Book a demo to see how a unified intelligence layer changes that.
Your Well and Reservoir Data Already Exists. It Just Can't Talk to Itself.
iFactory Well and Reservoir Intelligence connects SCADA, historian, geological modeling, and ERP systems into one AI-readable layer, so questions that used to take days to answer take minutes.
Four Systems, Four Truths, One Well
Every producing well generates data that gets captured correctly and then stranded permanently. The map below shows where a single well's information actually ends up, and why nobody downstream can see the full picture without manually stitching it together. None of these systems are badly designed on their own. Each one does exactly what it was built to do. The problem only appears when someone needs an answer that spans more than one of them, which in upstream operations is nearly every meaningful decision.
These four systems were never designed to talk to each other, and in most operations, they still don't. Standards like WITSML, PRODML, and RESQML exist precisely because the industry recognized this problem decades ago, yet most day-to-day workflows still route around the standard rather than through it, because implementing true integration has historically required a dedicated systems project rather than something that happens automatically in the background.
What Fragmented Data Actually Costs an Upstream Operator
Data silos are usually described as an IT inconvenience. In practice, they change decisions, and the cost shows up in production, capital allocation, and engineering hours long before anyone traces it back to a data problem. Because the cost is distributed across many small delays and reconstructions rather than one visible failure, it rarely gets budgeted for or prioritized the way a production-stopping equipment failure would, even though the cumulative impact over a year is often larger.
None of these four costs shows up as a single line item in a budget review, which is exactly why data fragmentation persists for years in operations that would never tolerate a comparable inefficiency in a more visible part of the business, such as drilling operations or well completions. The cost is real, it is simply distributed across many small, hard-to-trace delays rather than concentrated in one obvious place.
How AI Turns Four Disconnected Systems Into One Intelligence Layer
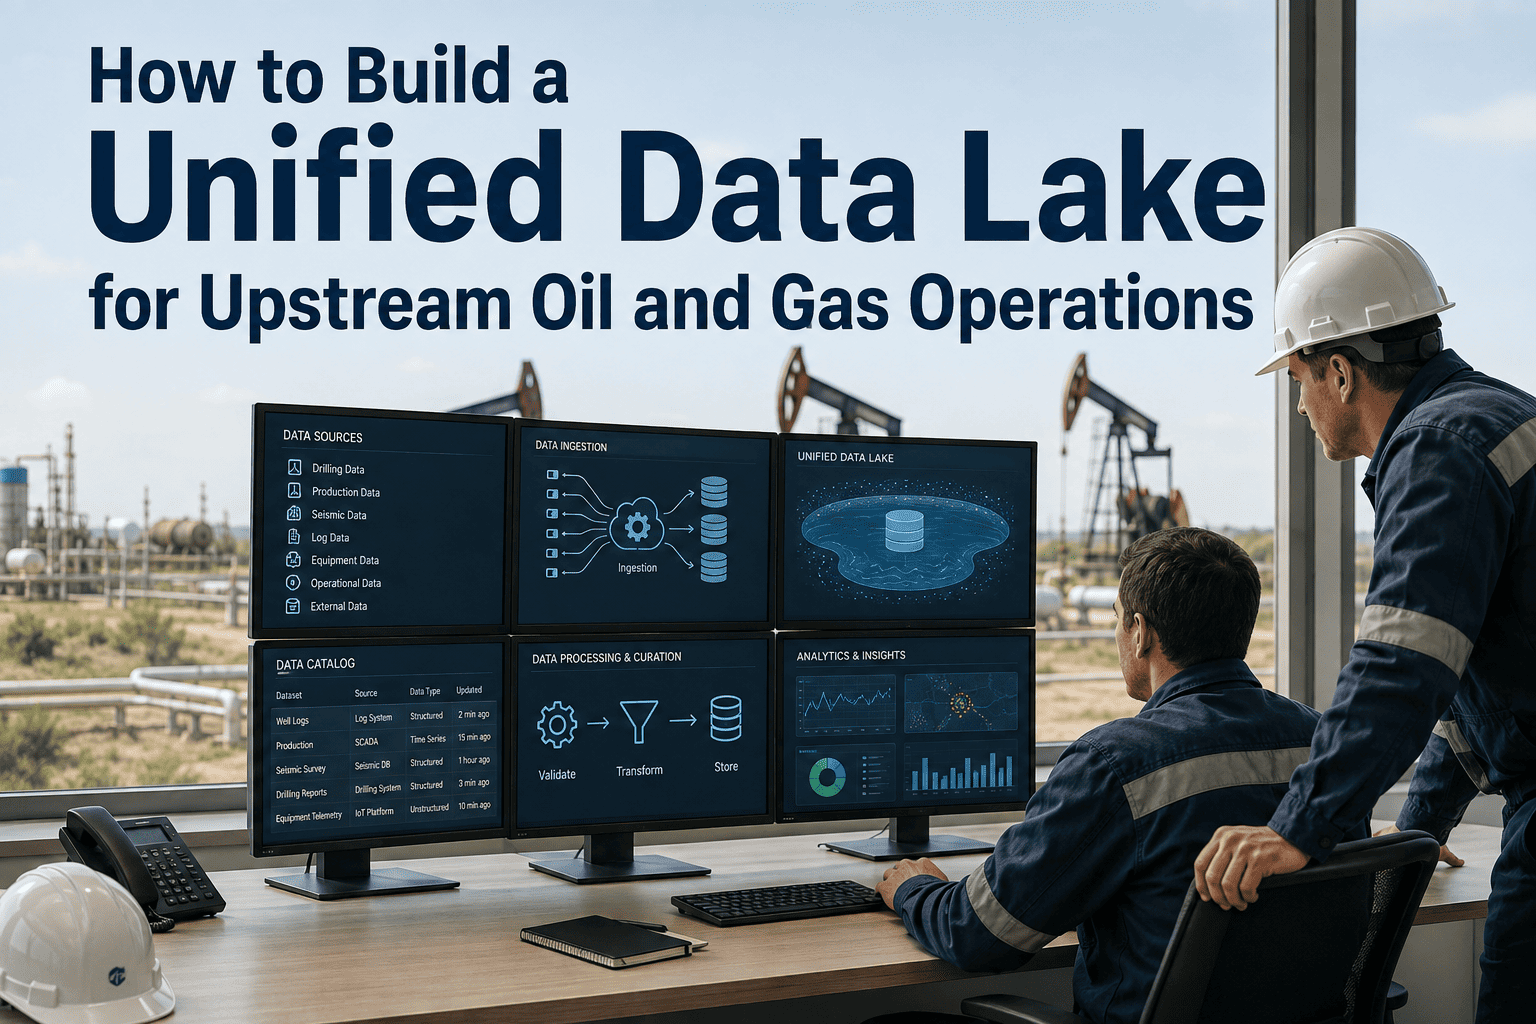
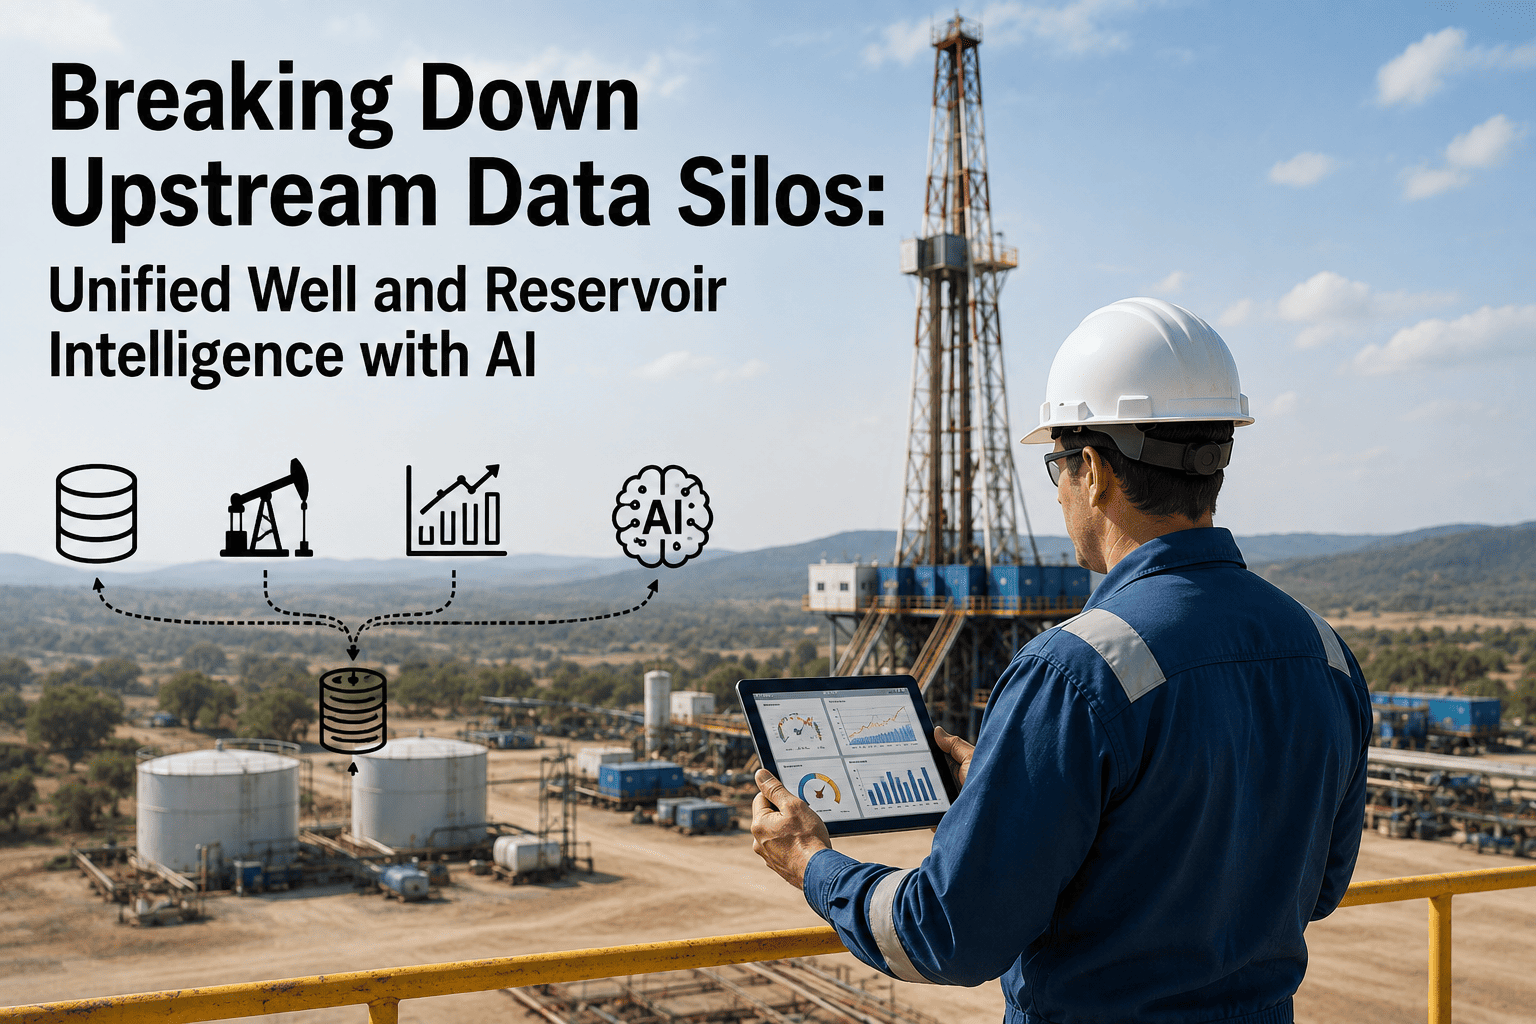
iFactory Well and Reservoir Intelligence does not require replacing SCADA, Petrel, or SAP. It sits above these systems, connecting to each one and reasoning across all of them together as a single dataset. The architecture below shows how four independent sources feed into one intelligence layer, and how that layer in turn produces the specific kinds of decision-ready outputs that engineering, geoscience, and finance teams each rely on.
Every data source keeps operating exactly as it does today. SCADA still streams to the historian, geologists still build models in Petrel, finance still runs SAP. The unified layer reads all of it continuously and gives every team a shared, current picture instead of four separate ones that go stale at different rates. This is a meaningful distinction from a data migration project, because migration asks every team to change how they work, while a unified intelligence layer asks nothing of the source systems at all and simply becomes a new, faster way to get an answer that spans more than one of them.
Answering One Question, Two Ways
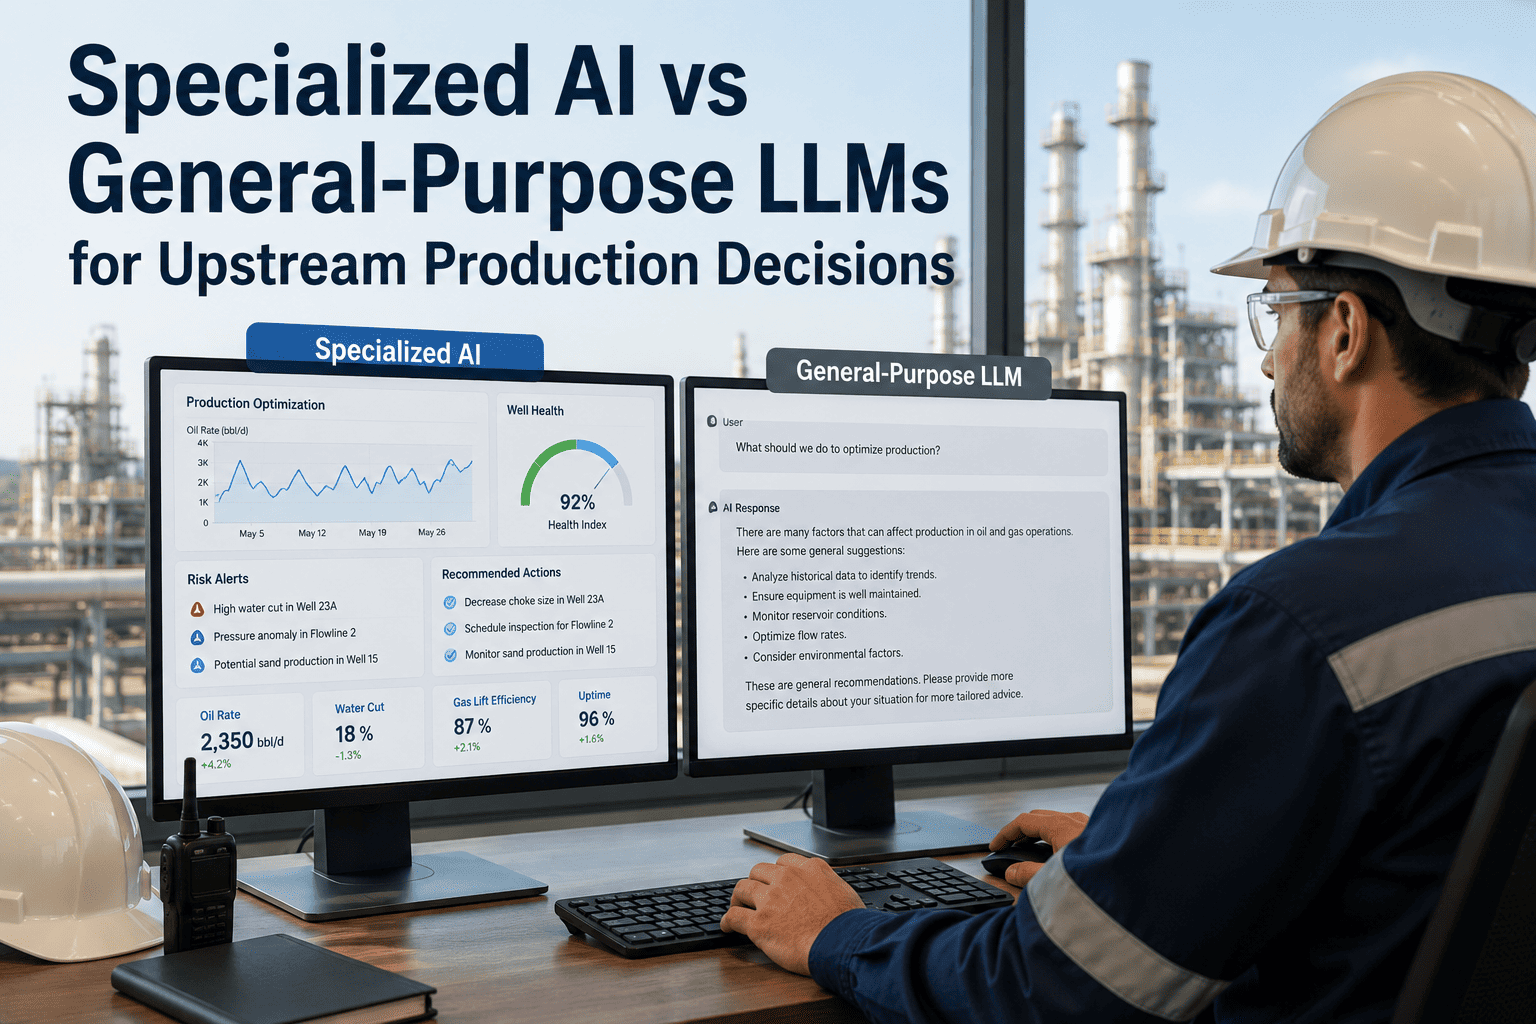
The clearest way to understand the value of unification is to walk through the same real question, answered first the fragmented way and then the unified way. This is not an exaggerated worst-case scenario, it reflects the actual sequence of steps a production engineer typically follows today when a well's output drops unexpectedly and the cause is not immediately obvious from a single dashboard.
Point Solutions vs a Unified Well and Reservoir Intelligence Layer
Many operators have tried to solve this with point integrations between two systems at a time. The table below shows why that approach falls short of true unification. A point integration between SCADA and a reporting dashboard, for example, solves a narrow visibility problem but does nothing for the reservoir engineer who also needs geological context, or the finance team who needs cost data layered on top of both.
| Evaluation Factor | Point-to-Point Integration | Unified Intelligence Layer |
|---|---|---|
| System Coverage | Connects two systems at a time, requiring a separate project for each new pairing | Connects SCADA, geological, production, and ERP systems as one continuous dataset |
| Maintenance Burden | Each point integration breaks independently when either connected system changes | Centralized connectors are maintained once and apply across every consuming workflow |
| Cross-Domain Reasoning | Data moves between two systems but is not analyzed together as one context | AI reasons across geological, operational, and financial context simultaneously |
| Time to Diagnostic Answer | Still requires manual synthesis across whichever systems were not directly connected | Delivers a ranked, evidence-backed answer directly from the unified layer |
| Scalability Across Fields | Each new field or acquired asset requires its own integration effort | New assets onboard into the same unified schema without rebuilding pipelines |
| Institutional Memory | Analysis and reasoning remain in individual spreadsheets and inboxes | Historical diagnostics and reasoning are captured and queryable going forward |
The gap between these two approaches widens as an operator's asset portfolio grows. A single field with a handful of wells might manage with point integrations and a lot of manual effort. An operator running dozens of fields, each with its own historian, its own reservoir models, and its own local data conventions, hits a ceiling with point integrations fairly quickly, because every new asset multiplies the number of individual connections required rather than simply extending an existing unified schema.
Stop Reconstructing the Same Picture From Scratch Every Time
See how iFactory connects your SCADA, Petrel, well test, and ERP data into one intelligence layer your teams can actually query.
Three Questions Unified Data Answers That Fragmented Data Cannot
These are not hypothetical use cases. They are the kinds of questions reservoir and production engineers ask constantly, and the difference in how quickly and completely they can be answered depends entirely on whether the underlying data is connected. Each of the three scenarios below draws on more than one of the four data systems described earlier, which is precisely why they are so difficult to answer well under a fragmented setup and so fast to answer once those systems are unified.
How the Unified Layer Gets Built Without Disrupting Operations
Unifying upstream data is not a rip-and-replace project. It is layered on top of the systems your teams already trust and already know how to use. That distinction matters more in upstream operations than almost any other industry context, because reservoir engineers and geoscientists have deep, often years-long familiarity with tools like Petrel, and any solution that asks them to abandon that familiarity faces resistance that has nothing to do with the technology's actual value.
Because the unified layer is additive rather than a replacement, teams typically continue using their existing tools for the deep, specialized work each system was built for, such as detailed geological modeling in Petrel or transaction-level cost tracking in SAP, while turning to the unified layer specifically for the cross-domain questions those individual tools were never designed to answer alone.
Frequently Asked Questions
Does unifying our data mean replacing SCADA, Petrel, or our ERP system?
No, and this is the most common misconception about data unification projects. iFactory Well and Reservoir Intelligence is designed to sit above your existing systems, not replace them. SCADA continues streaming to your historian exactly as it does today, geoscientists continue working in Petrel, and finance continues running SAP without any change to their daily workflow. The unified layer connects to each system through purpose-built connectors, reads the data continuously, and reasons across all of it together, so the value comes from connection rather than from migration or replacement. Book a demo to see how the connectors work with your specific systems.
How long does it take to see value after connecting our data sources?
Most operators see meaningful diagnostic value within the first four to six weeks, once the initial connectors are deployed and the model has been calibrated against field-specific well behavior. Early value typically shows up on well diagnostics, since that is where the four-system reconstruction problem is most painful and most visible day to day. Reservoir-level insight and cost-aware prioritization tend to mature over a longer window as the model accumulates validated outcomes across more wells and more decision cycles, but the core time savings on diagnostic work are usually apparent almost immediately after go-live.
What happens to well test data that still lives in individual engineers' spreadsheets?
Spreadsheet-based well test data is one of the most common sources connected during onboarding, and it does not require engineers to change how they capture data during the test itself. Structured templates and lightweight connectors bring that data into the unified schema on the same cadence it is already being recorded, converting what used to be a personal file into a shared, structured, and queryable record. This also solves the institutional knowledge problem directly, since well history and test results remain accessible and searchable even after the engineer who recorded them moves to a different role or leaves the organization. Contact support to discuss your current well test data format.
Can the AI layer actually understand geological context, or only operational data like SCADA tags?
The unified layer is built specifically to reason across both operational and geological context together, which is what differentiates it from tools that only analyze time-series SCADA data. Reservoir model outputs, formation characteristics, and known geological factors from platforms such as Petrel are ingested as structured context alongside real-time operational tags, so a diagnostic answer about a production drop can reference both an operational signal, such as an unusual pressure trend, and a geological factor, such as a known compartmentalization risk in that part of the reservoir, in the same response, without requiring the engineer to manually cross-check both sources themselves.
How does connecting ERP cost data change well prioritization decisions?
Without ERP cost data connected, well prioritization decisions are usually made on technical merit alone, since production and reservoir data show potential but not the real allocated cost of pursuing it. Once ERP data is part of the unified layer, prioritization recommendations can weigh technical upside against actual cost context, including recent workover spend, allocated overhead, and procurement lead times for required equipment, giving engineering and finance teams a shared basis for ranking opportunities instead of negotiating between two separate views of the same well. Book a demo to see cost-aware prioritization on your own asset data.
Every Answer You Need Is Already in Your Systems. It's Just Not Connected Yet.
iFactory Well and Reservoir Intelligence brings SCADA, geological, production, and ERP data together so your teams stop reconstructing answers and start acting on them.