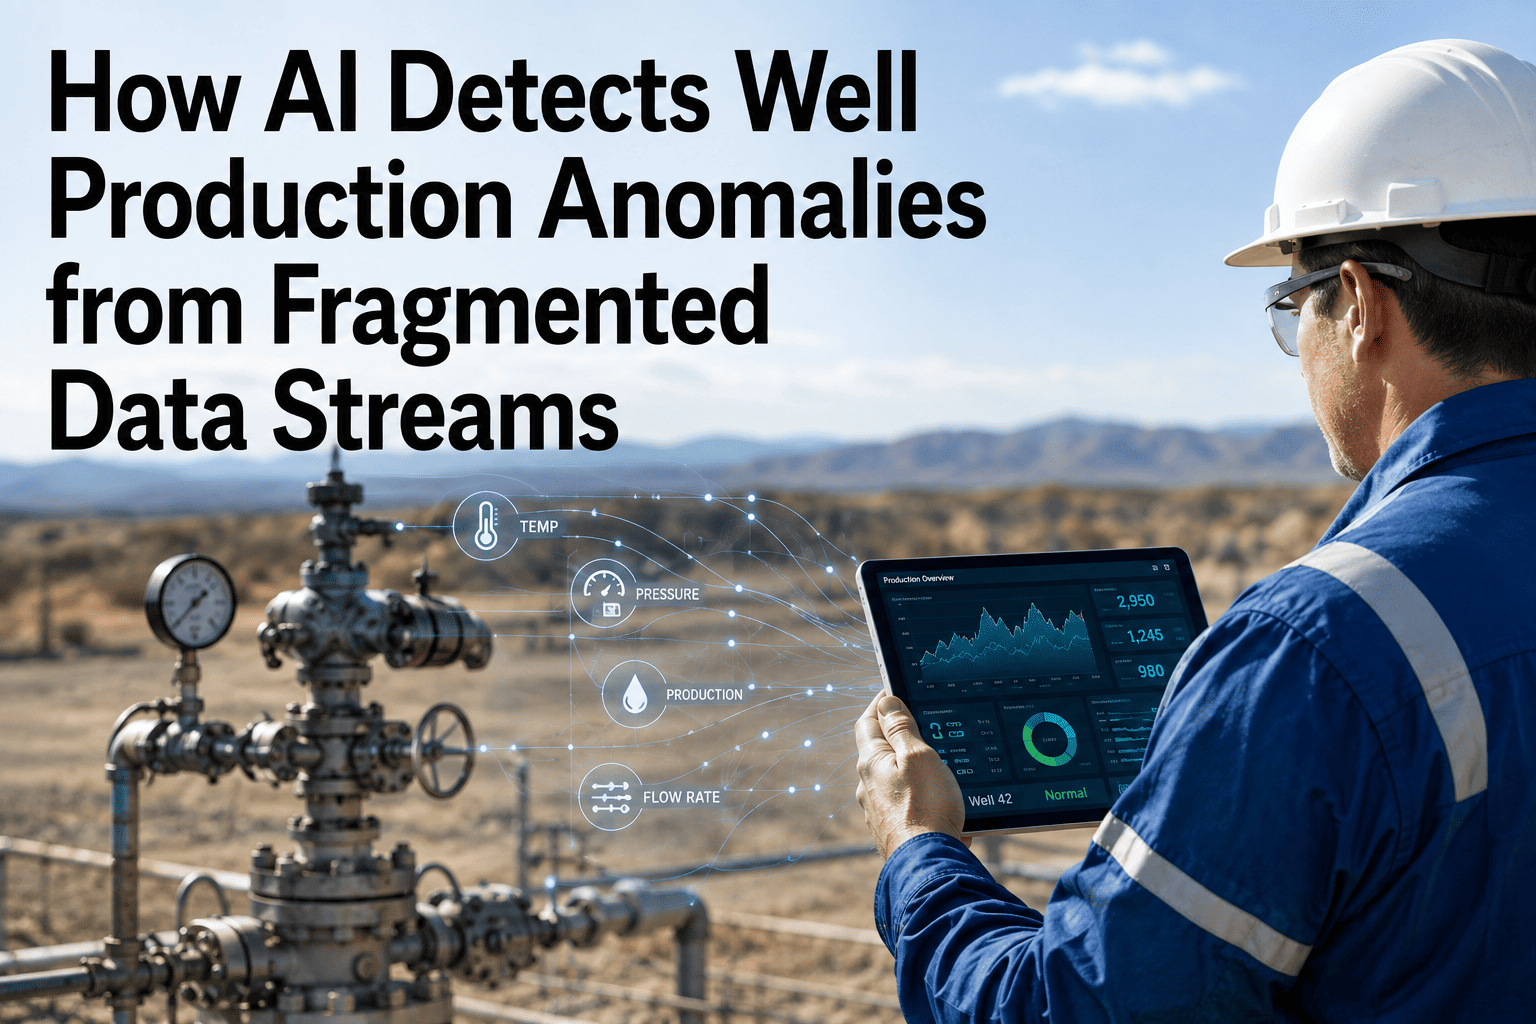
How AI Detects Well Production Anomalies from Fragmented Data Streams
By Johnson on August 7, 2026
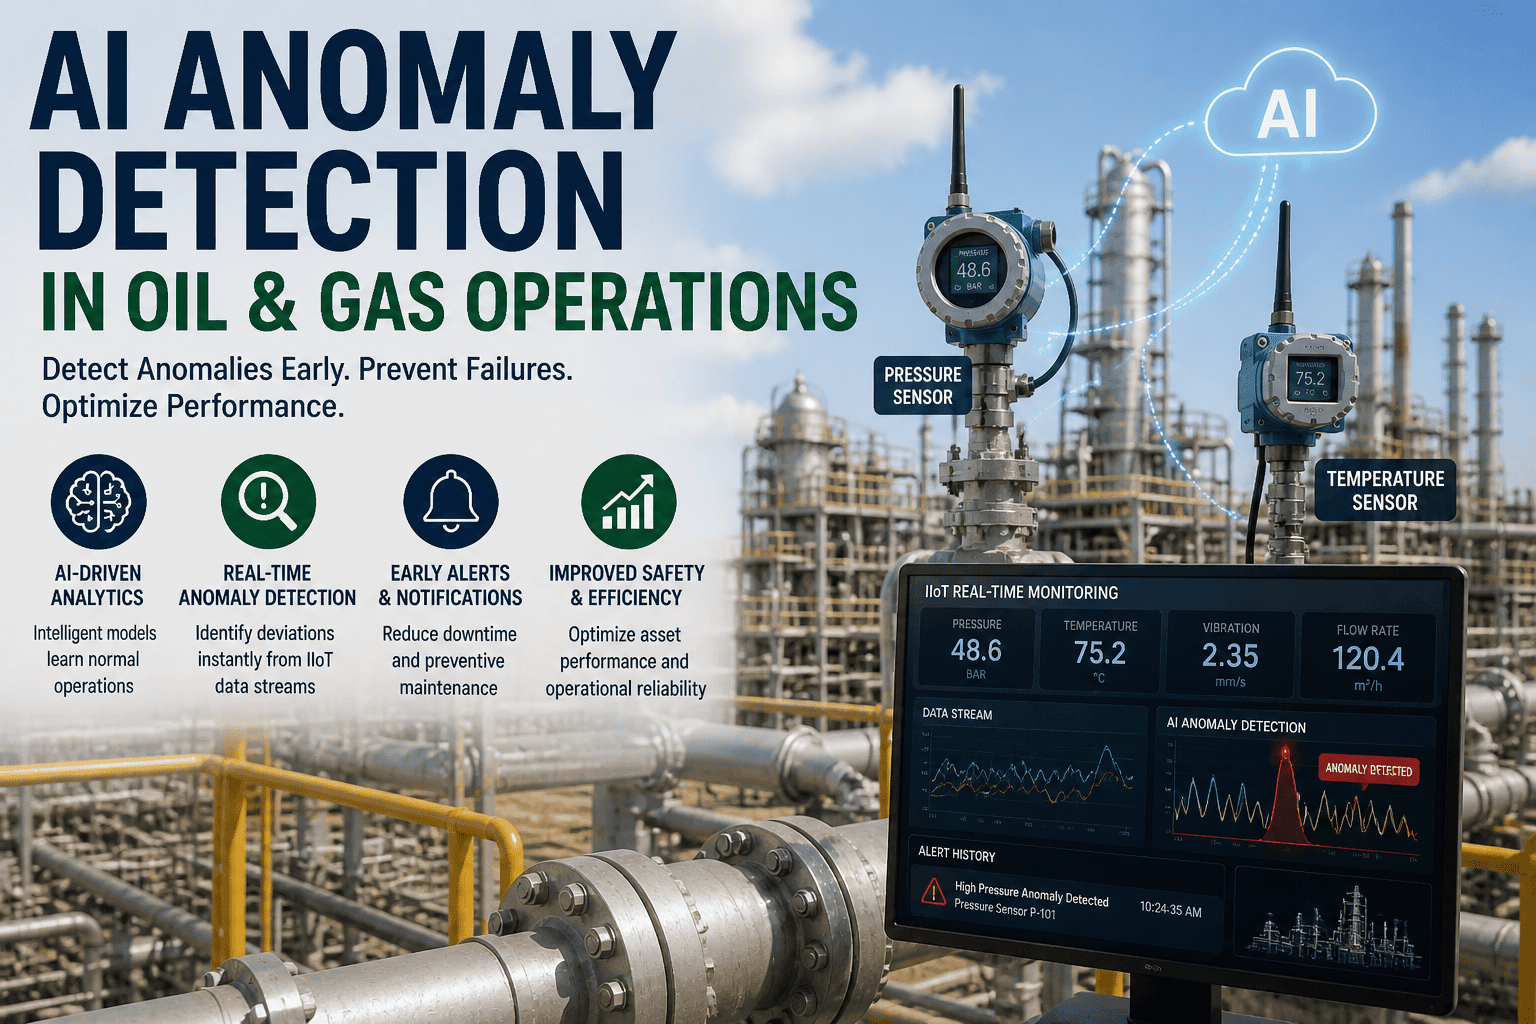
A well starting to load up with liquids, a gas lift valve beginning to fail, and a pump heading toward a mechanical failure all leave early signatures — but almost never in a single data stream a production engineer happens to be watching at the right moment. Pressure data lives in the SCADA historian, flow data lives in a separate measurement system, temperature and chemical injection data often sit in yet another vendor's software, and by the time any one of those systems throws an alarm on its own threshold, the anomaly has usually been building for hours or days. See how iFactory correlates pressure, flow, temperature, and chemical data across systems to catch anomalies single-source monitoring misses before they become a deferred-production event.
Upstream Intelligence · Anomaly Detection
The Anomaly Was Visible Days Ago — Just Not in Any One System
AI that correlates pressure, flow, temperature, and chemical injection data across fragmented monitoring systems to catch well production anomalies that single-source alarms consistently miss.
Why Fragmented Data Hides Anomalies That Are Individually Obvious
No single data stream on a producing well is actually mysterious in isolation — a slow casing pressure rise, a gradually declining flow rate, a temperature drift, and a rising chemical injection demand are all things an experienced engineer would recognize instantly if shown side by side. The problem is that they are almost never shown side by side. Pressure and flow data typically live in the field SCADA historian. Chemical injection skid data often lives in a separate vendor platform tied to the injection pump manufacturer. Downhole or wellhead temperature may come from yet another gauge system entirely. Each system generates its own alarms against its own fixed thresholds, and each threshold is calibrated to catch large, sudden deviations — not the slow, cross-system drift that actually characterizes most developing anomalies.
Pressure Data
Casing and tubing pressure trends live in SCADA, alarmed against fixed high/low limits that a slow multi-day drift rarely trips before the underlying condition has already progressed.
Flow Data
Liquid and gas rate measurement often sits in a separate metering or allocation system, reviewed on a daily or shift basis rather than continuously correlated against pressure behavior.
Temperature Data
Wellhead or downhole temperature gauges frequently report into their own dashboard, rarely cross-referenced against flow or pressure trends unless an engineer manually pulls both up together.
Chemical Injection Data
Injection pump rate and tank level data usually live in the chemical vendor's own monitoring platform, disconnected from the production data it is meant to be protecting.
How Correlation Works
Four Streams In, One Correlated Anomaly Signal Out
Detection Timing
Single-Source Alarms vs. Correlated Detection
The real cost of fragmentation is not that anomalies go undetected entirely — most eventually trigger some alarm somewhere. The cost is timing, and timing is what determines whether an anomaly is caught as a minor adjustment or discovered as a production-impacting event.
Day 1
Slow pressure drift begins — invisible against fixed SCADA alarm thresholds, no flow impact yet.
Day 2–3
Correlated system flags a cross-stream pattern shift; single-source monitoring still shows nothing alarm-worthy.
Day 3–4
Correlated detection window — engineer can intervene before flow rate is measurably affected.
Day 6–8
Flow rate finally declines enough to trip a single-source threshold alarm on its own.
Day 8+
Single-source detection point — production already deferred for several days before the issue is caught.
Catch It in the Correlation Window
Stop Waiting for a Single System to Cross Its Own Alarm Threshold
iFactory correlates pressure, flow, temperature, and chemical injection data across every system feeding a well, surfacing anomalies days before a single-source alarm would.
Six Anomaly Types That Only Show Up in Cross-Stream Correlation
Anomaly Type
Streams Involved
Single-Source Detection Lag
Liquid Loading Onset
Pressure + flow
3–6 days
Gas Lift Valve Failure
Injection pressure + flow
2–5 days
Scale Buildup in Tubing
Pressure + chemical injection
1–3 weeks
Pump Mechanical Degradation
Temperature + flow + pressure
4–10 days
Chemical Under-Dosing
Injection rate + pressure trend
1–2 weeks
Downhole Leak Development
Pressure + temperature + flow
3–7 days
What Changes
What Correlated Detection Changes in Daily Operations
01
Fewer Reactive Interventions
Engineers intervene while an anomaly is still an early trend rather than after it has already cost measurable production, reducing the frequency of emergency workover calls.
02
Ranked, Not Just Flagged, Anomalies
Correlated signals are ranked by confidence and production impact, so engineers spend review time on the anomalies most likely to matter rather than chasing every minor deviation.
03
Reduced Alarm Fatigue
A single correlated alert replaces a scattered set of low-confidence, single-source alarms across separate systems, reducing the noise engineers have to filter through each shift.
04
A Documented Anomaly History
Every correlated event is logged with the contributing data streams, building a reference history that makes root-cause investigation faster the next time a similar pattern appears.
Building the Correlation Layer
What It Actually Takes to Connect These Systems
The integration challenge is rarely a lack of data — most wells already generate pressure, flow, temperature, and chemical injection data somewhere. The challenge is that each system exports data in its own format, on its own polling interval, often through its own vendor-specific historian, none of which was designed with the expectation that another system would need to read it in near real time. Building a working correlation layer means normalizing timestamps across systems polling at different intervals, reconciling unit and tag naming conventions that differ between SCADA platforms and chemical vendor dashboards, and handling the inevitable gaps when one system goes offline for maintenance while the others keep reporting.
None of this requires replacing the underlying systems. It requires a layer purpose-built to read from each one on its own terms, translate the outputs into a common timeline, and apply correlation logic across that unified view — which is a materially different engineering problem than building any single system's own alarm logic, and one that most individual SCADA or chemical injection platforms were never scoped to solve on their own.
Common Questions
Frequently Asked Questions
Do all four data streams need to come from the same vendor system to be correlated?
No — correlation is specifically designed to work across systems from different vendors, since that is the reality on almost every producing well. Pressure data from a SCADA historian, chemical injection data from a skid manufacturer's platform, and flow data from a separate metering system can all be pulled into a shared correlation model without requiring any of the underlying systems to be replaced or standardized first. Talk to support about what your current systems already provide.
How much historical data is needed before correlated anomaly detection becomes reliable?
Most wells generate a usable baseline within a few weeks of continuous multi-stream data, though the model becomes more precise as it accumulates a full seasonal cycle of normal operating variation. Wells with an existing SCADA history can often be onboarded faster since past data can establish the baseline retroactively rather than waiting entirely on new data collection.
Does correlated detection replace the individual system alarms already in place?
No — existing SCADA, metering, and chemical skid alarms continue operating exactly as configured. Correlated detection adds a layer above those individual alarms, catching the slower, cross-system patterns that fall below any single system's own threshold, so the two approaches work together rather than one replacing the other.
What happens when a correlated anomaly signal turns out to be a false positive?
Every flagged event includes the specific data streams and pattern that triggered it, so engineers can quickly confirm or dismiss the signal and that outcome feeds back into refining the model's confidence thresholds for that well going forward, reducing the false-positive rate over time rather than repeating the same misclassification indefinitely.
Can this scale across a large multi-well field without overwhelming the production team with alerts?
Yes — correlated anomalies are ranked by confidence and estimated production impact so the team's attention goes to the handful of signals most likely to matter each day rather than a flat list of every deviation across the field. Book a demo to see how ranking scales across a full field deployment.
The Signal Was Already There
Correlate Your Production Data Before the Next Anomaly Costs Barrels
iFactory pulls pressure, flow, temperature, and chemical injection data together into one correlated view, catching anomalies days before they would trip a single system's own alarm.