Energy costs in oil and gas operations have never been more visible — or more controllable. Compression stations, pump systems, gas separators, and upstream processing equipment collectively consume millions of kilowatt-hours every month, yet most facilities still track this consumption through manual logs and end-of-month utility bills. That reactive model leaves real money on the table. iFactory Energy Monitoring changes that equation by applying AI-driven, real-time analytics to every electrical load across your facility — typically reducing oil and gas utility costs by 20–30% within the first year of deployment. Trusted by 500+ industrial facilities globally, iFactory delivers the predictive intelligence that operations managers, reliability engineers, and sustainability leads need to make confident, data-backed decisions every shift. Book a Demo to see how quickly your facility can start capturing these savings.
iFactory Energy Monitoring for Oil & Gas: Real-Time Intelligence That Pays for Itself
A technical guide to deploying AI-powered energy monitoring across upstream, midstream, and downstream oil & gas assets — cutting utility waste, enabling predictive maintenance, and meeting ISO 50001 and ESG compliance demands.
Stop Overpaying for Energy You Cannot See
iFactory connects to your existing PLCs, SCADA systems, and IoT sensors in weeks — no infrastructure overhaul required. Start your energy intelligence journey today.
Why Oil & Gas Facilities Bleed Energy Costs Without Real-Time Monitoring
Upstream compressors, injection pumps, HVAC systems for offshore platforms, and flare gas recovery units each carry distinct consumption signatures. When monitored only through monthly billing data or manual rounds, energy anomalies — a pump cavitating at 40% above its efficiency baseline, a heat exchanger fouling over six weeks — remain invisible until they become expensive failures or compliance violations. The gap between what oil & gas facilities pay and what they should pay is consistently large, and the primary driver is the absence of asset-level, continuous monitoring. iFactory closes that gap with machine learning models trained on your specific equipment behavior — not generic industry benchmarks. You can Book a Demo to see how this baseline modeling works on your asset classes.
Compressor Energy Drift
Reciprocating and centrifugal compressors degrade gradually. iFactory's ML fingerprinting detects a 3–5% efficiency drift weeks before it compounds into a significant power draw increase or mechanical failure event.
Pump System Over-Consumption
Injection and transfer pumps running against excess back-pressure consume 20–35% more energy than required. Continuous flow and current analytics identify throttling waste automatically and recommend corrective action.
Demand Charge Spikes
Uncoordinated equipment startups on offshore platforms and refineries create peak demand surges that drive disproportionate utility charges. iFactory's demand forecasting engine enables load-sequencing to shave peaks and cut demand charges by up to $420K annually.
HVAC & Utility System Idle Waste
Control rooms, wellhead shelters, and processing buildings run HVAC at full load regardless of occupancy or ambient conditions. iFactory identifies safe setback windows that cut HVAC energy 15–25% without impacting personnel comfort or equipment cooling specs.
Flare & Vent Gas Recovery Losses
Incomplete gas recovery creates both an energy loss and a direct regulatory liability. iFactory tracks recovery system efficiency in real time, alerting operators when recovery rates fall below target thresholds before a reportable event occurs.
Aging Asset Blind Spots
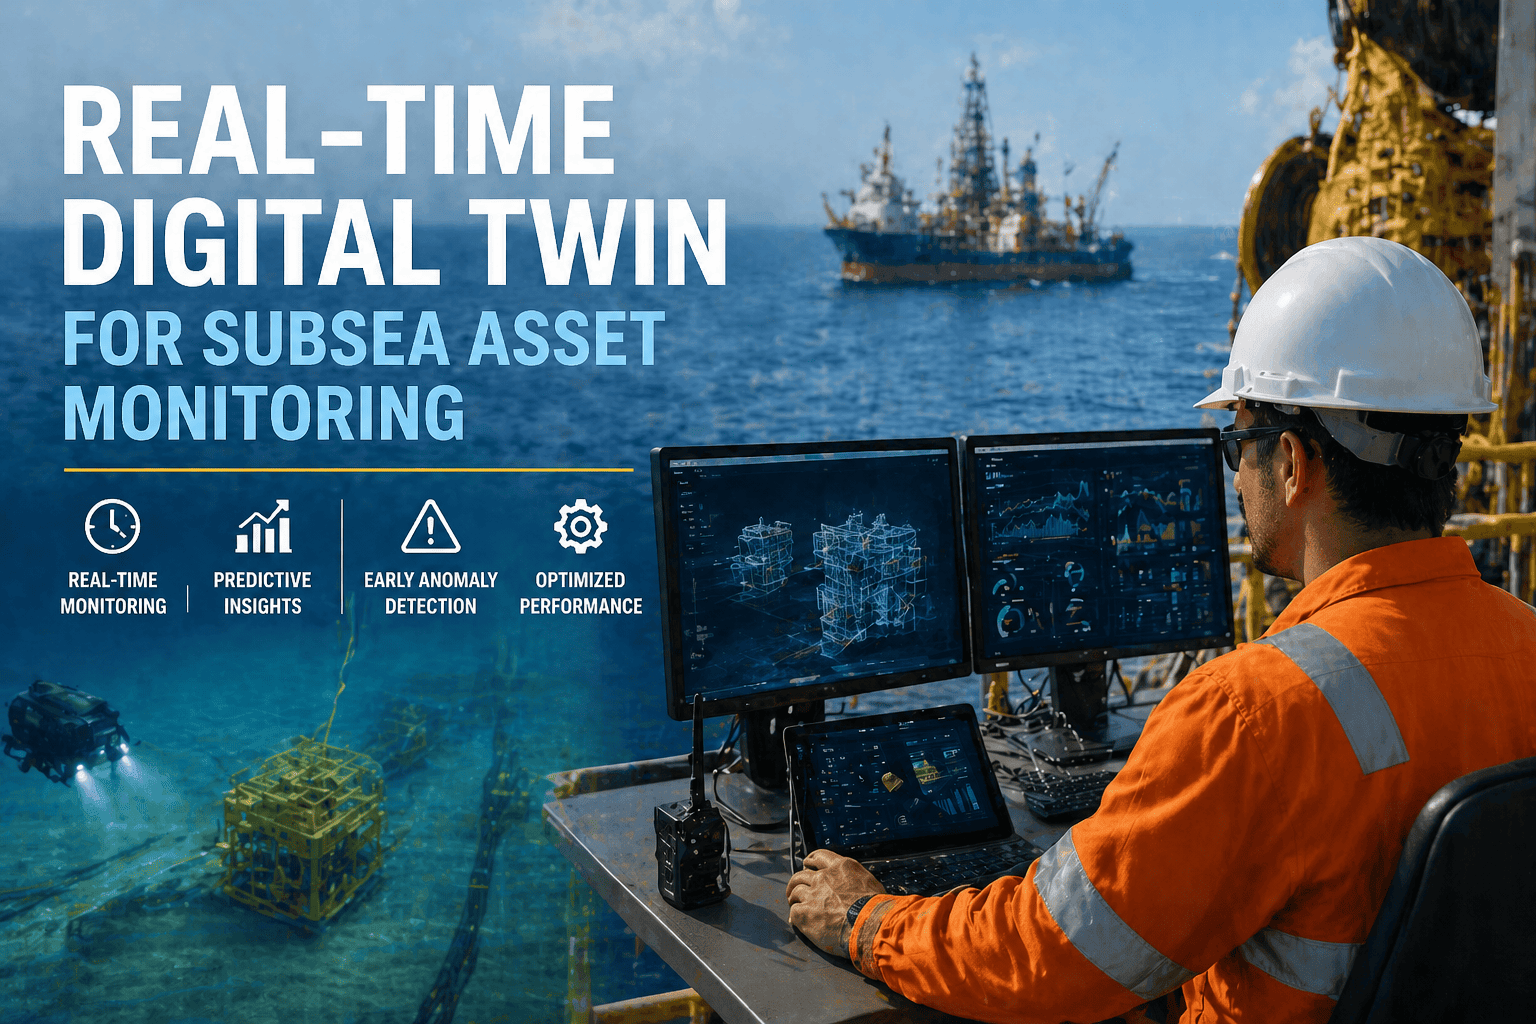
Assets operating beyond their design life carry hidden inefficiencies. iFactory's digital twin models compare real-time performance against original equipment specifications, exposing where refurbishment or replacement has the fastest energy ROI.
iFactory AI vs. Traditional Energy Management: Key Benchmarks
Moving from manual and threshold-based monitoring to AI-driven condition intelligence produces measurable improvements across the metrics that matter most in oil & gas operations.
| KPI | Traditional Approach | iFactory AI | Improvement |
|---|---|---|---|
| Energy Cost per BOE | $4.80–$6.20 | $3.10–$4.20 | ~30% reduction |
| Anomaly Detection Accuracy | ~42% (manual rounds) | 91–96% (ML model) | 2× improvement |
| Unplanned Downtime (hrs/mo) | 120–160 hrs | 20–30 hrs | 82% reduction |
| ISO 50001 Audit Prep Time | 4–6 weeks | Automated, real-time | Near-zero manual effort |
| Scope 1 & 2 Carbon Reporting | Manual, quarterly | Automated, continuous | Always audit-ready |
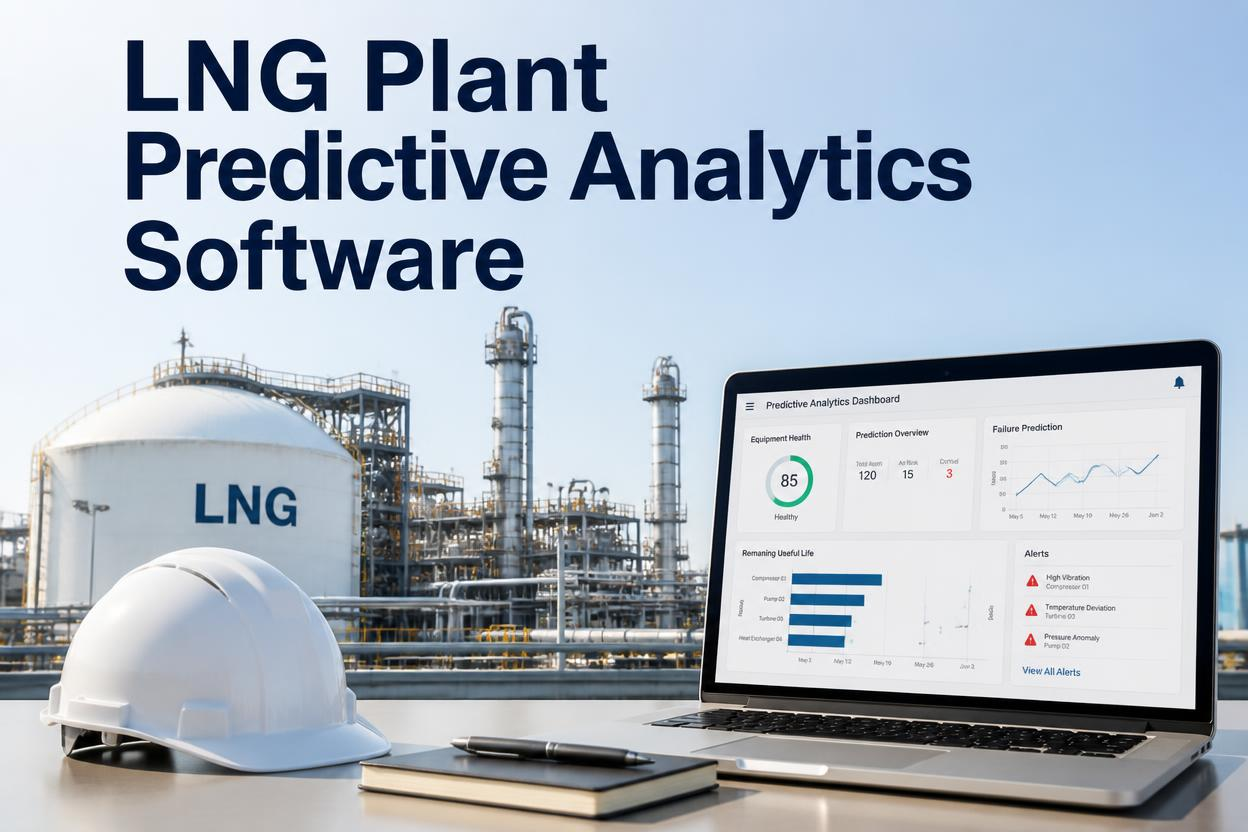
iFactory Energy Monitoring: Four Intelligence Layers for Oil & Gas
iFactory does not simply aggregate meter data. Its architecture applies four distinct intelligence layers, each building on the previous, to move from raw consumption data to autonomous optimization recommendations. Oil & gas operators who Book a Demo typically see predictive alerts firing within the first 30 days of baseline learning.
IoT Data Ingestion & Asset Fingerprinting
iFactory's IoT gateways connect to existing PLCs, SCADA systems, smart meters, and Modbus/OPC-UA data streams — no rip-and-replace required. Within the first two to four weeks, the ML engine establishes a unique energy fingerprint for every monitored asset: compressors, pumps, separators, generators, and HVAC systems alike.
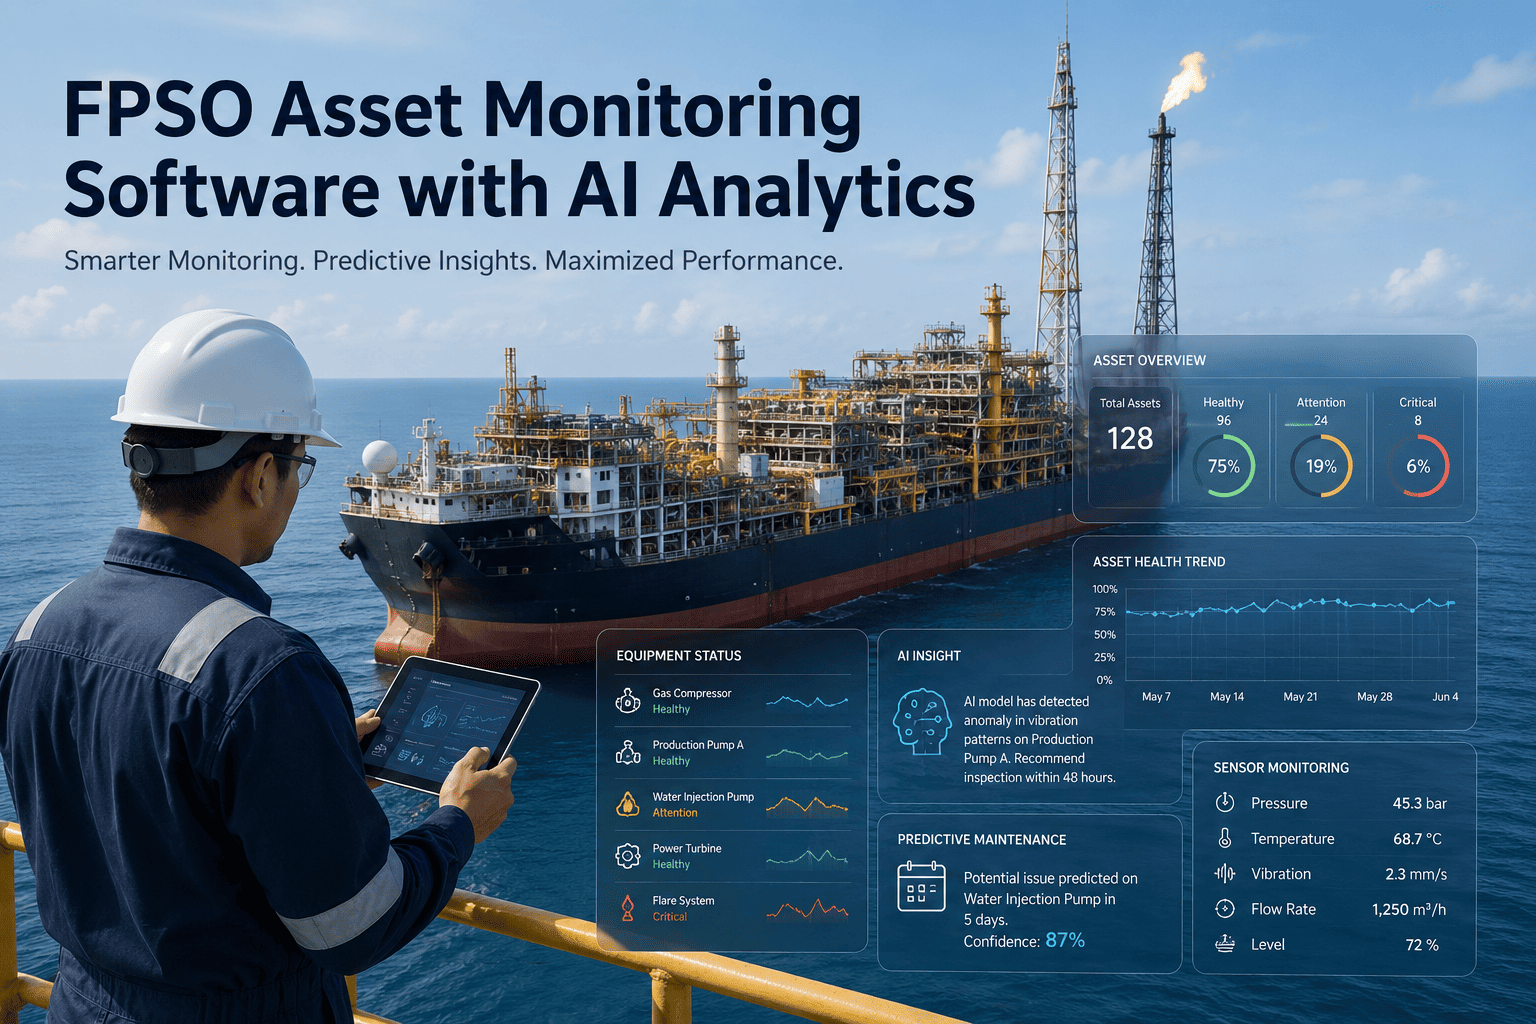
Anomaly Detection & Predictive Alerts
The ML model continuously compares live consumption against the established fingerprint. When a compressor begins drawing 5% more current at the same operating load — a classic early indicator of bearing wear or fouling — iFactory generates a prioritized work order alert before efficiency loss compounds into a failure event.
Demand Forecasting & Peak Shaving
iFactory's demand engine analyzes historical consumption patterns, production schedules, and weather data to forecast 15-minute interval demand curves. Automated load-sequencing recommendations prevent coincident peak demand events, directly reducing the demand charge component of utility bills — often the single largest controllable cost line.
Digital Twin & Compliance Automation
The iFactory Digital Twin layer mirrors real-time asset performance against original OEM specifications and energy efficiency targets. Scope 1 and Scope 2 carbon calculations are automated continuously, generating audit-ready records for ISO 50001, GHG Protocol, CDP reporting, and EU CBAM documentation — without manual aggregation.
Regulatory & ESG Compliance Coverage
Oil & gas operators face a growing grid of energy and emissions reporting obligations. iFactory automates the data collection, calculation, and documentation required for each.
| Standard / Framework | Requirement | iFactory Capability |
|---|---|---|
| ISO 50001 | Specific Energy Consumption (kWh/unit) | Real-time per-asset SEC tracking with automated EnPI dashboards and audit trail generation. |
| GHG Protocol / CDP | Scope 1 & 2 Emissions Inventory | Automated Scope 1 and 2 calculations from live meter data, with continuous carbon intensity trending. |
| EU CBAM | Verified Embedded Emissions per Batch | Immutable energy and emissions records linked to production batch IDs, export-ready for CBAM declarations. |
| OSHA / API RP 75 | Equipment Safety & Hazard Prevention | Predictive anomaly alerts on safety-critical equipment reduce risk of energy-related failure events and near-miss incidents. |
| ESG Reporting | Energy Intensity & Reduction Targets | Continuous tracking of energy intensity KPIs versus SBTi and internal decarbonization targets with board-ready dashboards. |
From Sensor to Savings: iFactory's 5-Week Deployment Program
iFactory follows a structured, five-week deployment program with defined deliverables at each stage. There are no open-ended implementations and no operational disruptions. Oil & gas sites completing the program report an average of $178,000 in avoided costs in the first three weeks alone.
Gateway Installation & Integration
iFactory IoT gateways are connected to existing PLCs, SCADA systems, and smart meters. No operational shutdown is required. Integration covers all priority assets — compressors, pumps, generators, separators, and HVAC systems.
AI Baseline Learning & Fingerprinting
ML models begin establishing asset-level energy fingerprints. Initial anomaly detection models are validated against known equipment states. First deviation alerts are generated and reviewed with your operations team.
Predictive Interventions Begin
First actionable predictive maintenance work orders are generated from energy anomaly data. Demand forecasting models activate. ROI evidence — measured in avoided energy waste and deferred maintenance — begins accumulating here.
Full Analytics & Compliance Dashboard Live
Complete energy intelligence platform is operational — including digital twin, ISO 50001 EnPI dashboards, Scope 1 and 2 carbon tracking, and executive-level reporting. Your team is fully trained and autonomous on the platform.
"iFactory's AI cut our electricity bill by 32% in year one. The anomaly detection caught a failing compressor that would have cost $180,000 in unplanned downtime — and we had no idea it was degrading. The sustainability dashboard made our ISO 50001 certification process three months faster than expected, and our carbon intensity dropped 28% year-over-year. For any oil and gas facility serious about energy cost control and ESG compliance, this platform is the right investment."
The 30% Energy Cost Reduction Is Achievable — With the Right Intelligence Layer
Oil and gas utility costs are not fixed. They are the product of thousands of daily equipment decisions — most of which are currently made without real-time energy data. iFactory Energy Monitoring provides the continuous, asset-level visibility that turns those decisions from guesses into precision interventions. The result is a measurable, auditable 20–30% reduction in energy spend, a dramatically lower unplanned downtime rate, and a compliance posture that keeps pace with ISO 50001, CBAM, and ESG reporting demands — all from a platform that is operational within five weeks and does not require a capital infrastructure overhaul. Facilities that move from reactive billing analysis to iFactory's AI-driven monitoring model do not simply reduce costs — they build a resilient, data-backed operational foundation for the energy transition ahead. Ready to quantify the savings potential for your specific asset base? Book a Demo with an iFactory oil and gas specialist and walk away with a site-specific ROI estimate.
Frequently Asked Questions
Q: How does iFactory connect to existing oil and gas control systems?
iFactory integrates via standard industrial protocols — OPC-UA, Modbus, J1939, and direct PLC/SCADA connections — without requiring changes to existing control system architecture, typically completing integration within one to two weeks.
Q: How quickly does the AI model learn our equipment's normal behavior?
The ML baseline is established within the first 30 days of live data collection, after which predictive anomaly alerts begin firing with validated accuracy of 91–96% against your specific asset fingerprints.
Q: Does iFactory support offshore platform deployments with limited connectivity?
Yes — iFactory's edge computing architecture processes critical analytics locally at the gateway level, supporting intermittent connectivity environments including offshore platforms, remote wellheads, and pipeline compression stations.
Q: Can iFactory automatically generate ISO 50001 and ESG compliance reports?
Yes — iFactory continuously calculates Scope 1 and 2 emissions, tracks Energy Performance Indicators, and generates audit-ready documentation for ISO 50001, GHG Protocol, CDP, and EU CBAM without any manual data aggregation.
Q: What is the typical payback period for iFactory Energy Monitoring?
Most oil and gas facilities achieve full platform cost recovery within six to nine months through combined energy savings, avoided unplanned downtime costs, and reduced demand charges — with positive ROI evidence appearing as early as week three of deployment.
Ready to Cut Your Oil & Gas Utility Costs by 30%?
Speak with an iFactory energy specialist today. Get a site-specific ROI estimate and a clear deployment roadmap — no obligation, no pressure.