Every 31 seconds, a patient in the U.S. acquires a healthcare-associated infection — costing hospitals an average of $28,400 per case in extended stays, litigation exposure, and CMS penalty clawbacks. The silent truth: most HAIs are not clinical failures. They are infrastructure failures — unmonitored HVAC pressure differentials, unmapped water system biofilm zones, and surface contamination blind spots that no manual rounding protocol can catch at scale.
Is Your Infrastructure Silently Generating HAIs?
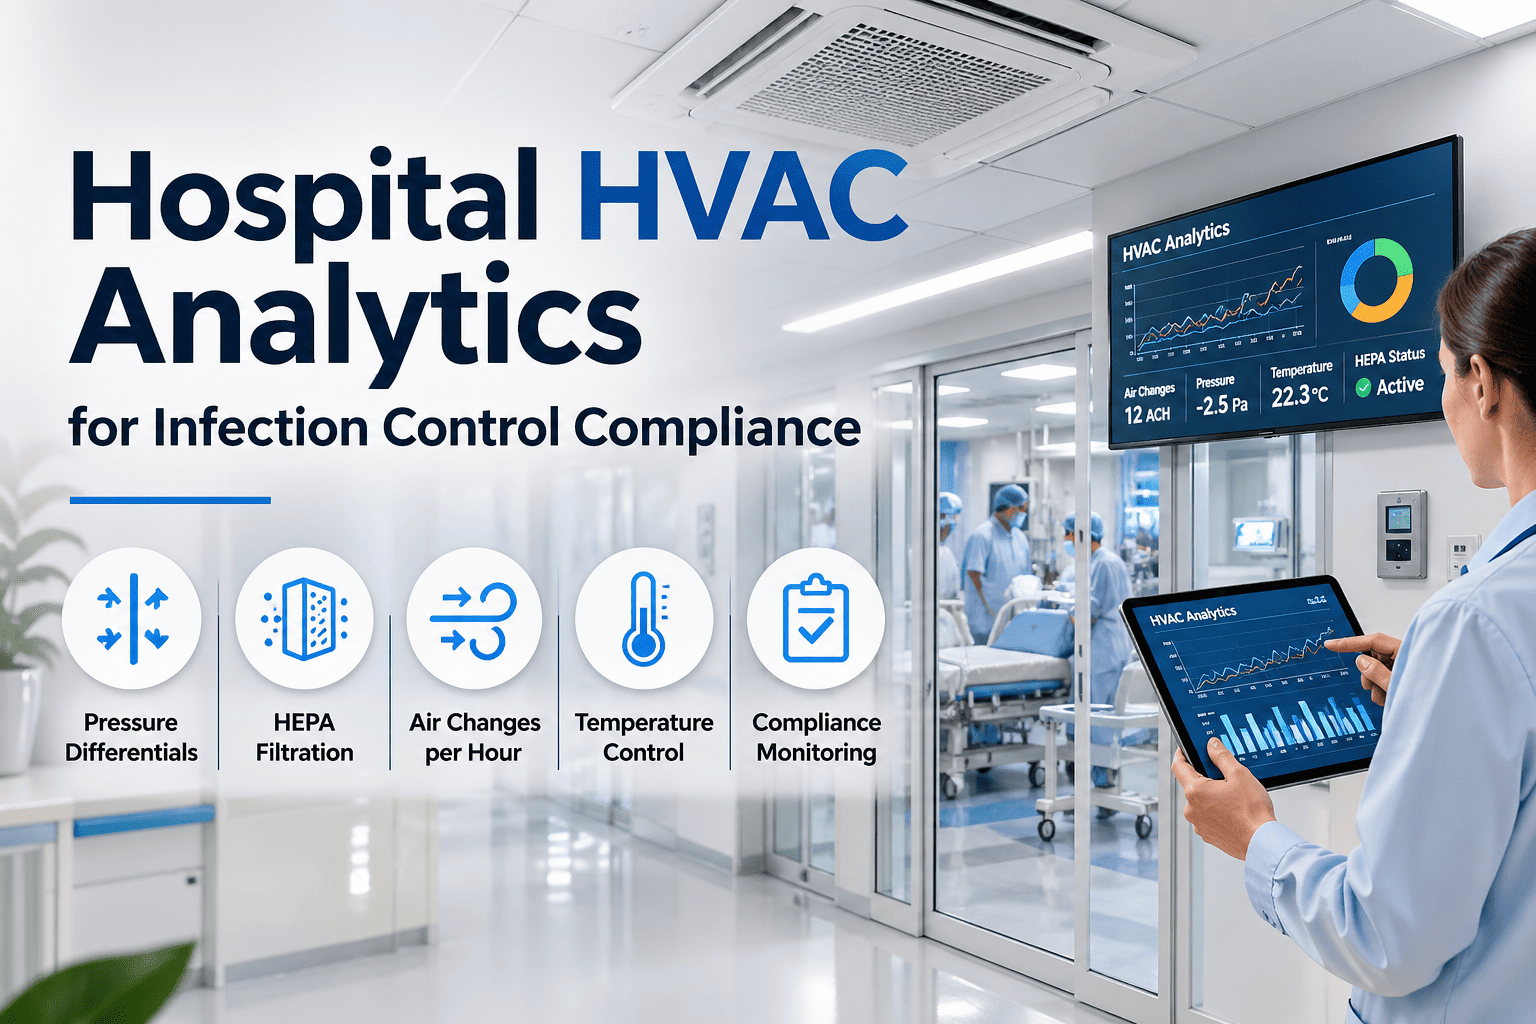
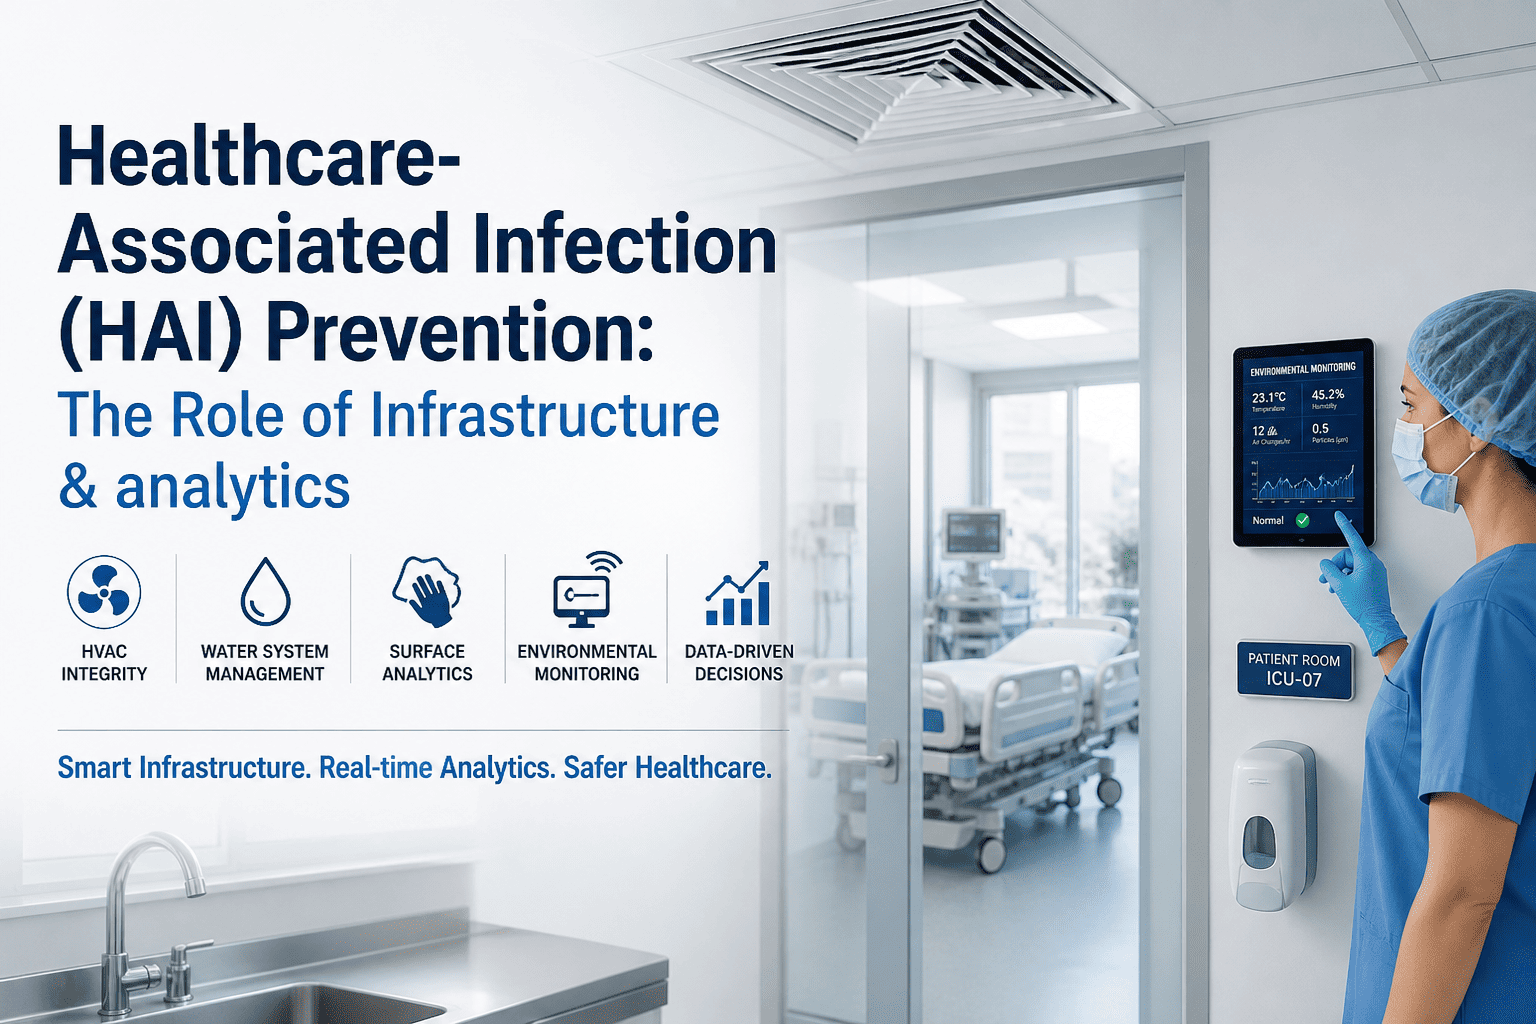
iFactory's Integrated Platform unifies HVAC analytics, water system monitoring, and environmental data into a single compliance-ready dashboard for healthcare leaders.
The True Cost of Reactive HAI Management
HAIs generate compounding losses that extend far beyond the bedside. Executives operating without real-time infrastructure analytics are absorbing preventable costs at every layer of the organization.
Revenue Leakage
- CMS withholds up to 1% of Medicare DRG payments for high HAI rates
- Average HAI litigation settlement: $400K–$2M per case
- Extended LOS consumes bed capacity from higher-margin elective cases
Operational Drag
- Manual environmental rounding generates no predictive signal
- Reactive remediation costs 6–8x more than proactive intervention
- Siloed HVAC, water, and surface data prevents cross-domain correlation
Regulatory Exposure
- TJC and CDC require documented environmental infection control programs
- Missing audit trails create survey deficiencies and conditional accreditation
- NHSN reporting gaps trigger mandatory public disclosure penalties
Patient Safety Gap
- CLABSI, CAUTI, MRSA, and CDI are all environmentally linked
- Air pressure failures in isolation rooms are invisible without sensors
- Water system Legionella risk rises without continuous temperature mapping
iFactory's Integrated Platform: Four Infrastructure Pillars
Effective HAI prevention requires a connected data layer — not isolated point solutions. iFactory's platform integrates four mission-critical infrastructure domains into a unified analytics engine.
| Infrastructure Domain | iFactory Capability | HAI Risk Addressed | Compliance Impact | Priority |
|---|---|---|---|---|
| HVAC & Air Quality | Real-time pressure differential monitoring | Airborne pathogen migration | TJC EC.02.06.01 | Critical |
| Water System Management | Continuous temperature & flow analytics | Legionella, Pseudomonas | CMS Condition of Participation | Critical |
| Surface & Contact Analytics | UV-C dosimetry & ATP mapping | MRSA, C. diff, VRE | CDC Environmental Guidelines | High |
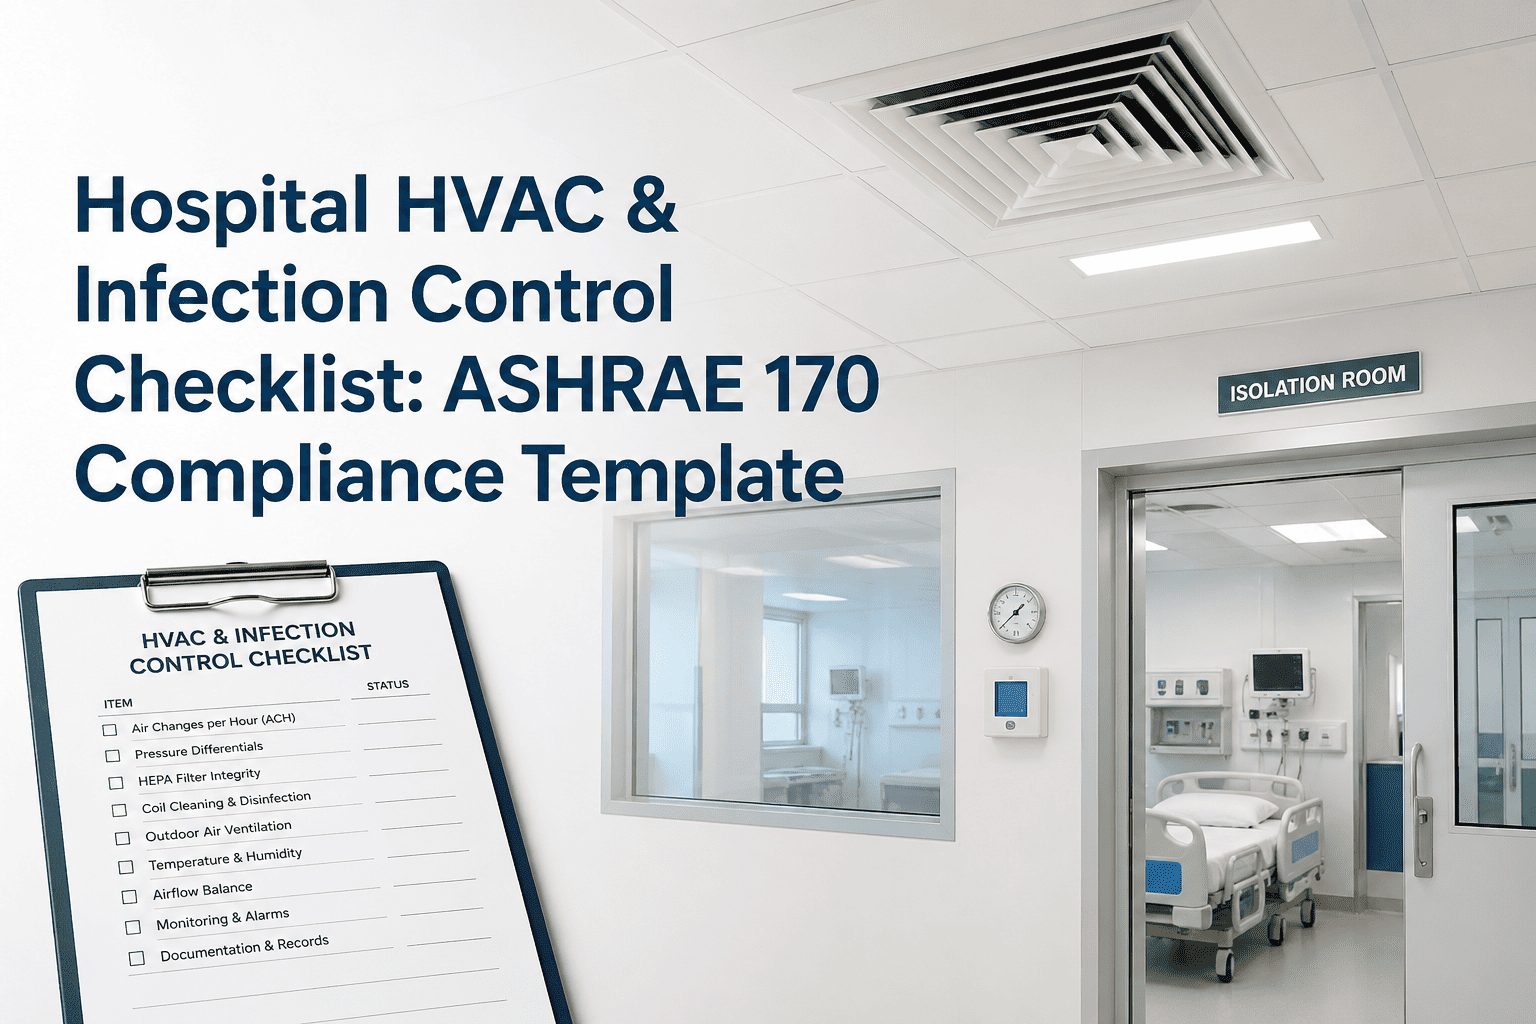
| Environmental Monitoring | Humidity, temperature, particulate sensors | Fungal & mold colonization | ASHRAE 170 / FGI Guidelines | High |
| Audit Trail & Reporting | Immutable logs, NHSN-ready exports | Documentation gaps | TJC Survey Readiness | Ongoing |
Legacy Friction vs. iFactory Optimized Excellence
The operational gap between reactive infection control and predictive infrastructure analytics is measurable in dollars, deficiencies, and patient outcomes.
Paper-based environmental checks with 4–8 hour gaps and no real-time alerting
HVAC, BMS, and water reports siloed in separate dashboards with no cross-correlation
Outbreak response triggered only after culture-confirmed cases — costing 6–8x more
Incomplete documentation creates survey deficiencies and conditional accreditation risk
Historical data is never aggregated for forecasting — every outbreak is a surprise
24/7 automated alerts for pressure, temperature, and particulate threshold breaches
Single dashboard correlates HVAC, water, surface, and environmental data in real time
AI flags risk zones before pathogen colonization — enabling proactive remediation
Every sensor event auto-logged with timestamps — TJC and NHSN export-ready
Long-term infrastructure data drives evidence-based replacement and renovation cycles
Operational Outcomes Across Three Critical Dimensions
Patient Safety
- Reduce airborne HAI risk via real-time pressure monitoring in isolation, OR, and ICU zones
- Eliminate Legionella risk corridors through continuous water temperature analytics
- Map high-touch surface contamination patterns to direct terminal cleaning resources
- Deploy UV-C dosimetry validation to confirm disinfection efficacy — not just compliance
Staff Efficiency
- Eliminate manual rounding burden — automated sensor alerts replace 80% of physical checks
- Give EVS teams priority heat maps instead of uniform rounding schedules
- Reduce infection preventionist documentation time by up to 60% with auto-generated reports
- Enable remote monitoring of multi-campus environments from a single command dashboard
Throughput & Revenue
- Reduce HAI-driven LOS extensions — freeing capacity for higher-margin elective cases
- Protect CMS value-based purchasing bonuses by maintaining top-quartile HAI rates
- Accelerate post-outbreak bed turnaround with documented environmental clearance records
- Strengthen payer contract leverage with verified infection control performance data
From Reactive Risk to Predictive Resilience: Five Steps
Infrastructure Baseline Audit
- Map all high-risk zones: ORs, ICUs, bone marrow units, water distribution endpoints
- Identify existing BMS, HVAC, and sensor data sources for integration
Sensor Deployment & Integration
- Install continuous pressure, temperature, humidity, and particulate monitoring nodes
- Integrate existing BAS/BMS feeds via vendor-neutral API connectors
Unified Dashboard Configuration
- Build role-specific views for infection preventionists, facilities, and C-suite
- Configure threshold-based alerts mapped to institutional HAI risk protocols
Predictive Model Activation
- Train AI models on baseline data to establish facility-specific risk thresholds
- Enable cross-domain correlation — linking HVAC anomalies to HAI cluster patterns
Compliance Automation & Reporting
- Auto-generate TJC, CMS, and NHSN-aligned documentation from live sensor logs
- Schedule executive-level HAI risk dashboards for weekly C-suite distribution
Stop Absorbing Preventable HAI Costs. Start Predicting Them.
iFactory's Integrated Platform gives healthcare leaders a single pane of glass for environmental infection control — from HVAC analytics to water system risk mapping.
HAI Prevention Infrastructure — Frequently Asked Questions
Does iFactory integrate with our existing BMS or HVAC control systems?
Yes. The platform uses vendor-neutral APIs to ingest data from existing building management systems, including Johnson Controls, Siemens, and Honeywell. No rip-and-replace is required — iFactory acts as the intelligence layer above your current infrastructure.
How does the platform support our Water Management Plan (WMP) compliance?
iFactory continuously monitors water temperature, flow rates, and stagnation risk across all distribution endpoints. It auto-generates WMP documentation aligned with CMS Conditions of Participation and CDC guidelines for healthcare water systems — including Legionella risk scoring.
Can the platform alert our infection preventionist in real time?
Absolutely. Role-based alerting pushes notifications via email, SMS, or mobile app when any environmental parameter crosses a configured threshold. Alerts are automatically logged with timestamp and sensor ID for audit trail purposes. Book a Demo to configure a custom alert protocol for your facility.
What is the typical ROI timeline for healthcare facilities?
Most facilities see measurable ROI within the first year through reduced HAI-driven LOS, avoided CMS penalty exposure, and EVS labor reoptimization. By year two, predictive maintenance prevents costly emergency HVAC and water system remediation. Book a Demo to review our healthcare ROI calculator.
Is patient data or PHI involved in the environmental monitoring platform?
No. iFactory's HAI prevention platform operates entirely on infrastructure and environmental sensor data — no patient records, EMR integration, or PHI is involved. The platform is deployable without HIPAA Business Associate Agreement requirements for environmental monitoring use cases.
Launch Your Environmental Infection Control Pilot Today
Join healthcare systems already protecting patients and margins with iFactory's integrated infrastructure analytics platform.
.png)