Every 31 seconds, a patient in a U.S. hospital acquires a healthcare-associated infection — not from their illness, but from the environment meant to heal them. For Infection Control Officers, that statistic is not an abstract metric. It is a direct indictment of facility management systems that cannot see what they cannot measure, cannot act on what they cannot track, and cannot prove compliance when regulators demand answers. The question is no longer whether your facility needs analytics-driven infection control. The question is how many patients, and how many dollars, you are losing each week without it.
Is Your Facility's HAI Risk Fully Visible?
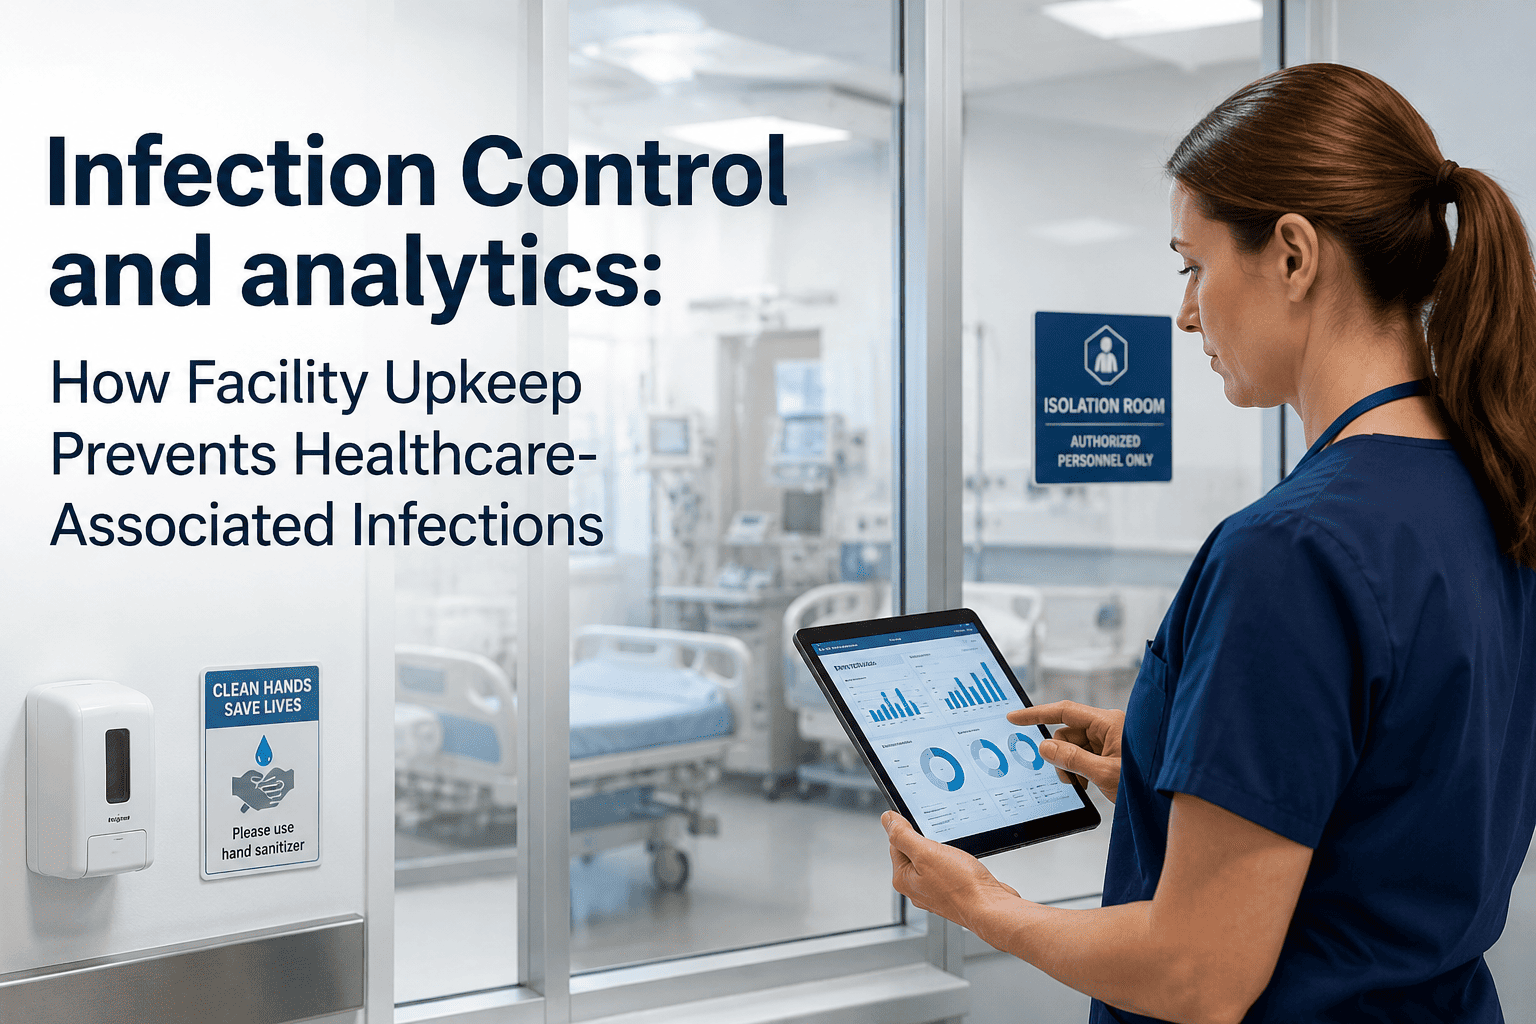
iFactory's analytics platform connects HVAC telemetry, water system monitoring, and OR surface compliance into one auditable control layer.
The True Cost of Reactive Infection Control
HAIs cost the U.S. healthcare system an estimated $28–45 billion annually. For a 400-bed hospital, a single Legionella outbreak can generate $1.2M+ in direct remediation costs, litigation exposure, and regulatory fines — before accounting for reputational damage and payer clawbacks. Infection Control Officers managing facilities without real-time analytics are operating reactively, addressing outbreaks after harm has occurred rather than preventing conditions that allow pathogens to establish.
HVAC & Air Quality
Unmonitored pressure differentials in negative pressure isolation rooms are responsible for up to 18% of airborne HAI transmission events in acute care settings.
Water System Failures
Legionella colonization occurs in systems where temperature and stagnation are not continuously tracked. Manual testing intervals create exposure windows that analytics eliminates.
OR Surface Integrity
Cracks, porous grout, and failed sealants in operating suites harbor biofilm that resists terminal cleaning. Visual-only audits miss 60–70% of surface failures pre-outbreak.
Compliance Documentation
CMS, Joint Commission, and state health departments require auditable evidence. Manual logs fail during surveys. AI-generated audit trails eliminate citation risk entirely.
Legacy Friction vs. iFactory Optimized Excellence
The gap between reactive and predictive infection control is not a matter of staff effort — it is a matter of system architecture. The table below maps the operational delta between conventional facility management and an analytics-driven infection control platform.
| Control Domain | Legacy Friction | iFactory Optimized | Clinical Outcome | Risk Level |
|---|---|---|---|---|
| HVAC Monitoring | Monthly manual checks | Continuous pressure telemetry | Airborne HAI reduction | Critical |
| Water System | Quarterly culture sampling | Real-time temp & stagnation alerts | Legionella elimination | Critical |
| OR Surface Audits | Visual pre-case inspection | AI surface integrity scanning | SSI rate decrease | Critical |
| Compliance Logs | Paper / spreadsheet records | Immutable digital audit trail | Zero citation risk | High |
| Outbreak Response | Post-event root cause | Predictive anomaly flagging | Prevention vs. reaction | High |
| Staff Workflow | Manual rounding burden | Automated task dispatch | Burnout reduction | Moderate |
How iFactory Analytics Closes Every HAI Vector
iFactory's infection control analytics platform operates across four integrated layers — each addressing a distinct transmission pathway. The result is a closed-loop system where environmental risk is continuously quantified, escalated, and documented without manual intervention.
HVAC Filtration & Pressure Intelligence
- Continuous negative-pressure verification in isolation and immunocompromised rooms
- HEPA filter load monitoring with predictive replacement scheduling
- Automated alerts when pressure differentials breach ASHRAE 170 thresholds
- Digital log entries timestamped per room per incident — survey-ready instantly
Legionella & Water System Analytics
- Continuous hot water temperature monitoring across all risk points
- Stagnation detection in low-flow zones with automated flush triggers
- Water Management Plan (WMP) compliance dashboard aligned to ASHRAE 188
- Incident documentation auto-populated for health department reporting
OR Suite Surface Integrity Monitoring
- AI-assisted imaging detects microfractures, failed grout, and porous surfaces
- Pre-case readiness score generated per OR per day
- Maintenance work orders auto-dispatched when surface integrity falls below threshold
- Trend analysis correlates surface degradation with SSI rates over time
AI-Driven Compliance Documentation
- Immutable audit trail for every environmental parameter, every shift
- Joint Commission and CMS survey export in one click
- Exception-based reporting surfaces only actionable anomalies to ICOs
- Regulatory change tracking updates compliance checklists automatically
Predictive Outbreak Prevention
- Machine learning models correlate multi-variable environmental signals to HAI risk scores
- Early warning system flags rising risk 72–96 hours before clinical indicators appear
- Root cause analysis dashboards reduce investigation time from days to hours
- Benchmarking against peer facilities accelerates performance improvement cycles
Measurable Outcomes Across Your Clinical Enterprise
Analytics-driven infection control does not only reduce HAI rates — it reshapes staffing efficiency, patient throughput, and regulatory standing simultaneously. The three pillars below represent the measurable operational transformation iFactory delivers.
Staff Efficiency
- Eliminate manual rounding for environmental checks
- Automated task dispatch reduces ICO administrative load by up to 40%
- Exception-based alerts mean staff act only when action is required
- Reduced burnout from repetitive documentation cycles
Patient Safety & Throughput
- Proactive OR readiness scoring increases on-time case starts
- Fewer HAI-related extended stays free bed capacity systemically
- Real-time isolation room compliance reduces cross-contamination events
- Faster outbreak containment limits patient cohort exposure windows
Financial & Regulatory ROI
- Avoid HAI-related CMS Value-Based Purchasing penalties
- Legionella prevention eliminates multi-million-dollar outbreak liability
- Survey-ready documentation reduces accreditation preparation cost
- Predictive maintenance extends capital asset life and defers CapEx
Why Most Infection Control Programs Remain Reactive
HVAC, water, and environmental data live in separate vendor platforms. Without integration, cross-domain risk signals are never correlated into a unified HAI risk score.
Monthly or quarterly checks create exposure windows. Pathogens establish and amplify between inspections. Continuous telemetry is the only clinically defensible standard.
Paper logs and spreadsheets are not auditable under CMS or Joint Commission standards. They fail during surveys and expose facilities to citation and penalty exposure.
Without AI modeling, infection control remains entirely reactive. Environmental deterioration goes undetected until a clinical signal — a patient — confirms the problem.
ICOs managing 400+ beds cannot conduct meaningful surveillance rounds across all infection vectors. Analytics automation is not optional — it is the only scalable model.
Facilities replacing OR flooring or HVAC components after a HAI event spend 3–5x more than facilities using predictive analytics to schedule proactive remediation.
Close Every Environmental HAI Vector in Your Facility
iFactory delivers continuous HVAC, water, and surface analytics with AI-driven compliance documentation built for Infection Control Officers at scale.
Infection Control Analytics — Frequently Asked Questions
How does iFactory integrate with existing BAS and CMMS systems?
iFactory uses vendor-neutral API connectors to ingest data from existing Building Automation Systems, CMMS platforms, and environmental monitoring hardware. No rip-and-replace is required. The analytics layer sits above your current infrastructure and begins generating risk intelligence within days of deployment.
Can the platform satisfy Joint Commission Environment of Care standards?
Yes. iFactory's compliance module is mapped directly to EC.02.05.01, EC.02.06.01, and IC.02.01.01 standards. Every environmental parameter generates an immutable, timestamped record. Survey preparation reports are exportable in one click. Book a Demo to review our accreditation mapping.
What is the implementation timeline for a 400-bed acute care hospital?
Phased deployment typically achieves full HVAC and water system telemetry within 60 days. OR analytics and compliance documentation layers activate in weeks 8–12. ICO dashboards are configured to your specific HAI surveillance priorities before go-live.
How does the predictive model generate HAI risk scores?
The AI engine correlates multi-variable environmental signals — pressure differentials, water temperature deviations, surface integrity degradation, and cleaning verification gaps — against historical HAI incidence data. Risk scores are updated continuously and escalated via role-based alerts to the ICO before clinical indicators appear.
Is patient data processed or stored within the platform?
No. iFactory's infection control analytics platform is entirely environmental — it processes facility and equipment telemetry only. No PHI is ingested, processed, or stored. This eliminates HIPAA risk and simplifies security review for health system IT governance teams.
Start Your Infection Control Analytics Pilot Today
Join healthcare systems already reducing HAI rates and eliminating regulatory citation risk with iFactory's continuous environmental intelligence platform.