Thermal power plants face an average of 18–34% environmental compliance risk annually due to undetected emission excursions — not from equipment failure, but from intermittent stack monitoring, manual opacity observations, and blind spots in legacy CEMS that cannot identify visible particulate spikes, fugitive dust plumes, or opacity exceedances in real time. By the time opacity violations, fugitive dust citations, or Title V permit exceedances are confirmed through manual reporting or regulatory audits, the compounding costs are already realized: EPA penalties, state enforcement actions, community complaints, and reputational exposure. iFactory AI Vision Emission Monitoring Platform changes this entirely — deploying computer vision models trained on power plant stack imagery to detect opacity exceedances, dust plume events, and visible emissions in real time, classifying incident severity before regulatory impact occurs, and integrating directly into your existing CCTV, CEMS, and environmental reporting systems without hardware replacement. Book a Demo to see how iFactory deploys AI vision emission monitoring across your plant within 6 weeks.
96%
Opacity exceedance detection accuracy with AI vision vs. 48% for manual Ringelmann observations
$620K
Average annual savings from avoided penalties, reduced monitoring labor, and proactive compliance
79%
Reduction in time-to-alert for visible emission events
6 wks
Full deployment timeline from camera audit to live AI emission monitoring go-live
Every Undetected Opacity Spike Is a Regulatory Risk. AI Vision Stops It at the Source.
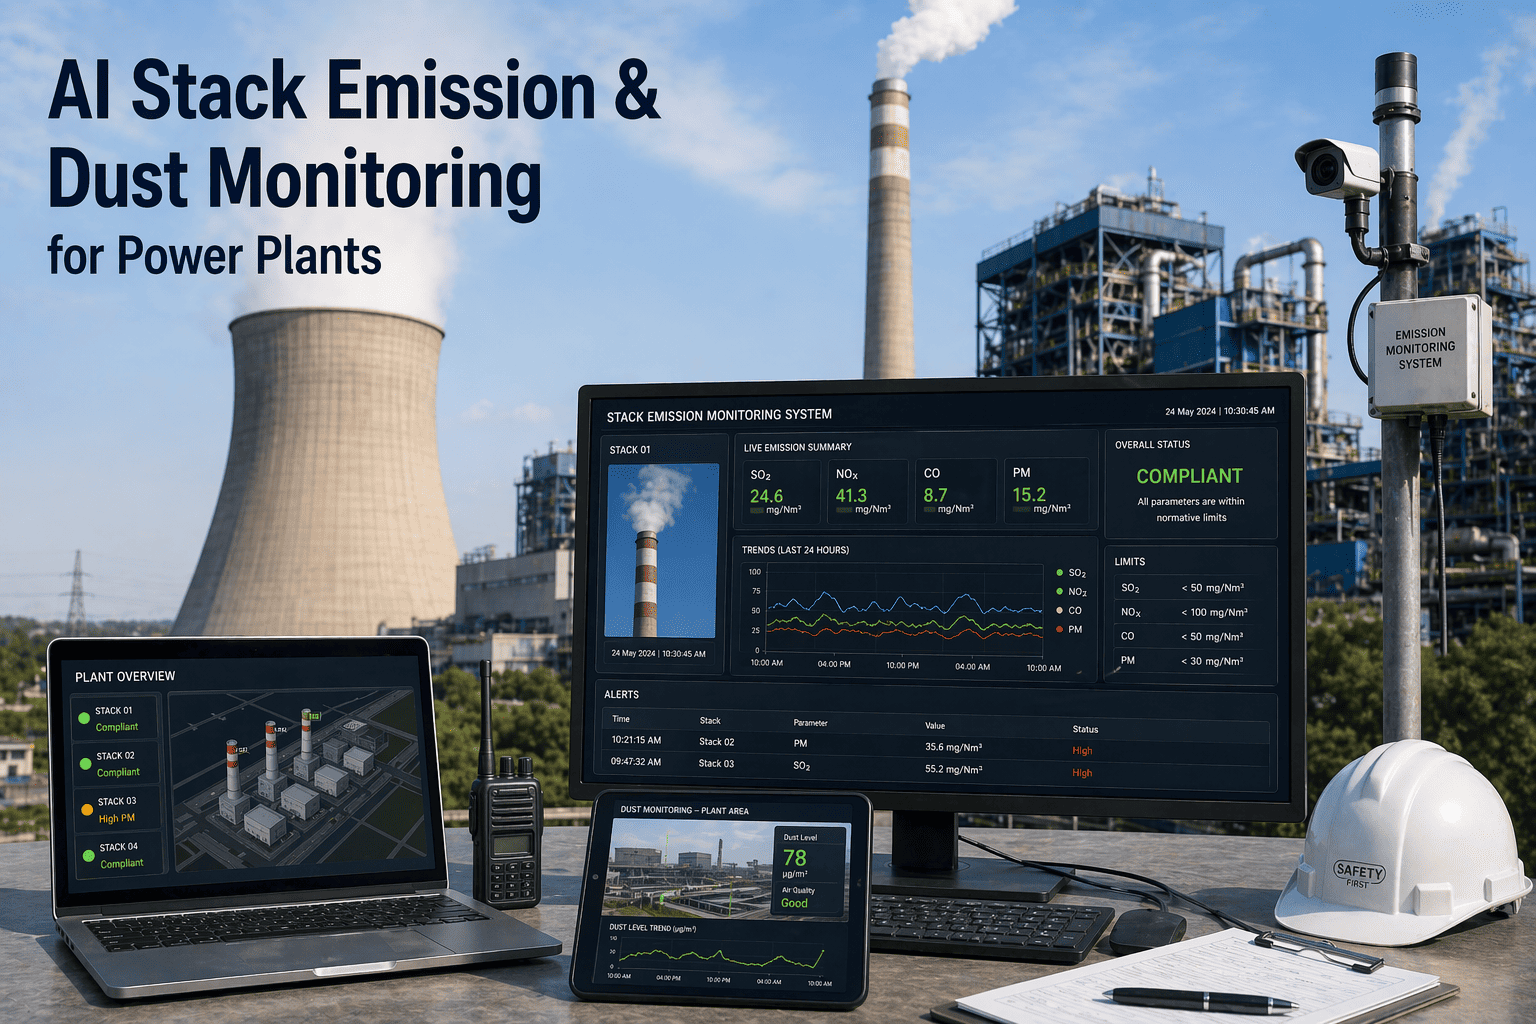
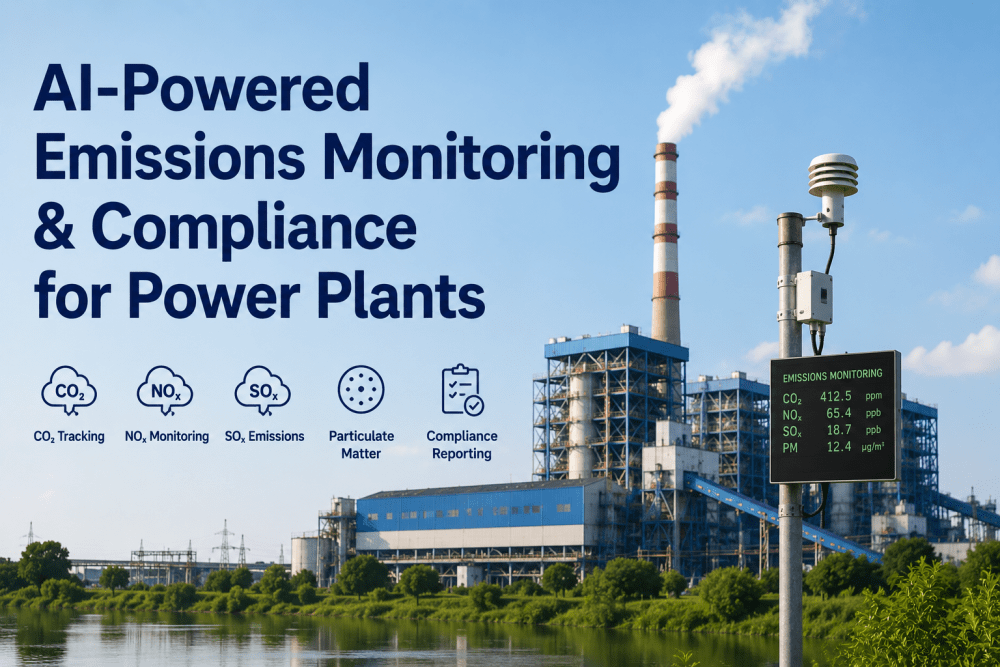
iFactory's AI vision engine monitors chimney stacks, coal handling areas, ash discharge points, and perimeter zones using existing CCTV feeds — detecting opacity exceedances, fugitive dust plumes, and visible particulate events in real time, with automated alerts, severity classification, and EPA-ready documentation for continuous environmental compliance.
The Hidden Cost of Manual Emission Monitoring: Why Legacy Methods Fail Power Plants
Before exploring solutions, understand the root causes of emission monitoring risk in thermal generation environments. Manual opacity observations and basic CEMS introduce systemic gaps that compound over time — gaps that AI vision directly addresses.
Intermittent Monitoring Blind Spots
Manual Ringelmann observations occur on fixed schedules. Opacity spikes, fugitive dust events, or visible emissions between observation windows go undetected — allowing minor excursions to become reportable violations.
Subjectivity and Observer Variability
Human opacity assessments vary by training, lighting conditions, and observer fatigue. Inconsistent documentation creates regulatory vulnerability during EPA or state inspections and enforcement actions.
Fugitive Dust and Perimeter Exposure
Coal piles, ash handling areas, and transfer points generate visible dust plumes that trigger community complaints and NESHAP citations. Without automated detection, plants lack defensible records for regulatory defense.
Compliance Documentation Gaps
EPA NSPS, NESHAP, and Title V permits require continuous, verifiable emission records. Manual logs and periodic reports lack timestamped visual evidence, real-time alerting, and automated audit trails for regulatory submissions.
How iFactory Solves Stack Emission & Dust Monitoring Challenges in Power Plants
Traditional emission monitoring relies on periodic Ringelmann observations, intermittent CEMS data, and reactive incident reporting — all of which respond after visible emissions have already occurred. iFactory replaces this with a continuous AI vision layer trained on power plant stack imagery that detects the precursors to opacity exceedances, not the violation notices themselves. See a live demo of iFactory detecting simulated opacity spikes and fugitive dust events in a coal-fired power facility.
01
AI-Powered Opacity Analytics
iFactory ingests video feeds from existing stack-facing cameras and applies computer vision models trained on plume textures, background contrast, and atmospheric conditions — detecting opacity exceedances with 96% accuracy, updated every 10 seconds.
02
Severity Classification and Alert Prioritization
Proprietary ML models classify each detection as minor plume variation, moderate opacity event, reportable exceedance, or fugitive dust release — with confidence scores attached. Operators receive graded alerts, not raw video floods. False positive rate drops to under 6%.
03
Predictive Emission Forecasting
iFactory's temporal reasoning engine identifies stack conditions trending toward opacity exceedance 20–60 minutes before impact — giving operators time to adjust combustion parameters, activate scrubbers, or optimize ESP performance proactively.
04
CCTV, CEMS & Environmental System Integration
iFactory connects to Honeywell, Siemens, ABB, and Rockwell DCS environments plus existing CCTV infrastructure and CEMS platforms via RTSP, ONVIF, OPC-UA, and REST APIs. No new cameras required in most deployments. Integration completed in under 8 days.
05
Automated EPA-Ready Compliance Documentation
Every emission event — detected, classified, and resolved — generates a structured compliance report with timestamped video evidence, opacity quantification, and regulatory impact tracking. Audit-ready for EPA NSPS Subpart Da, NESHAP for Coal-Fired EGUs, and state SIP requirements.
06
Emission Handling Decision Support
iFactory presents ranked action recommendations per alert — adjust air-fuel ratio, activate wet scrubber, optimize ESP rapping, or dispatch environmental team — with risk scores and estimated penalty cost per minute of delay. Teams act on verified visual evidence, not estimates.
?️ The Emission Intelligence Framework™
iFactory introduces a proprietary framework to measure and optimize emission monitoring compliance across four critical dimensions unique to thermal power generation environments:
?️
Detection Coverage
Stack-facing camera optimization, background calibration, and multi-angle plume correlation
⚡
Alert Velocity
Time from opacity detection to alert generation to control room notification
?
Regulatory Readiness
Automated EPA documentation, video evidence retention, and Title V reporting integration
?️
Proactive Mitigation
Predictive opacity forecasting, combustion optimization triggers, and dust suppression coordination
iFactory AI Emission Monitoring Implementation Roadmap
iFactory follows a fixed 5-stage deployment methodology designed specifically for power plant emission compliance workflows — delivering pilot detection results in week 3 and full production coverage by week 6. No open-ended implementations. No operational disruption.
01
Camera Audit
Map existing CCTV & identify stack coverage gaps
02
System Integration
Connect CCTV, CEMS, EPA reporting via APIs
03
Model Calibration
AI training on plant-specific stack imagery & lighting
04
Pilot Validation
Live detection on 2–4 critical stacks or dust zones
05
Full Production
Plant-wide AI emission monitoring live
6-Week Deployment and ROI Plan
Every iFactory engagement follows a structured 6-week program with defined deliverables per phase — and measurable ROI indicators beginning from week 3 of deployment. Request the full 6-week deployment scope document tailored to your emission monitoring configuration.
Weeks 1–2
Discovery & Design
Current emission monitoring workflow assessment across stacks, coal handling, and ash areas
Camera coverage mapping and AI model design aligned with stack geometry and atmospheric conditions
Integration planning with CEMS, DCS, and EPA reporting systems
Weeks 3–4
Pilot & Validation
Deploy AI vision detection to high-risk zones: primary stacks, coal pile perimeters, ash discharge points
Alert workflows and EPA documentation protocols activated; false positive tuning with environmental team
First opacity exceedance detections captured — ROI evidence begins here
Weeks 5–6
Scale & Optimize
Expand to full plant emission network: all stacks, coal handling areas, and perimeter monitoring zones
Automated EPA compliance reporting activated for NSPS, NESHAP, and Title V frameworks
ROI baseline report delivered — penalty avoidance, monitoring labor reduction, and audit efficiency gains
? ROI IN 4 WEEKS: MEASURABLE RESULTS FROM WEEK 3
Plants completing the 6-week program report an average of $112,000 in avoided penalties and monitoring costs within the first 4 weeks of full production rollout — with opacity detection improvements of 42–68% detected by week 3 pilot validation.
$112K
Avg. savings in first 4 weeks
42–68%
Detection improvement by week 3
74%
Reduction in manual opacity observation labor
Eliminate Opacity Blind Spots. Deploy AI Emission Monitoring in 6 Weeks. ROI Evidence in Week 3.
iFactory's fixed-scope deployment program means no open timelines, no camera replacement costs, and no months of customization before you detect your first emission excursion.
Use Cases and KPI Results from Live Deployments
These outcomes are drawn from iFactory deployments at operating power plants across three emission monitoring scenarios. Each use case reflects 6-month post-deployment performance data. Request the full case study report for the emission monitoring scenario most relevant to your plant.
A 550MW coal-fired facility operating 2 primary stacks was experiencing recurring opacity excursions traced to intermittent manual Ringelmann observations and delayed CEMS correlation. Legacy monitoring required certified observers to conduct hourly visual assessments — missing short-duration spikes 68% of the time. iFactory deployed AI vision opacity analytics across both stacks, with models trained on plume contrast, background calibration, and atmospheric variability. Within 3 weeks of go-live, the system detected 23 early-stage opacity events at the precursor phase — before any reportable exceedance or EPA notice.
23
Early-stage opacity events detected in first 3 weeks
$285K
Estimated annual penalty and monitoring cost prevented
95%
Detection accuracy on opacity exceedance events
A biomass co-firing facility was receiving quarterly state enforcement notices for visible coal dust emissions from transfer points and storage piles, traced to undetected plume events during high-wind conditions. Manual visual inspections could not reliably identify low-visibility dust emissions across large perimeter areas. iFactory deployed AI vision dust detection with plume trajectory modeling and wind correlation, enabling proactive activation of water spray systems before emissions breached NESHAP limits. The plant achieved zero visible emission citations in the 6 months post-deployment and reduced water spray usage by 19% through targeted activation.
0
State visible emission citations post-deployment
19%
Reduction in water spray consumption
$198K
Annual compliance and water cost value
A combined cycle facility with coal backup capability was struggling with inconsistent ash handling emission documentation during Title V permit renewals. Manual logs and periodic photos lacked timestamped, quantifiable evidence for EPA review. iFactory deployed AI vision emission monitoring across ash silos, conveyor discharge points, and loading areas, with automated opacity quantification and EPA-ready report generation. All 14 ash handling observations in the subsequent audit cycle were resolved with defensible video evidence, and the plant achieved zero procedural findings in its Title V renewal inspection.
100%
Ash emission observations resolved with video evidence
0
Procedural findings in Title V renewal audit
$137K
Annual compliance documentation labor savings
What Power Plant Environmental Leaders Say About iFactory AI Vision
The following testimonial is from an environmental compliance director at a facility currently running iFactory's AI vision emission monitoring platform.
We transformed our opacity monitoring from a reactive, subjective process to a proactive, defensible system. iFactory's AI vision detects opacity spikes the moment they occur — not hours later during the next Ringelmann round. In the first quarter alone, it flagged 17 short-duration excursions that would have become reportable events. More importantly, every detection includes timestamped video evidence and EPA-aligned quantification. That documentation alone streamlined our last NSPS audit and gave our legal team confidence during a state enforcement inquiry. The system paid for itself in avoided penalties and reduced observer labor — but the real value is the peace of mind that comes from continuous, verifiable compliance.
Director of Environmental Compliance
Coal-Fired Power Station, Pennsylvania, USA
Frequently Asked Questions
Does iFactory require new cameras or hardware to be installed?
In most deployments, iFactory connects to existing CCTV infrastructure via RTSP or ONVIF protocols — no new cameras required. Where coverage gaps are identified during the Week 1 camera audit, iFactory recommends targeted additions only (typically 2–4 cameras per stack or dust zone), not a full system overhaul. Integration is complete within 8 days in standard environments.
Which plant systems does iFactory integrate with?
iFactory integrates natively with Honeywell Experion, Siemens PCS 7, ABB System 800xA, Rockwell PlantPAx, and Yokogawa CENTUM for process data; existing CEMS platforms for emission correlation; and EPA reporting tools like CEDRI, ERT, or custom environmental management systems. Integration scope is confirmed during the Week 1 camera audit.
How does iFactory handle variable lighting, weather, or atmospheric conditions common in stack monitoring?
iFactory's AI models are pre-trained on power plant stack imagery across varied lighting, fog, steam, and atmospheric conditions. The platform includes adaptive preprocessing for low-contrast enhancement, background subtraction, and weather-correlation modeling. Model calibration during Week 3–4 fine-tunes detection thresholds for your plant's specific visual and meteorological environment.
Can iFactory operate with intermittent network connectivity?
Yes. iFactory offers edge-deployment options with local inference processing and store-and-forward alerting. Detections are processed on-premises and sync to the central platform when connectivity restores. Zero detection gaps during network interruptions — critical for continuous compliance monitoring.
How does iFactory align with EPA opacity quantification standards?
iFactory's opacity quantification models are calibrated against EPA Reference Method 9 protocols and validated using certified Ringelmann charts. The platform generates opacity percentages aligned with NSPS reporting requirements, with confidence intervals and calibration records included in automated compliance reports for audit defensibility.
What if our plant has unique stack configurations or emission sources?
iFactory's model builder allows configuration of custom detection zones, opacity thresholds, and escalation rules without code. Our implementation team works with your environmental, operations, and maintenance teams during Week 1–2 to align the platform with your specific stack geometries, emission sources, and compliance obligations under NSPS, NESHAP, or Title V permits.
Stop Missing Opacity Spikes. Start Detecting Them in Real Time. Deploy AI Emission Monitoring in 6 Weeks.
iFactory gives power plant environmental teams real-time opacity detection, severity-classified alerts, EPA-ready compliance documentation, and seamless system integration — fully deployed in 6 weeks, with ROI evidence starting in week 3.
96% opacity detection accuracy with existing CCTV
CEMS, DCS & EPA reporting integration in under 8 days
NSPS, NESHAP & Title V audit-ready incident reports
Edge deployment option for low-connectivity zones