When a gas turbine trips at 2:17 a.m. on a Saturday during a heat wave dispatch event the quality of the emergency maintenance response that follows is determined almost entirely by decisions made before the alarm fired. Which spare parts are staged and where? Who gets called first, what sequence, and with what information? What is the fastest safe path to restoring generation capacity — and what does the work order look like when the maintenance crew arrives? At most U.S. power plants the answers to those questions are stored in a combination of shift supervisor memory, paper emergency binders, and institutional knowledge that exists in the heads of three people, two of whom are not on duty at 2:17 a.m.
AI-driven emergency response analytics planning changes that architecture fundamentally. Rather than depending on human memory and paper procedures under time pressure, a properly configured analytics platform pre-builds the emergency response infrastructure from current asset condition data, equipment history, and failure mode libraries — so when the alarm fires, the critical spare identification is already done, the escalation workflow routes automatically, and the emergency work order arrives pre-populated in the CMMS before the first technician picks up a wrench. For power plant operations leaders, this is not a technology upgrade. It is the difference between a four-hour emergency response and a fourteen-hour one — and at $12,000 to $45,000 per hour of forced outage cost, that difference has a specific dollar value attached to it.
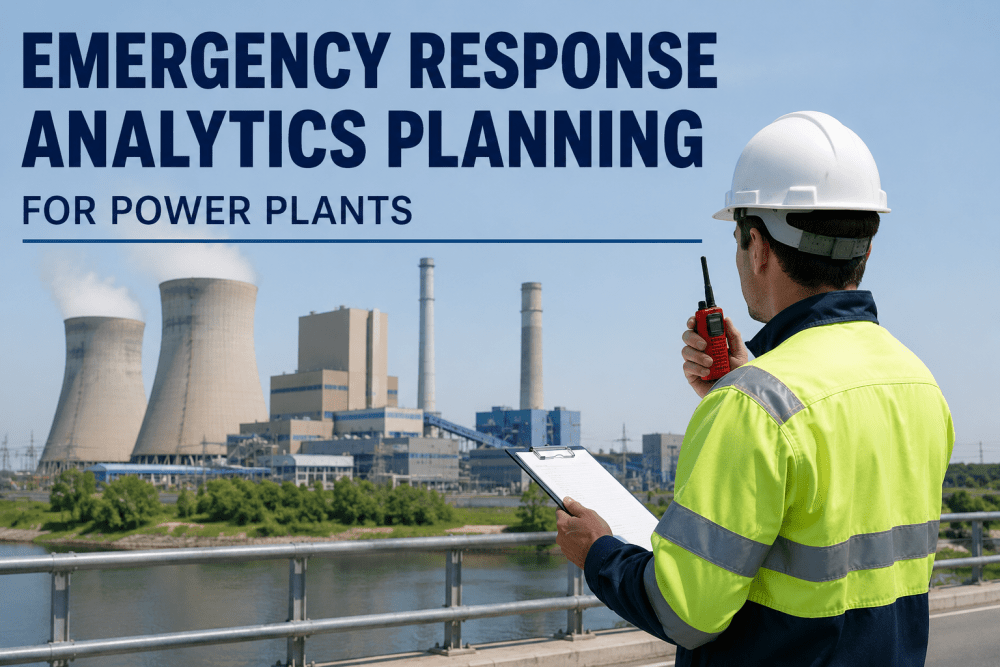
Emergency Response Analytics Planning for Power Plants
AI-driven critical spare identification, escalation workflows, and emergency work order procedures — configured in your analytics platform before the alarm fires, not after.
Why Ad Hoc Emergency Response Is the Most Expensive Maintenance Mode
Emergency maintenance events at power plants are expensive in two distinct ways. The first is the unavoidable cost — replacement power, lost generation revenue, and repair labor that would exist regardless of how well-prepared the plant was. The second is the avoidable cost — the additional hours of downtime generated by parts hunting, escalation delays, diagnostic uncertainty, and work order assembly that a properly configured emergency response analytics plan eliminates. At most plants operating without structured emergency response analytics, that avoidable cost represents 30 to 50 percent of the total emergency event cost.
Parts Identification Delay
When an emergency requires a specific replacement part, the time spent identifying the correct part number, confirming availability, and locating physical stock adds hours to every emergency event. Pre-configured analytics emergency response plans include pre-identified critical spare assemblies for every high-consequence failure mode — ready before the alarm fires.
Escalation Routing Failure
Emergency events that occur outside business hours frequently lose 30 to 90 minutes to escalation routing — identifying who to call, in what sequence, with what authority level, and with what technical information. Without a pre-configured automated escalation workflow, that routing happens manually under time pressure by whoever happens to be on shift.
Diagnostic Uncertainty
Emergency work orders assembled without pre-built diagnostic context send technicians to the field without the failure mode classification, prior event history, and sensor trend data that would focus the investigation. The result is time spent on investigation that should have been spent on repair — because the analytics platform already had the failure mode identified when the alarm fired.
Work Order Assembly Under Pressure
Manually creating a CMMS work order during an active emergency — under shift pressure, with incomplete equipment information, at 3 a.m. — produces incomplete work orders that create documentation gaps, parts procurement errors, and labor authorization problems that extend the event. Emergency work orders should arrive pre-populated, not be assembled during the event.
Want to see how AI-driven emergency response planning maps to your specific equipment and failure mode library? Book a 30-minute emergency response assessment with iFactory's power generation team.
The Four Pillars of AI-Driven Emergency Response Analytics Planning
Effective emergency response analytics planning is not a single feature — it is an interconnected set of capabilities that the analytics platform must have pre-configured before an emergency occurs. The four pillars below define what a complete emergency response analytics plan looks like inside a purpose-built power plant analytics platform.
The analytics platform's failure mode library maps every high-consequence failure mode to the specific spare parts and assemblies required for the repair — identified by exact part number, OEM specification, lead time, and current inventory location. When an emergency alarm fires and the failure mode is classified, the pre-built critical spare assembly for that failure mode is immediately visible to the shift supervisor and maintenance coordinator — no part hunting required. Inventory levels for critical spares are tracked continuously and alert when stock falls below the minimum threshold defined by the emergency response plan.
Escalation workflows in a properly configured emergency analytics plan are not phone trees — they are event-triggered routing sequences that the platform initiates automatically when a high-consequence alarm fires. The specific escalation path — who is notified, in what sequence, with what technical context, and with what authority level — is defined by the failure mode classification and consequence severity tier. A Category A safety-consequence failure mode triggers a different escalation sequence than a Category B operational consequence event, and neither requires the shift supervisor to decide who to call under time pressure.
Emergency work orders generated from pre-built templates arrive in the CMMS fully populated — before the responding technician reaches the equipment. The template for each high-consequence failure mode includes asset identification, failure mode classification, diagnostic context from the platform's sensor analysis, recommended repair sequence, required parts from the critical spare assembly, safety isolation requirements, and estimated repair duration. The technician's job is to execute the repair — not to assemble the work order while standing in front of a tripped turbine at 3 a.m.
Emergency response procedures that were written at commissioning and never updated reflect the failure modes and repair sequences that applied when the equipment was new — not the failure modes developing in the current asset fleet. AI-driven analytics platforms maintain living emergency procedures that are updated as new failure mode patterns emerge from sensor data, as OEM technical bulletins are issued, and as prior emergency events reveal procedure gaps. When an emergency occurs, the responding team has access to the most current procedure — not a binder that was last revised in 2019.
Emergency Response Time Comparison: Ad Hoc vs. AI-Driven Pre-Planned Response
The financial impact of emergency response analytics planning is most visible when the full response timeline is mapped — from alarm to generation restoration. The comparison below maps both approaches against a representative high-consequence emergency event at a 250 MW combined cycle facility: a gas turbine trip due to compressor bearing failure during peak dispatch hours.
| Response Stage | Ad Hoc Response | Time | AI-Planned Response | Time | Time Saved |
|---|---|---|---|---|---|
| Failure Mode Identification | Shift supervisor reviews alarms, contacts reliability engineer, manually pulls sensor logs | 45–90 min | Analytics platform classifies failure mode automatically from alarm pattern at T+2 min | 2 min | 43–88 min |
| Escalation and Team Assembly | Supervisor manually contacts maintenance coordinator, who calls technicians — no documented escalation path | 30–75 min | Pre-configured escalation workflow triggers automatically with failure mode context pushed to all contacts | 4 min | 26–71 min |
| Critical Parts Identification | Maintenance coordinator searches CMMS for bearing specs, verifies inventory, locates physical stock | 45–90 min | Critical spare assembly for bearing failure mode pre-identified; inventory status confirmed in platform | 5 min | 40–85 min |
| Work Order Assembly | CMMS work order created manually during event — incomplete equipment data, missing procedure reference | 20–40 min | Emergency work order template auto-populates in CMMS with full sensor context and repair procedure | 3 min | 17–37 min |
| Technician Briefing and Dispatch | Supervisor verbally briefs arriving technician — incomplete context, no written diagnostic summary | 15–25 min | Technician receives pre-populated work order with event timeline, sensor data, and procedure reference | 5 min | 10–20 min |
| Total Pre-Repair Response Time | Ad hoc coordination and information assembly before first tool is picked up | 2.6–5.3 hrs | AI-planned response — all coordination and information pre-built before alarm fires | 19 min | 2.3–4.8 hrs |
Want to see how AI-driven emergency response planning maps to your specific equipment and failure mode library? Book a 30-minute emergency response assessment with iFactory's power generation team.
Building an Emergency Response Analytics Plan: The Implementation Workflow
A complete AI-driven emergency response analytics plan is built in a structured sequence — starting from the current asset failure mode library and working outward to escalation workflows, critical spare assemblies, and emergency work order templates. The following workflow maps that sequence for a 250 MW combined cycle facility configuring emergency response analytics for the first time.
The analytics team and plant reliability engineer review the current failure mode library — identifying the top 20 to 30 failure modes by consequence severity and financial impact. These become the failure modes for which emergency response plans will be pre-built in Phase 2. Failure modes are ranked by a weighted score combining consequence cost, probability of occurrence in the next 12 months based on current asset condition data, and current detection capability. The ranked list drives the sequencing and depth of plan development in the phases that follow.
For each ranked failure mode, the critical spare assembly is defined — specific part numbers, OEM specifications, minimum stock quantities, and current inventory location from CMMS records. The platform identifies inventory gaps: failure modes where the required spare is not currently stocked, where stock is below the emergency minimum threshold, or where the only spare is a long-lead item requiring advance procurement. A prioritized procurement recommendation list is generated from this gap analysis for review by the maintenance and procurement teams.
Emergency escalation workflows are configured for each consequence tier — defining the notification sequence, contact methods, acknowledgment windows, and backup escalation paths for events that occur outside business hours. The contact registry is built from current plant organizational data, including primary and backup contacts for each role, 24-hour contact information, and authority level documentation that determines who can authorize emergency procurement and emergency contractor dispatch. The escalation workflows are tested against a simulated emergency event to verify routing accuracy before go-live.
Emergency work order templates are built for each ranked failure mode — including asset identification, failure mode classification context, repair procedure reference, critical spare parts list, LOTO isolation points, and estimated repair duration. Templates are integrated bidirectionally with the CMMS — so when the analytics platform classifies an emergency failure mode, the corresponding work order template auto-populates in the CMMS and routes to the maintenance queue without manual entry. CMMS integration is tested with simulated emergency events for each template before production deployment.
Before the emergency response plan goes live, a tabletop exercise is conducted with the shift operations team, maintenance coordinator, and reliability engineer. The exercise simulates two or three of the highest-consequence failure modes — tracing the full response sequence from alarm detection through escalation, parts staging, work order dispatch, and return-to-service. Identified gaps in the escalation workflow, work order templates, or procedure references are corrected before the plan is activated. The exercise outcome is documented as the validation record for the emergency response plan.
After activation, the emergency response plan is maintained continuously — automatically updating critical spare assemblies when inventory changes are recorded in the CMMS, refreshing escalation contact information when organizational changes occur, and improving work order templates from post-event analysis of actual emergency responses. Every completed emergency event generates a plan improvement recommendation from the platform's post-event analysis, ensuring the plan improves with each activation rather than aging from the moment it was written.
Measured Outcomes: What Plants Report After Configuring Emergency Response Analytics
The financial return from emergency response analytics planning is generated every time a high-consequence alarm fires — with measurable outcomes in response time, outage duration, and total emergency event cost. The results below reflect outcomes reported by U.S. power generation facilities that deployed pre-configured emergency response analytics plans within their first 18 months of platform operation.
Want to see how AI-driven emergency response planning maps to your specific equipment and failure mode library? Book a 30-minute emergency response assessment with iFactory's power generation team.
Expert Review: What Reliability Leaders Say About Emergency Response Analytics Planning
Emergency response quality at power plants is determined entirely by preparation quality — specifically, by how much of the response chain was pre-built versus assembled under time pressure. I have supported emergency maintenance events at more than twenty generation facilities over my career, and the pattern is consistent: the plants that handle emergencies well are not necessarily the ones with the most experienced staff. They are the ones where the experience is encoded in the system rather than stored in someone's memory. Here are the four things every plant reliability leader should address before the next high-consequence emergency event.
Want to see how AI-driven emergency response planning maps to your specific equipment and failure mode library? Book a 30-minute emergency response assessment with iFactory's power generation team.
Conclusion
Emergency maintenance events at power plants carry two kinds of cost — the unavoidable cost of the failure itself and the avoidable cost of the response time that precedes the first tool on the equipment. At most facilities operating without pre-configured emergency response analytics, the avoidable cost represents 30 to 50 percent of the total emergency event cost — generated by parts identification delays, escalation routing failures, diagnostic uncertainty, and work order assembly that a properly built analytics plan eliminates entirely.
The investment in emergency response analytics planning is not proportional to the value it protects. A complete pre-configured emergency response plan — covering the top 20 to 30 failure modes by consequence severity, with critical spare assemblies, automated escalation workflows, and CMMS-integrated work order templates — is buildable in eight to ten weeks and protects against the full cost of every high-consequence emergency event the plant will experience. At $28,000 per hour of avoidable outage duration, the return on that investment is calculated from the first event it touches.
Ready to build a pre-configured emergency response plan before your next high-consequence event? Schedule your emergency response analytics assessment with iFactory's power generation team.