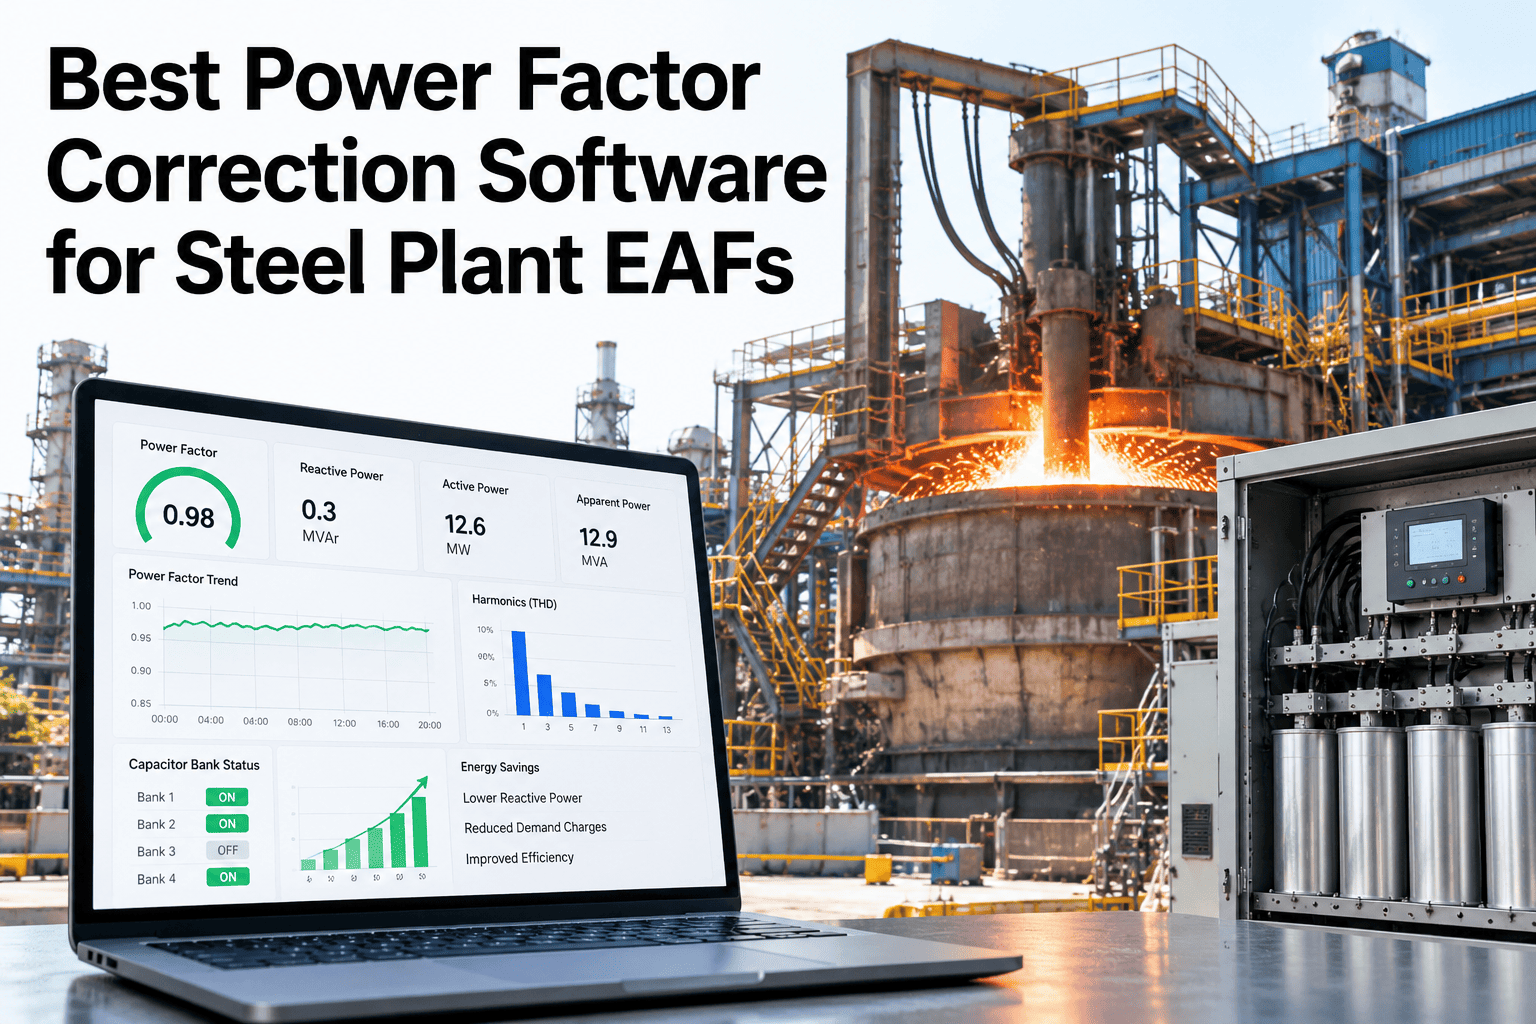
An arc furnace is a hard load for the grid to live with. Its reactive power swings as the arc stabilises and breaks, which drags power factor down, brings utility penalties and can disturb neighbouring customers with flicker. Compensation equipment is meant to cure that, but only when it is chosen and controlled to match the furnace. Software that watches the interface closely shows whether the equipment is earning its keep. Plants can ask iFactory AI how power factor and grid interface data are monitored on EAF lines.
Recover Power Factor Penalties and Steady the Grid Interface
iFactory AI watches power factor, reactive power and compensation performance on EAF lines, so penalties are recovered and the grid connection stays stable.
Why EAFs Are Hard on Power Factor
The furnace arc is unstable by nature. Four effects explain most of the problem.
Fluctuating reactive power
Arc length and current change constantly, so reactive demand swings from moment to moment.
Low average power factor
Heavy inductive load pulls power factor down, especially during melting.
Flicker and voltage dips
Rapid swings disturb voltage for other customers on the same network.
Harmonics
The arc distorts current waveform, which compensation equipment must handle.
A Worked Power Factor Example
This is illustrative arithmetic. Power factor equals real power divided by apparent power.
Compensation Options Compared
Three families of equipment handle the problem. This table shows how they differ.
| Option | Strength | Limit |
|---|---|---|
| Fixed capacitor banks | Low cost for steady reactive demand | Cannot follow fast swings |
| SVC (static var compensator) | Dynamic reactive support with filters for harmonics | Slower than power-electronic converters |
| STATCOM | Very fast response and flicker reduction | Higher cost |
| Hybrid (SVC plus STATCOM) | Combines wide range and fast response | More complex to control |
Static Banks or Dynamic Compensation
The difference is speed. An EAF changes faster than a static bank can follow.
Find Out How Much Power Factor Is Costing You
Book a 30-minute session and iFactory AI will review your interface data and tariff to show penalties, compensation performance and recovery potential.
The Monitoring Chain From Meter to Action
Good compensation needs good data. This chain shows how monitoring turns readings into savings.
Where Power Factor Problems Show Up
Problems cluster around certain phases and conditions. The matrix, shown as an illustration, narrows the search.
| Issue | Melting | Refining | Furnace Idle |
|---|---|---|---|
| Low power factor | High | Moderate | Low |
| Flicker and voltage dips | High | Moderate | Low |
| Harmonic distortion | High | Moderate | Moderate |
| Capacitor or filter stress | Moderate | Moderate | High |
A Five-Step Power Factor Recovery Plan
A clear sequence recovers penalties without guesswork.
Record power factor, penalties and flicker for several months.
Find the phases and intervals with the worst results.
Verify compensation capacity, settings and filter health.
Tune control settings or add capacity where gaps remain.
Confirm penalties fall and the interface stays stable.
Power Factor Review Checklist
Use this list monthly. Each box should be answerable from monitoring data.
A Composite Scenario: The Penalty That Followed a Furnace Upgrade
This is a composite example, not a named plant. It shows how monitoring finds a mismatch quickly.
Mistakes That Leave Penalties in Place
Common habits keep power factor problems alive.
Sizing for average load
Peak reactive demand is higher than the average.
Ignoring harmonics
Capacitors can resonate or fail without proper filtering.
Not retuning after changes
A new furnace or transformer changes what compensation must do.
Looking only at monthly averages
Averages hide the worst intervals that trigger penalties.
What iFactory AI Adds to Power Factor Management
iFactory AI is smart manufacturing and industrial software for steel and other heavy industry. Explore grid interface monitoring in a live product tour on realistic furnace data.
Review of EAF Power Factor Correction
A practical review of what makes compensation effective, written as editorial guidance rather than a named expert quote.
Match the tool to the furnace
Fast swings need dynamic compensation, while steady demand may not.
Watch intervals, not averages
Penalties are triggered by worst moments, so monitor them closely.
Retune after every change
Furnace and transformer changes alter what the equipment must do.
Frequently Asked Questions
Why does an EAF cause poor power factor?
The arc draws fluctuating reactive power, and the heavy inductive load lowers power factor, especially during melting. See this behaviour on live furnace data in a short demo. Dynamic compensation is designed to follow it. Per-heat tracking also shows which melting phase causes the lowest readings, which narrows the search for a fix.
What is the difference between SVC and STATCOM?
Both supply dynamic reactive power, but a STATCOM uses power electronics and responds faster, while an SVC is slower and often lower cost. Hybrids combine them. The right choice depends on furnace size and grid strength. Harmonics matter here, because filters and capacitors must be chosen so they do not resonate with the network.
How are power factor penalties calculated?
Utilities typically apply charges when power factor falls below a set threshold, using rules that differ by region. Ask support how your penalty rules are modelled against interval data before planning. Know the threshold and interval. Utilities set their own thresholds and measurement intervals, so check how penalties are calculated before judging any result.
Can software reduce penalties without new equipment?
Often partly, by finding settings, timing or maintenance issues that waste existing compensation. Hardware may still be needed for gaps. Monitoring shows which case you are in. Look at settings, switching logic and maintenance first, since a poorly tuned system can waste capacity already installed.
How soon can we see results?
Many plants identify their worst intervals within weeks of monitoring. Book time to scope a power factor monitoring pilot on one furnace. A traced penalty makes the next step clear. Trending flicker and voltage readings beside power factor shows whether the interface is truly steadier, not just cheaper.
Stop Paying for Reactive Power You Can Correct
iFactory AI watches power factor and compensation on every heat so penalties are recovered and the grid interface stays stable. Book a walkthrough to see it on your own furnace data.