Choosing the wrong metric for a steel plant doesn't just result in bad data — it leads to multi-million dollar capital misallocations and persistent bottlenecking in the rolling mill. In the 2026 "Smart Mill" landscape, the debate between OEE, TEEP, and OPE is no longer academic; it is a fundamental requirement for metallurgical decision support. While OEE focuses on how well you utilize your scheduled time, TEEP reveals your ultimate capacity, and OPE identifies the systemic friction between assets. For steel manufacturers under pressure to maximize EBITDA per ton, understanding the "Scheduled Time Paradox" is the only way to identify where your plant is leaking value. Book a demo to see how iFactory's unified metric fabric transforms fragmented sensor data into a strategic performance architecture.
The "Lethargy Gap" in traditional steel production reporting often masks the fact that while individual assets may appear efficient, the systemic flow of the plant is suboptimal. This gap is where profit recovery lives. By moving beyond reactive shift-end reporting to a proactive, AI-driven metric model, melt-shop and mill directors can finally align their mechanical reliability programs with their financial growth targets. Whether you are managing a high-frequency mini-mill or a traditional integrated plant, the ability to correlate First-Pass Yield (FPY) with Asset Availability is the operational baseline for market leadership in 2026.
Master Your Mill's Performance Architecture
iFactory's analytics platform delivers real-time OEE, TEEP, and OPE tracking with AI-driven bottleneck identification — purpose-built for high-speed steel manufacturing.
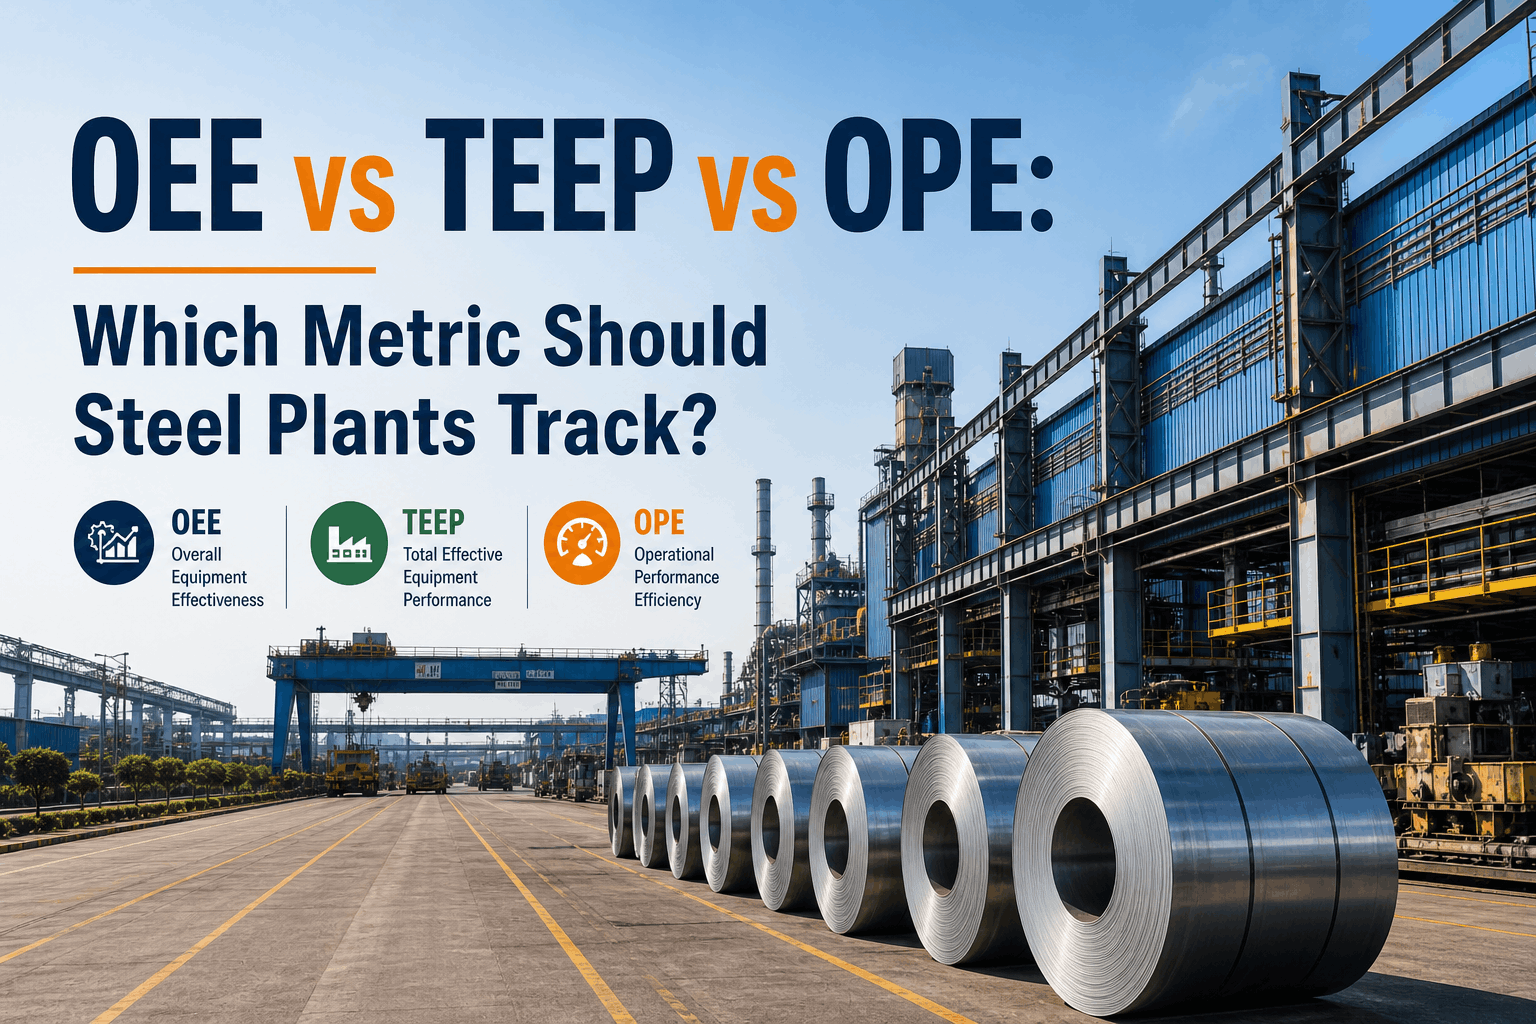
The Steel Plant Metric Dilemma: OEE vs. TEEP vs. OPE
Steel manufacturing is characterized by high asset intensity, complex metallurgical dependencies, and 24/7 operating cycles. In this environment, a single-dimensional view of performance is dangerous. A rolling mill might show a healthy 85% OEE, but if that mill is only scheduled for 10 hours a day due to upstream melt-shop constraints, its TEEP is actually less than 40%. Conversely, focusing only on individual machine OEE can hide the fact that a downstream slitting line is the systemic bottleneck causing OPE to plummet across the entire facility.
AI-powered metric platforms for steel plants close this visibility gap by calculating all three KPIs simultaneously and correlating them with metallurgical grade changes, shift transitions, and energy costs. Rather than manually consolidating spreadsheets at the end of the month, mill managers use book a demo to understand how real-time metric fusion identifies the specific point at which a mill loses its competitive edge — whether through unplanned downtime (OEE), under-utilized capacity (TEEP), or systemic flow issues (OPE).
Defining the 2026 Performance Framework for Steel
Overall Equipment Effectiveness
OEE measures how effectively a specific machine (e.g., a cold rolling mill) performs during its scheduled operating time. It is the gold standard for intra-shift tactical control, focusing on Availability (Is it running?), Performance (How fast?), and Quality (Is it saleable?). OEE identifies the "Six Big Losses" including equipment failure, setup/adjustments, idling/minor stops, reduced speed, process defects, and reduced yield.
Total Effective Equipment Performance
TEEP calculates effectiveness against calendar time (24/7/365). It reveals the ultimate throughput potential of your assets and is the critical metric for CapEx decisions — proving whether you need a new mill or just better scheduling. TEEP is the metric that matters most to the C-suite, as it directly correlates to the Return on Assets (ROA).
Overall Plant Effectiveness
OPE measures the efficiency of the entire production system, accounting for the inter-dependency between assets. It identifies cases where a "Hero Mill" running at high OEE is actually causing a "WIP Pileup" at a downstream slitting line. OPE exposes the "Systemic Friction" caused by inefficient logistics, ladle-to-tundish delays, and crane availability.
iFactory AI Predictive Guardrails
iFactory doesn't just track metrics; it predicts them. By analyzing real-time sensor streams against physics-informed metallurgical models, the AI predicts a 5% OEE drop up to 2 hours before it occurs, allowing supervisors to intervene during shift changes or scheduled pauses to prevent the loss.
Asset-Specific Metric Targets: Customizing Your KPIs
A common mistake in steel plant management is applying a uniform OEE target across disparate assets. A high-performance mini-mill requires specialized metric profiles for each stage of the liquid-to-solid transformation:
Power-On-Time vs. Tap-to-Tap Cycle Efficiency
In the EAF, Availability is redefined as "Power-On-Time." Performance is measured by the specific energy consumption (SEC) and the arc stability index. Quality is defined by the chemistry compliance of the liquid heat. iFactory tracks these sub-metrics to generate a "Furnace Health Score" that predicts refractory life while maintaining OEE.
The "Casting Pulse" and Breakout Prevention
For the CCM, the 'Q' in OEE is the primary driver. Any surface or internal defect translates to an immediate yield loss. The digital twin tracks the "Casting Pulse" — the synchronization of mold oscillation, secondary cooling, and strand speed — to ensure that Quality remains at 99.8% even at maximum Performance speeds.
Throughput vs. First-Pass Yield (FPY) Optimization
Rolling mills often sacrifice Quality for Performance. iFactory's metrics determine the "Metallurgical Speed Limit" — the maximum speed at which the mill can run without triggering dimensional or surface defects, effectively maximizing the OEE product rather than just the individual 'P' component.
Differentiating Between Planned vs. Unplanned Stoppages
In OEE, a planned maintenance window is excluded from the calculation. In TEEP, it is included. This distinction is vital for steel plant directors. If a mill has excessive "Planned" maintenance that suppresses TEEP while maintaining OEE, the digital twin surfaces this as a systemic reliability risk that requires a shift toward predictive analytics rather than reactive overhauling.
Metallurgical Constraints in Performance Metrics
Running a mill at 100% rated speed often compromises First-Pass Yield (Quality). iFactory's performance analytics determine the "Optimal Speed Setpoint" for each grade — the exact point where the product of Performance and Quality (the OEE sub-components) is maximized, rather than just chasing raw speed.
"We thought our cold mill was at its limit with an 88% OEE. When iFactory deployed TEEP and OPE tracking, we realized our ultimate capacity was only 42% due to ladle-to-tundish scheduling delays. By shifting our focus from machine speed to systemic flow, we achieved a 34% throughput gain in 12 weeks without a single dollar of CapEx."
Steel Plant Performance Matrix: Dimensional Comparison
| Dimension | OEE (Tactical) | TEEP (Strategic) | OPE (Systemic) |
|---|---|---|---|
| Time Basis | Scheduled Operating Time | Calendar Time (24/7) | System Sync Time |
| Calculation Focus | Machine-level losses | Total capacity utilization | Bottleneck efficiency |
| Best Used For | Daily shift management | CapEx & Capacity planning | Plant-wide flow optimization |
| Primary Stakeholder | Production Supervisor | Plant Director / CFO | Supply Chain Manager |
| Maintenance Strategy | Preventive (Scheduled) | Predictive (Condition-based) | Reliability-Centered (RCM) |
| Financial Impact | Immediate OpEx reduction | Long-term ROA improvement | Working Capital optimization |
| Compliance Link | Shift-level quality logs | Audit-ready capacity logs | End-to-end traceability |
| Root Cause Level | Equipment specific | Scheduling & Market demand | Inter-departmental friction |
| Data Feed | PLC / HMI events | Enterprise Resource Planning (ERP) | Integrated MES / SCADA |
The Decarbonization Link: Metrics for Green Steel
In the era of Green Steel, OEE and TEEP are no longer just productivity metrics — they are sustainability metrics. A mill running at low OEE due to micro-stoppages consumes significantly more standby energy than a mill running continuously. iFactory's digital twin correlates OEE scores with Specific Energy Consumption (SEC) and Carbon Intensity (kg CO2/ton), providing sustainability teams with the auditable data required for carbon border adjustment mechanisms (CBAM) and Scope 1/2 reporting. Talk to our engineers to see how iFactory automates your environmental metric reporting.
Implementation Roadmap: From Fragmented Logs to Unified Metrics
Establishing the Data Truth
Clean historical logs. Install non-invasive IoT sensors on critical assets (EAF, CCM, Rolling Mills). Establish the "Resolution" of your data to ensure Availability measurements are accurate to the millisecond. Timeline: 4–6 weeks.
Calculating the EBITDA Gap
AI establishes performance baselines across different metallurgical grades and scrap mixes. OEE, TEEP, and OPE calculations go live. The platform identifies the "Hidden Factory" — the lost capacity currently masked by manual logs. Timeline: 6–8 weeks.
Closed-Loop Performance Tuning
Metric insights feed directly into scheduling and maintenance workflows. AI recommends speed adjustments and shift-pattern changes to maximize TEEP and OPE. ROI reaches 100% within 12 months. Timeline: Ongoing.
Stop Guessing Your Mill's Potential — Start Measuring It
iFactory's analytics platform gives you real-time OEE, TEEP, and OPE intelligence with AI-driven throughput optimization — so your plant runs as a single, high-performance machine.
Frequently Asked Questions: Steel Plant Metrics
Why is TEEP more important than OEE for capital planning in steel?
OEE only tells you how well you use your scheduled time. TEEP shows you how much of the 24-hour day you are actually capturing value from. If OEE is high but TEEP is low, you have unused capacity that can be unlocked via better scheduling or upstream bottleneck removal, saving millions in unnecessary CapEx.
How does iFactory handle OPE in complex multi-strand casting operations?
OPE in iFactory accounts for the systemic synchronization between strands. It tracks how a delay on Strand 1 affects the overall throughput of the CCM and correlates this with ladle availability, providing a holistic "Plant Effectiveness" score rather than isolated equipment counts.
Can the platform differentiate between performance losses due to scrap quality vs. machine wear?
Yes. By correlating scrap-mix logs with performance speed (the 'P' in OEE), the AI identifies cases where declining performance is a metallurgical necessity due to poor scrap, rather than a mechanical issue in the EAF mast or drive system.
What is a typical "good" OEE score for a rolling mill in 2026?
While the industrial benchmark is 85%, top-performing mills utilizing iFactory consistently reach 92-94%. However, we emphasize that 90% OEE at 40% TEEP is a failure of scheduling, not mechanics.
Does the platform integrate with my existing ERP for TEEP calculations?
Yes. iFactory integrates with SAP, Oracle, and other ERP systems to ingest "Calendar Time" and "Market Demand" constraints, ensuring TEEP is a true reflection of the plant's business performance.
How long does it take to see ROI from OPE tracking?
OPE tracking usually identifies "bottleneck drift" within the first 4-8 weeks. By rerouting production or adjusting shift patterns based on these insights, plants typically recover the platform cost within 6 months.
Can iFactory track quality-based yield (Q in OEE) at the coil level?
Absolutely. The platform tracks first-pass yield, downgrade rates, and scrap-per-coil, correlating quality losses with specific equipment health states and operator shift profiles.
Is the system mobile responsive for mill floor access?
Yes. The entire dashboard is built for 17px+ typography and mobile-first navigation, allowing supervisors to check real-time OEE and bottleneck alerts directly from the plant floor.


.png)