Textile Color Consistency AI Batch to Batch Accuracy

By Adam Sinclair on June 3, 2026

color-consistency-ai-textile-batch-to-batch

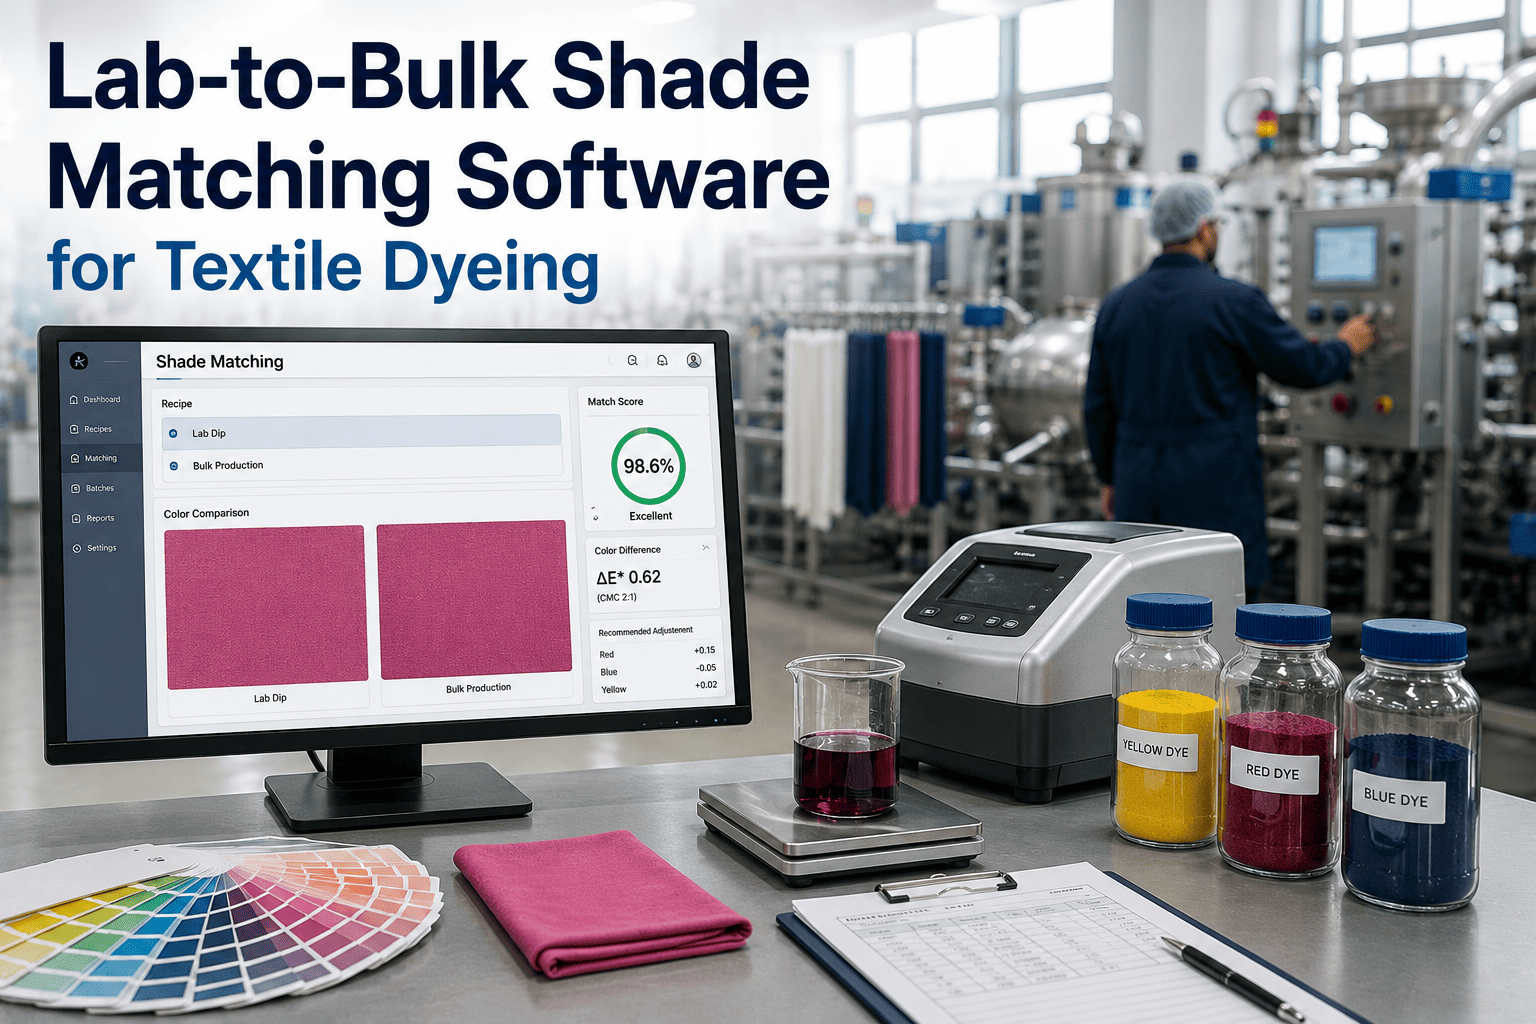
Every textile dyeing mill faces the same quality problem: the color that comes out of the dyeing machine does not match the color that was approved on the lab dip. Shade variation between batches, within batches, and across shifts generates re-dyeing, customer rejections, and production delays that cost dyeing mills 8 to 15 percent of their annual revenue in rework and claims. Human visual inspection under a light booth catches gross shade mismatches but cannot reliably detect Delta-E differences below 1.5. The human eye is sensitive to color differences but cannot measure them. Two inspectors looking at the same fabric under the same light will describe the same shade differently. AI-powered color consistency systems use calibrated inline spectrophotometers and vision-based color measurement to detect Delta-E differences as small as 0.2, maintain batch-to-batch consistency within a Delta-E tolerance of 0.8, and reduce re-dye rates by 60 to 75 percent. Mills that deploy AI color monitoring achieve first-pass yield rates above 94 percent compared to the industry average of 72 percent, and virtually eliminate shade complaints from customers.

Achieve Batch-to-Batch Color Consistency with AI

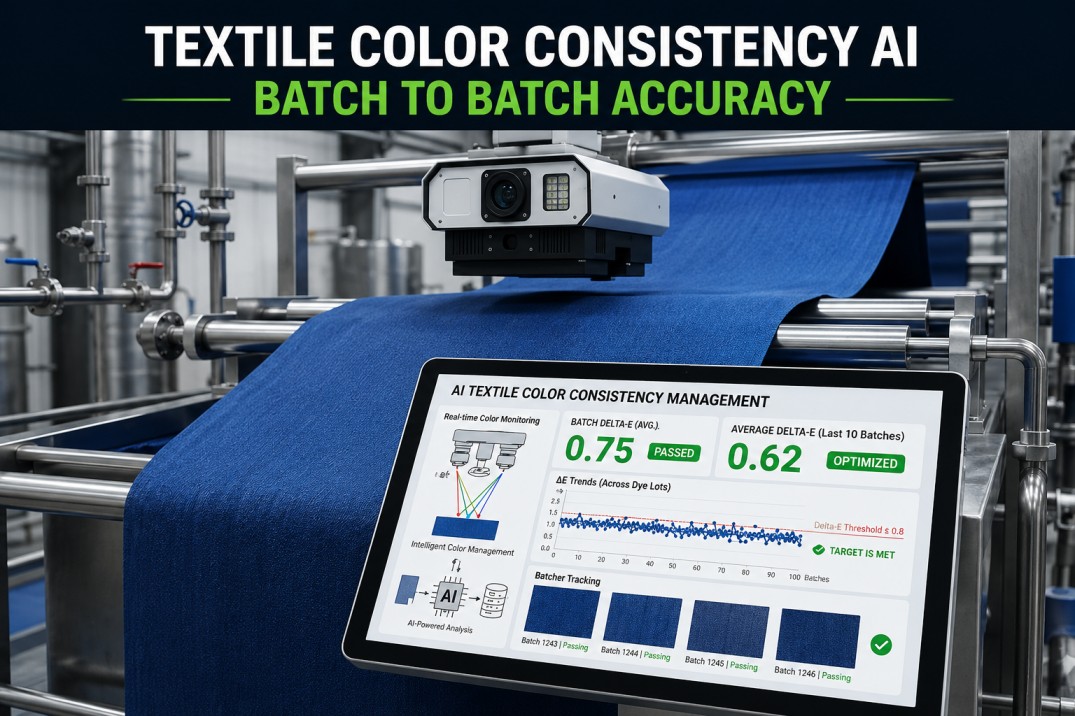
iFactory AI color monitoring detects shade variation in real time during the dyeing process, maintains Delta-E within 0.8 tolerance, and reduces re-dye rates by 60 to 75 percent. Deployed on jet dyeing, beam dyeing, and continuous ranges in 7 to 14 days.

Reference versus Batch Color Comparison

The swatch pairs below compare the approved reference color against actual batch production samples. Each pair shows the Delta-E difference between the reference and the batch. Values below 0.8 are within acceptable tolerance. Values above 1.5 are visible to the human eye and typically require correction or re-dyeing.


Navy — Batch #482 Delta-E 0.31 Pass


Burgundy — Batch #479 Delta-E 0.52 Pass


Olive — Batch #485 Delta-E 0.68 Pass


Brown — Batch #477 Delta-E 0.45 Pass


Forest — Batch #491 Delta-E 1.82 Fail


Plum — Batch #488 Delta-E 0.37 Pass

Delta-E Tolerance Scale

Delta-E is the standard metric for quantifying color difference between two samples. The scale below shows the range of Delta-E values from imperceptible difference to gross mismatch, along with the corresponding quality action for each range in textile production.


0.0 Perfect
0.3 Lab limit
0.8 Acceptable
1.5 Visible
3.0+ Reject
0.0 – 0.3

Difference is imperceptible even under controlled lab lighting. This is the tolerance standard for AATCC lab evaluation.

0.3 – 0.8

Difference may be visible under critical viewing but within acceptable production tolerance for most textile applications.

0.8 – 1.5

Difference is visible under normal viewing. Acceptable only for non-critical or internal use fabric.

1.5 – 3.0

Difference is clearly visible. Typically requires correction or re-dyeing before shipment.

3.0+

Gross mismatch visible from distance. Fabric rejected by customer, requires re-dyeing or disposal.

Dye Lot Quality Scorecard

The scorecard below shows key quality metrics tracked across all dye lots processed in a typical month. Mills using AI color monitoring consistently outperform mills relying on visual inspection or manual spectrophotometer sampling.

94% First-pass yield vs 72% industry avg
0.52 Avg Delta-E vs 1.42 industry avg
8% Re-dye rate vs 28% industry avg
99.7% Lots within tolerance within Delta-E 0.8
0 Shade complaints YTD customer claims
$0.08 Re-dye cost / yd vs $0.35 industry avg

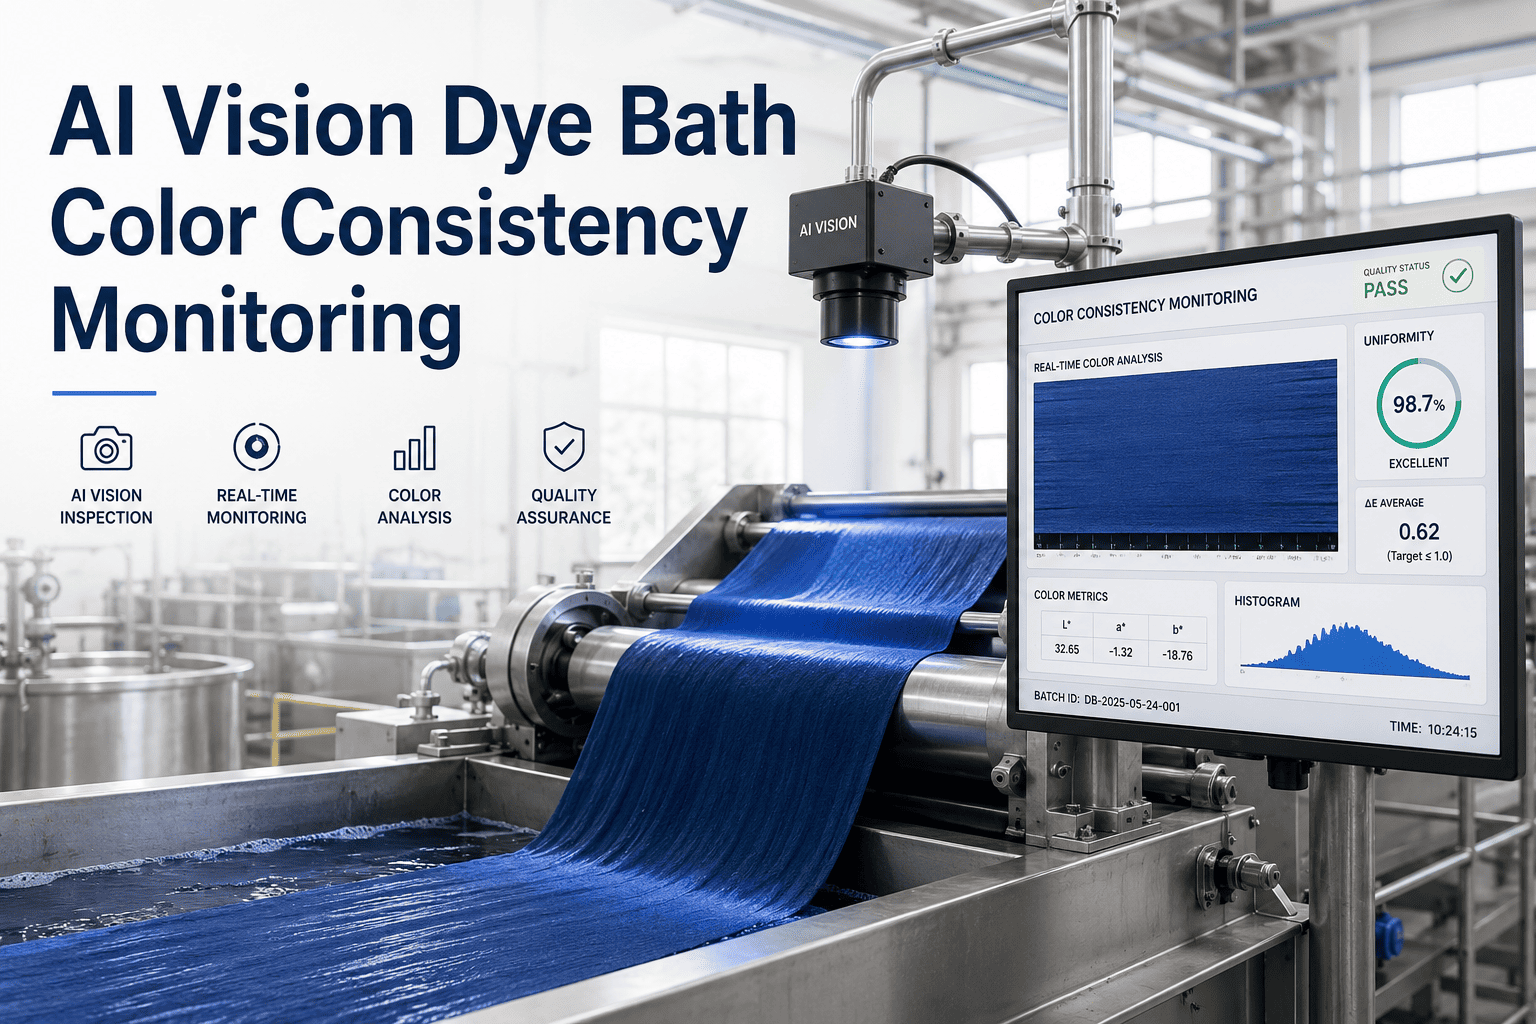
Monitor Color Consistency on Every Dye Lot

iFactory AI color monitoring measures every batch against the approved reference in real time. Delta-E tracked continuously, alerts triggered at configurable tolerance thresholds, and full batch history recorded for every dye lot. Deployed in 7 to 14 days.

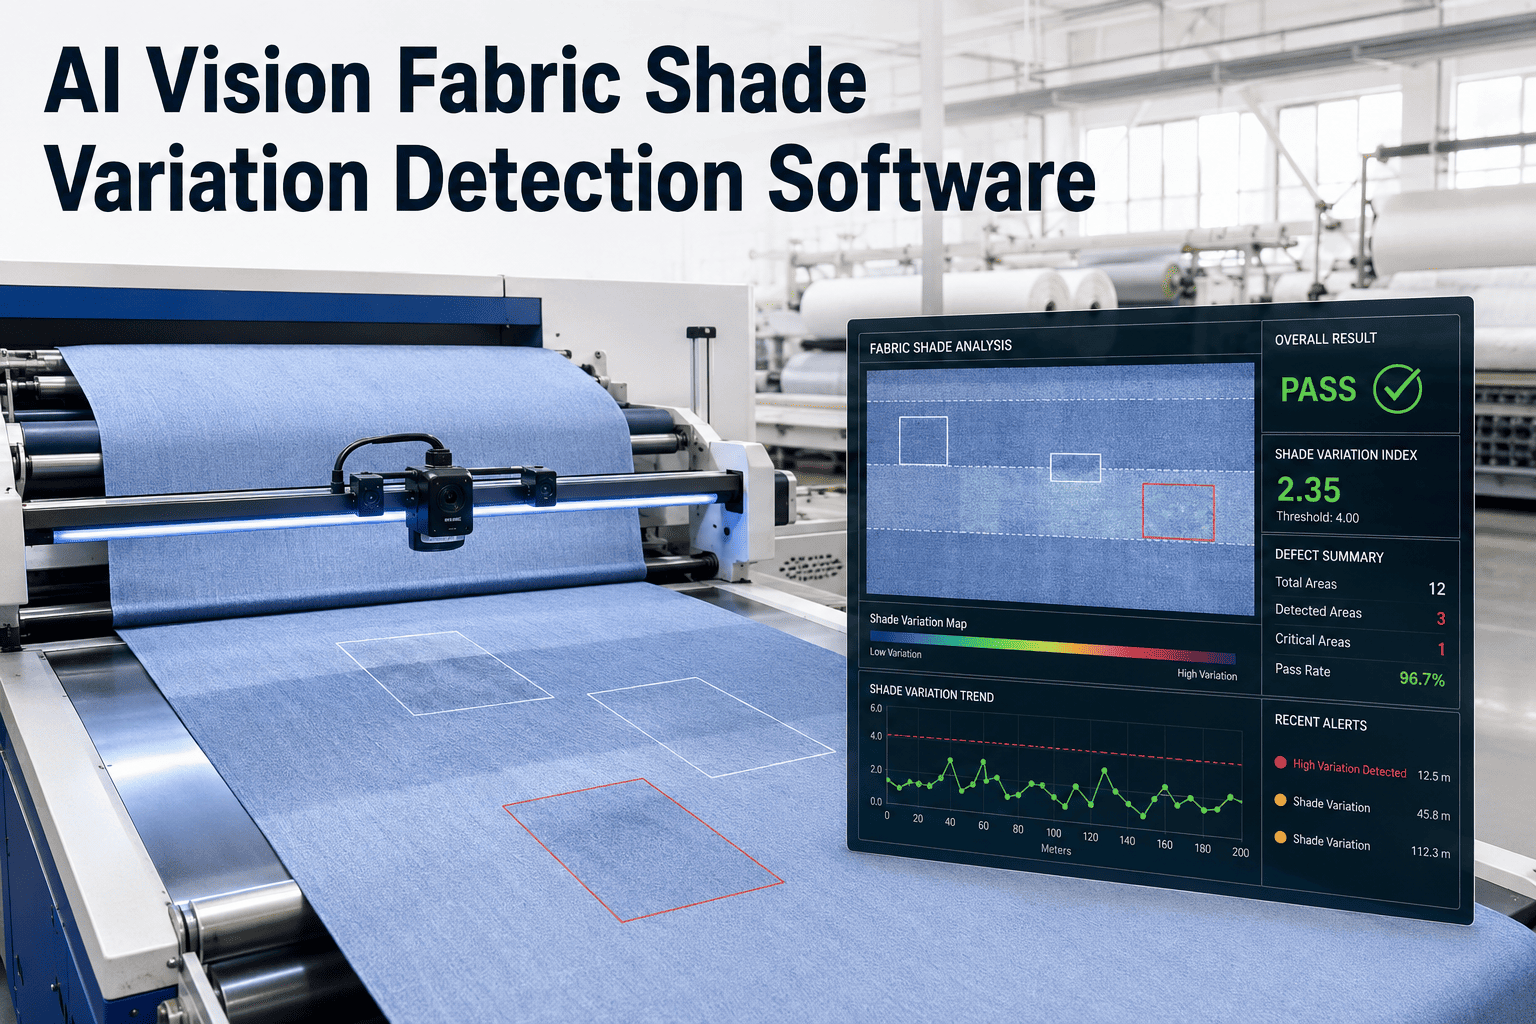
Batch-to-Batch Consistency Timeline

The timeline below shows Delta-E measurements across 12 consecutive batches of the same shade. Each point represents the Delta-E of a production batch measured against the approved reference. Batches within the 0.8 tolerance boundary are acceptable. Points above the boundary require correction.


0.31
0.42
0.22
0.92
0.35
0.48
1.82
0.18
0.38
0.85
0.27
0.55

Batch #1 #3 #5 #7 #9 #12
Pass (Delta-E ≤ 0.8) Marginal (0.8 – 1.5) Fail (> 1.5) Tolerance limit: Delta-E 0.8

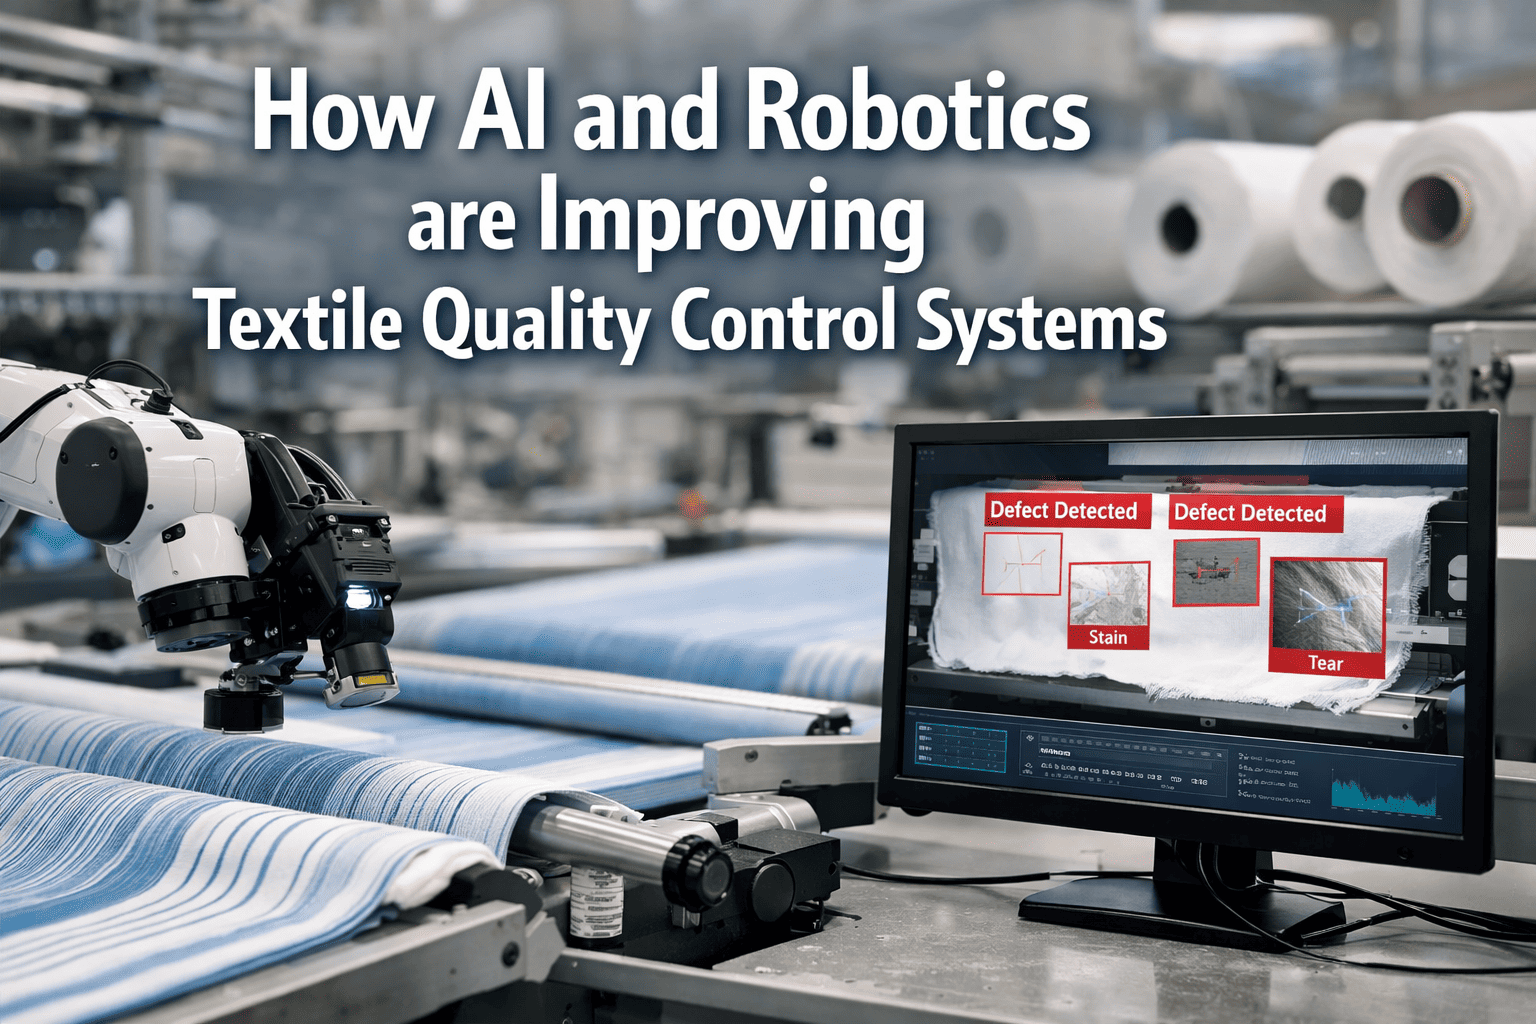
Color Inspection Method Comparison

Three methods are used for color inspection in textile mills. The table below compares human visual inspection, handheld spectrophotometer sampling, and AI inline vision monitoring across key capabilities.

Capability Human Visual Handheld Spectro. AI Inline Vision
Detection threshold Delta-E 1.5 – 2.0 Delta-E 0.1 Delta-E 0.05
Measurement location Inspection frame Lab or frame Inline at machine
Coverage Sample based Sample based 100% continuous
Measurement frequency Every roll Every 10th roll Every meter
Data recording Manual log Digital file Automatic database
Operator dependency High Medium None
Annual cost per line $28,000 $16,000 $9,500

Frequently Asked Questions

Delta-E is a single number that represents the magnitude of the color difference between two samples in the CIE L*a*b* color space. The L* value represents lightness from black to white, a* represents position on the green-to-red axis, and b* represents position on the blue-to-yellow axis. Delta-E combines the differences in all three dimensions into a single value that correlates with how different two colors appear to the human eye under standard lighting. Delta-E is the standard metric in textile color quality for two main reasons: it is instrument-independent, meaning a Delta-E measurement from any properly calibrated spectrophotometer should be reproducible across different labs, and it correlates with human perception, meaning a Delta-E of 1.0 represents approximately the smallest color difference that a trained human inspector can detect under optimal viewing conditions. AATCC Evaluation Procedure 9 defines the standard method for measuring Delta-E in textile applications using the CIE 1976 or CIE 2000 formula, with CIE 2000 being the preferred formula for fabrics with textured surfaces.
Lab spectrophotometer measurement requires cutting a fabric sample from the production roll, taking it to the laboratory, conditioning it under standard temperature and humidity for a minimum of 4 hours, measuring it with a benchtop spectrophotometer using D65 or TL84 illuminant with a 10-degree observer angle, and then entering the result into a quality record. This process takes 5 to 8 hours from sample collection to recorded measurement. During those hours, the dyeing machine may have produced 5,000 to 15,000 meters of fabric that is not yet measured. AI inline color monitoring uses a spectrophotometer sensor mounted directly at the exit of the dyeing range or stenter frame, measuring fabric color continuously at 10 to 50 readings per second as the fabric exits the machine. The AI system compares each measurement against the reference in real time, displays the current Delta-E on the operator screen, and generates an alert when the value exceeds the configured tolerance. The measurement is recorded automatically with the batch ID, machine number, date, time, and position across the fabric width, creating a complete color record for every meter of production.
Batch-to-batch shade variation has six main causes. Dye liquor concentration variation occurs when the automated dispensing system has calibration drift, causing one batch to receive 1 to 3 percent more or less dye than the previous batch. Substrate variation occurs when the fabric itself has different absorbency due to changes in mercerization, bleaching, or desizing between batches. Process parameter variation includes differences in dyeing temperature, ramp rate, hold time, liquor ratio, and pH that shift the final shade even when the dye formulation is identical. Water quality variation from changes in hardness, conductivity, or residual chemicals in the process water affects dye uptake. Dye batch variation means different production lots of the same dye can produce slightly different shades even at identical concentrations. Drying and finishing variation occurs because the final shade changes during drying, stentering, and finishing due to differences in temperature, tension, and chemical application. AI color monitoring detects all of these variations at the point of measurement and correlates Delta-E spikes with specific process parameters to identify root causes.
Yes. AI color monitoring systems are calibrated to the specific fabric construction and surface texture during a setup process that takes 30 to 60 seconds per style change. The calibration process measures the fabric at multiple points across the width and length to establish the baseline color and account for surface texture effects such as nap, pile, crepe, or textured yarns that cause directional light scattering. The system compensates for surface texture using a multi-angle measurement approach that captures spectral data at multiple illumination and detection angles, separating true color variation from texture-induced optical effects. The same system handles woven, knitted, and nonwoven fabrics, from lightweight voiles at 20 grams per square meter to heavyweight denims at 500 GSM, as well as terry, velvet, corduroy, and other textured constructions. Style change calibration runs automatically when the system reads the batch ID or barcode from the incoming fabric roll, eliminating operator intervention for color measurement setup between style changes.

Eliminate Shade Variation Across Every Batch

iFactory AI color monitoring delivers Delta-E below 0.8 on every batch, every shift, every day. Real-time inline measurement, automatic pass-fail determination, and full batch history for every dye lot. Deployed in 7 to 14 days.


Share This Story, Choose Your Platform!