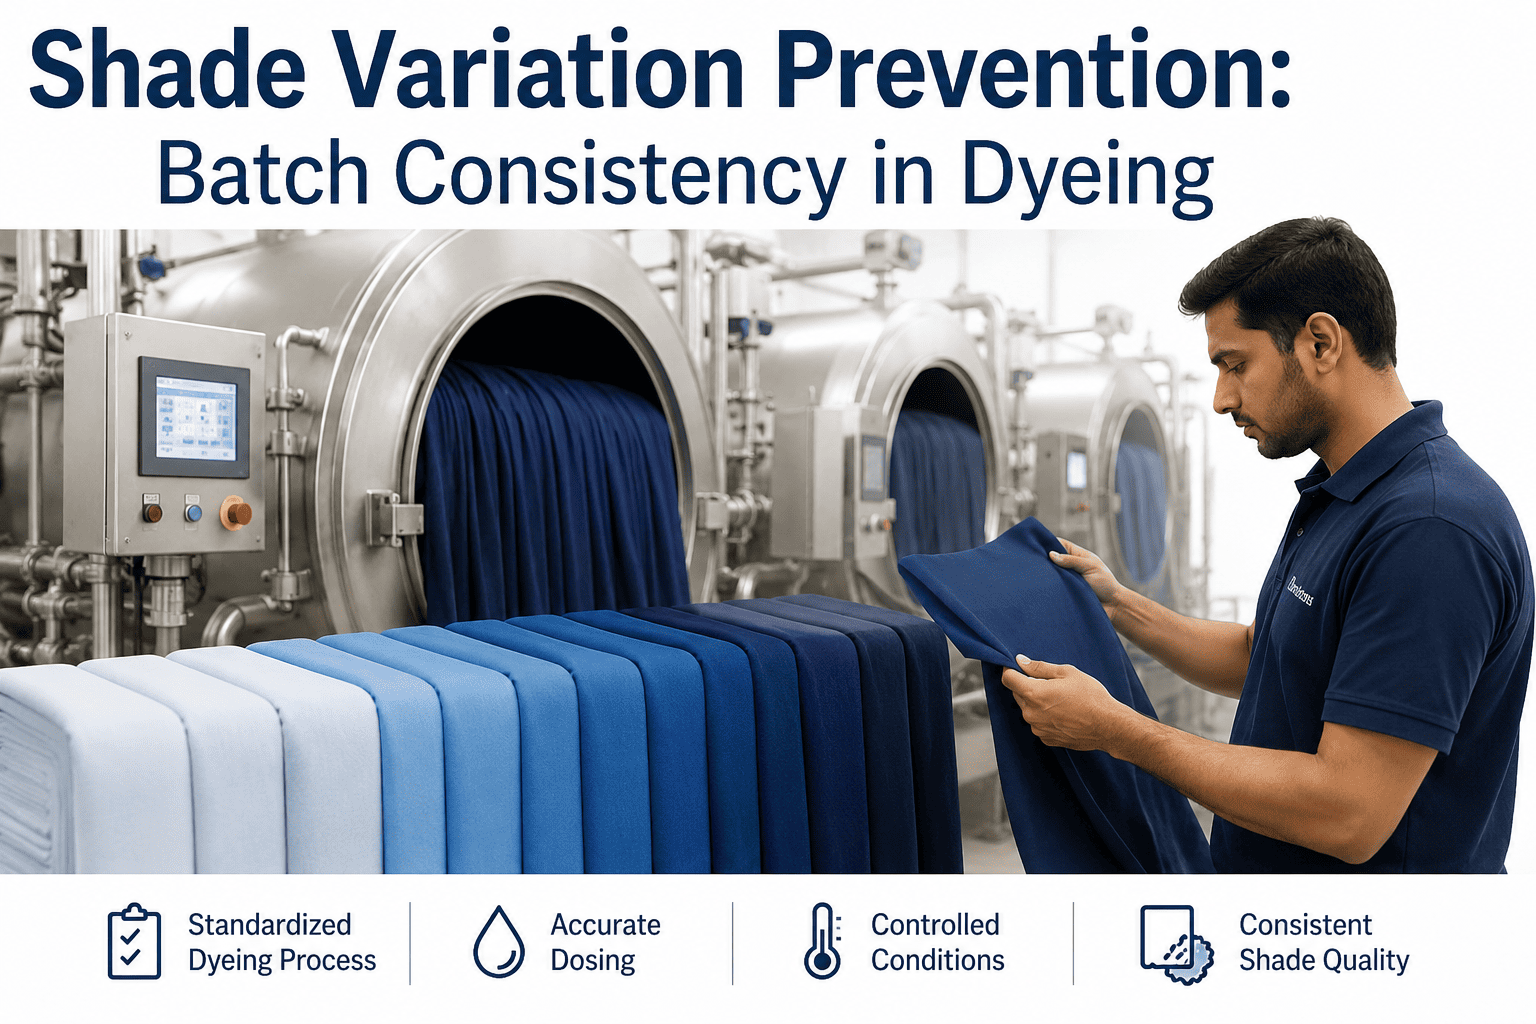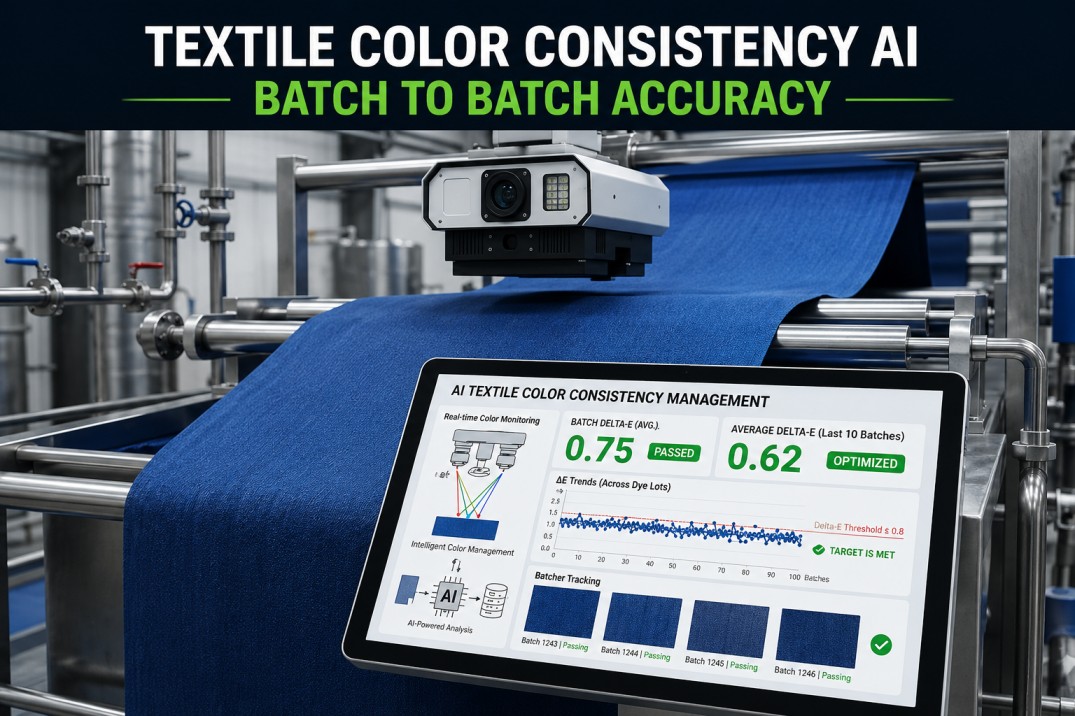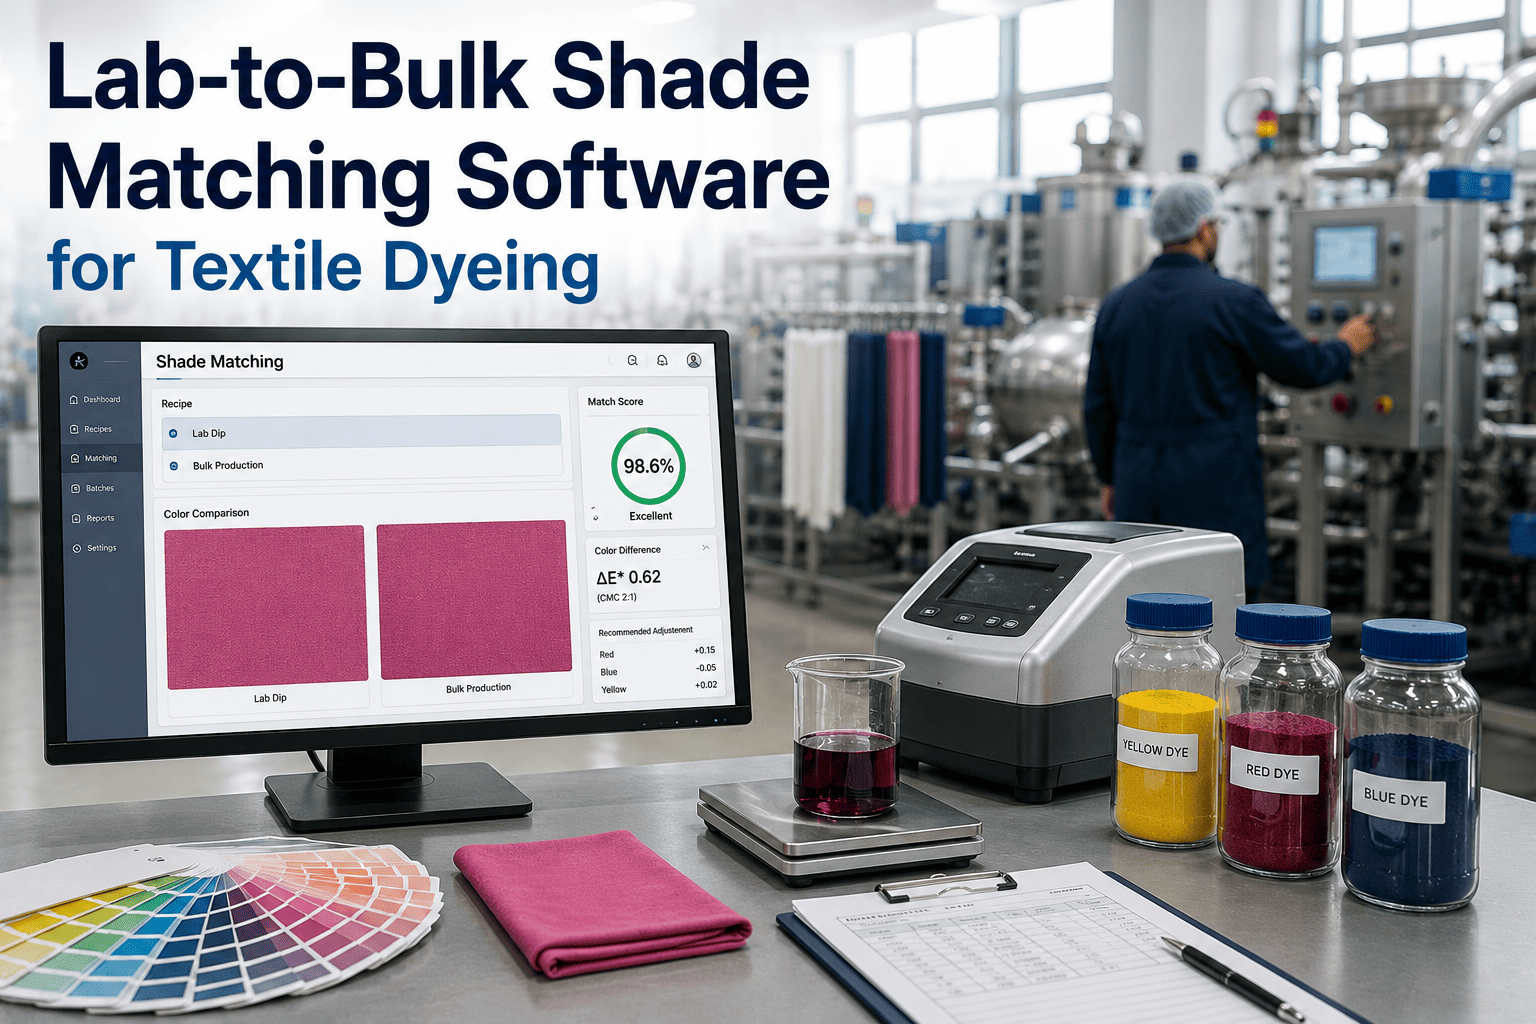
In the high-stakes world of textile manufacturing, color consistency across production runs is not merely a quality metric—it is the bedrock of brand reputation and operational profitability. The transition from laboratory-scale dyeing to bulk production introduces a cascade of variables—water quality, fabric preparation, chemical purity, machine dynamics, and environmental conditions—that can shift the final shade by several Delta E units. Traditional manual adjustments rely on the intuition of experienced dyers, but this approach is inherently inconsistent and difficult to scale. Modern textile shade matching software, integrated with spectrophotometer data and real-time analytics, enables manufacturers to predict, simulate, and correct color deviations before a single meter of fabric is produced. This comprehensive guide explores the technical architecture, data integration strategies, and operational workflows that define best-in-class lab-to-bulk shade matching systems, providing plant managers and quality directors with a roadmap to achieve right-first-time dyeing and eliminate costly re-dyes. For a personalized demonstration of how iFactory's AI Quality Analytics can transform your color management process, Book a Demo with our experts today.
Achieve 99% Right-First-Time Dyeing with AI-Powered Shade Matching
Eliminate re-dyes, reduce waste, and ensure consistent color across every batch. Transform your lab-to-bulk process today.
The Delta E Challenge in Bulk Production
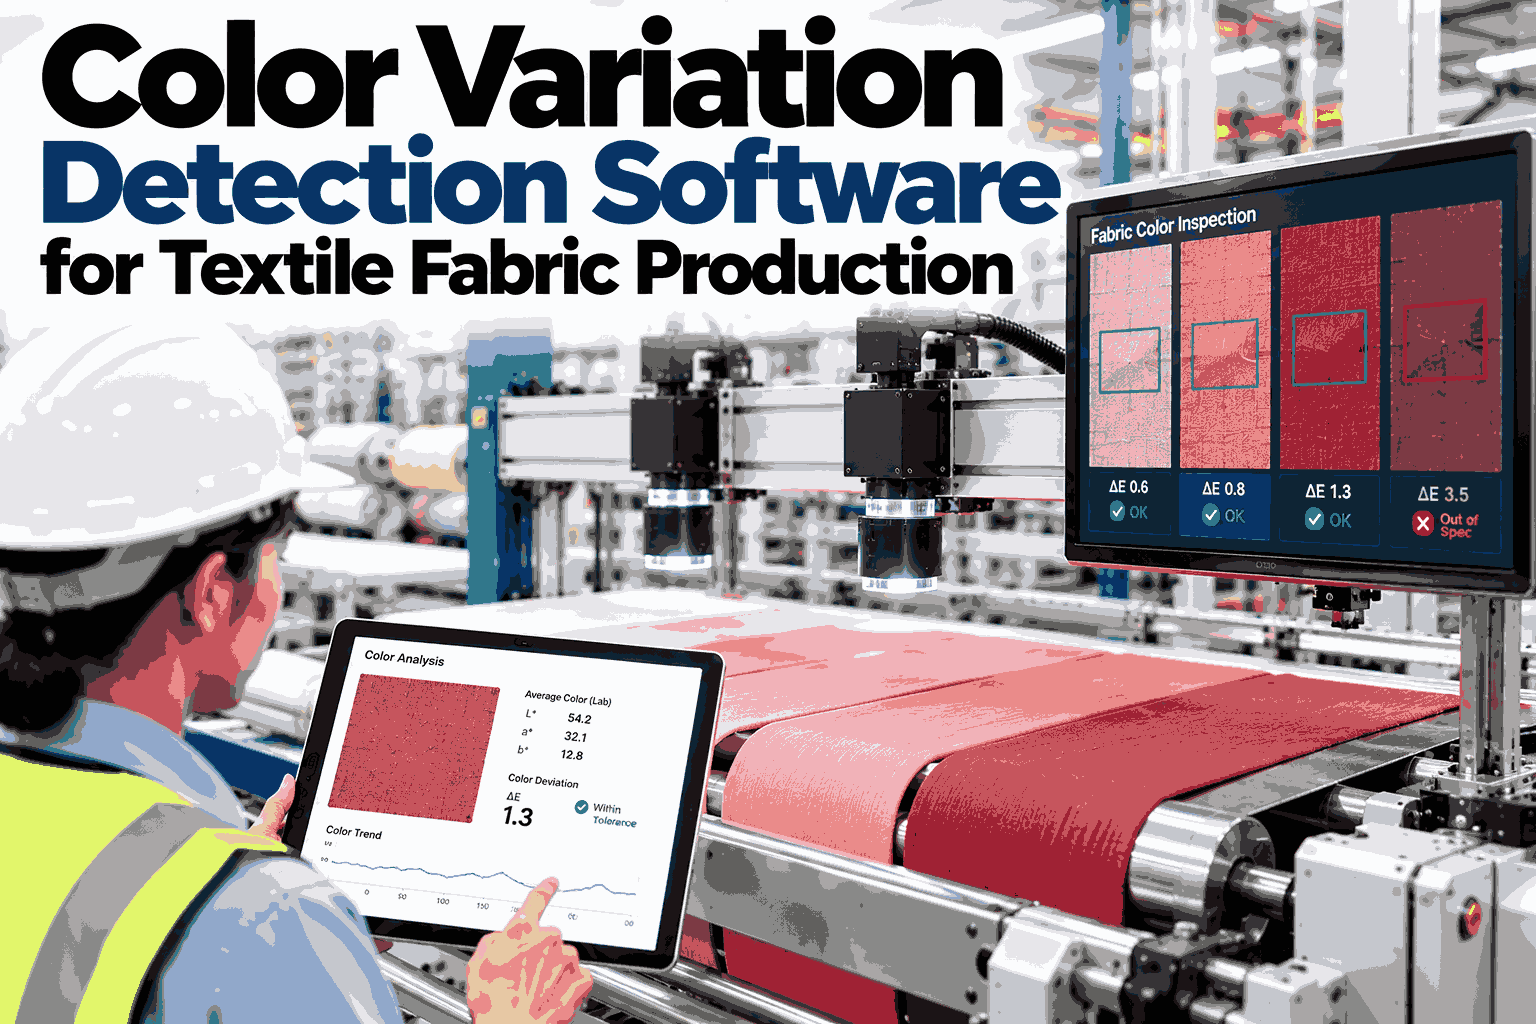
Color measurement in textiles relies on the CIELAB color space, where Delta E quantifies the perceptual difference between a standard and a sample. A Delta E of less than 1.0 is generally considered imperceptible to the human eye, but in bulk dyeing, variations of 2.0 or higher are common due to factors like dye uptake rates, temperature gradients, and fabric tension. Spectrophotometer integration captures these deviations in real time, but without a software layer that correlates lab recipes to bulk parameters, the data remains siloed. Advanced shade matching software uses multivariate regression models to predict how changes in dye concentration, pH, and time will affect the final color, enabling proactive adjustments that keep Delta E within tolerance.
Spectrophotometer Data Integration
Modern spectrophotometers generate spectral reflectance curves at 10nm or 20nm intervals across the visible spectrum. Integrating this data into a centralized dyeing recipe software platform allows for historical analysis of dye lots, identification of drift patterns, and automatic recalibration of color formulas. The software must support multiple spectrophotometer brands (e.g., Datacolor, X-Rite, Konica Minolta) and standardize the data into a single format for comparison. Real-time data feeds from the dyeing machines—temperature, pressure, flow rate—are combined with spectral data to create a comprehensive digital twin of the dyeing process, enabling predictive corrections before the batch is complete.
Key Features of Lab-to-Bulk Shade Matching Software
| Feature | Description | Business Impact |
|---|---|---|
| Recipe Optimization Engine | Uses historical lab and bulk data to suggest dye concentrations that minimize Delta E. | Reduces trial-and-error in lab, saving 30% of recipe development time. |
| Real-Time Spectrophotometer Integration | Connects to inline or offline spectrophotometers for continuous shade monitoring. | Enables immediate correction during dyeing, reducing re-dye rates by 50%. |
| Bulk Parameter Correlation | Analyzes how machine settings (temperature, time, liquor ratio) affect color. | Improves first-time pass rates from 70% to 95%. |
| Color Tolerance Management | Defines pass/fail criteria based on Delta E, CMC, or CIE94 formulas. | Ensures consistent quality across multiple production sites. |
| Batch History & Traceability | Stores all recipe, parameter, and measurement data for each batch. | Simplifies audits and root cause analysis for color failures. |
| Automated Correction Suggestions | Based on deviation analysis, recommends dye or chemical additions. | Empowers less experienced dyers to make expert-level corrections. |
Workflow: From Lab Recipe to Bulk Production
Lab Recipe Creation
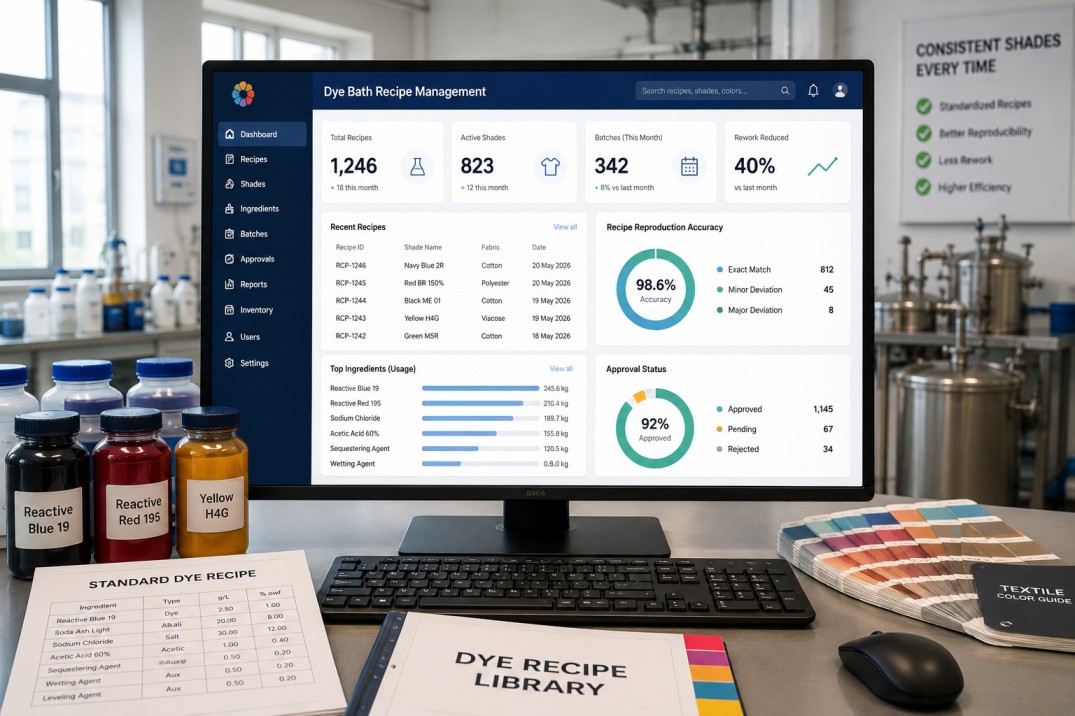
Dyeing lab software captures the precise concentrations of dyes, auxiliaries, and water used in the lab trial. The spectrophotometer measures the resulting shade, and the software calculates the Delta E from the target standard. If the Delta E exceeds the tolerance, the software suggests adjustments to the recipe, which the dyer can accept or modify. The final approved recipe is stored in a central database with all associated metadata.
Bulk Recipe Scaling
The lab recipe is scaled up to the bulk batch size using algorithms that account for differences in liquor ratio, fabric weight, and machine type. The software applies correction factors derived from historical data—for example, if a 10% increase in dye concentration in the lab consistently results in a 12% increase in bulk, the software adjusts accordingly. The scaled recipe is sent directly to the dosing system.
Real-Time Monitoring & Correction
During dyeing, the spectrophotometer (inline or offline) measures the fabric at predefined intervals. The software compares the real-time shade to the target and calculates the deviation. If the Delta E exceeds a threshold, the software recommends a corrective addition of dye or chemical, which the operator can approve. This closed-loop control minimizes end-of-batch corrections.
Final Quality Check & Data Logging
After dyeing, the final shade is measured and logged. The software generates a quality report including Delta E, spectral curves, and process parameters. This data is used to refine the prediction models for future batches, creating a continuous improvement cycle. All data is stored for traceability and compliance with customer specifications.
50%
Reduction in Re-Dye Rates
95%
First-Time Pass Rate
30%
Faster Recipe Development
20%
Less Chemical Waste
Data-Driven Dyeing Decisions
Shade consistency analytics transform raw spectrophotometer and machine data into actionable insights. Dashboards display real-time Delta E trends, batch-to-batch variability, and root cause analysis for color drift. Plant managers can identify which dyes or machines are causing the most variation and take targeted corrective actions.
Integration with ERP & MES
Textile color management software must integrate seamlessly with existing ERP and MES systems. Recipe data flows from the lab to production orders, and quality results update inventory status. This integration eliminates manual data entry errors and provides a single source of truth for color performance across the enterprise.
Predictive Analytics for Shade Consistency
Machine learning models trained on historical data can predict the final shade of a batch before it completes. By analyzing patterns in dye uptake, temperature profiles, and chemical interactions, the software alerts operators to potential deviations early in the process, allowing for preventive adjustments that ensure right-first-time output.
Technical Architecture of a Modern Shade Matching System
A robust lab-to-bulk shade matching system comprises several interconnected modules: a recipe management database, a spectrophotometer data acquisition layer, a real-time monitoring engine, a correction algorithm, and a reporting dashboard. The database stores all recipes, batch records, and spectral data in a structured format that supports complex queries for trend analysis. The data acquisition layer uses standard communication protocols (e.g., OPC-UA, MODBUS) to read from spectrophotometers and dyeing machines, ensuring low-latency data flow. The correction algorithm employs a combination of physics-based models and machine learning—physics models account for dye-fiber chemistry, while ML models learn from historical corrections to improve accuracy over time. The dashboard provides role-specific views: dyers see real-time batch status, quality managers see trend reports, and executives see overall equipment effectiveness (OEE) metrics related to color performance.
Physics-Based Color Prediction
The Kubelka-Munk theory is the foundation of many color prediction models. It relates the concentration of dyes to the reflectance of the fabric, allowing the software to calculate the required dye amounts for a target shade. Modern implementations extend this theory with corrections for fluorescence, optical brighteners, and non-linear dye-fiber interactions. These models are calibrated using a set of standard dyeings and updated as new data becomes available.
Machine Learning for Anomaly Detection
While physics models handle the majority of predictions, machine learning excels at detecting anomalies that fall outside the model's assumptions. Algorithms such as random forest or gradient boosting can identify subtle patterns in process data that precede color failures—for example, a slight increase in pH variability that correlates with higher Delta E. By flagging these anomalies in real time, the software enables proactive intervention.
Implementation Roadmap for Textile Manufacturers
- Phase 1: Assessment & Data Audit – Evaluate current lab and bulk processes, identify data gaps, and select spectrophotometer integration points.
- Phase 2: Software Deployment & Calibration – Install the shade matching software, connect to existing equipment, and calibrate prediction models using historical data.
- Phase 3: Pilot Run & Validation – Test the system on a subset of recipes and compare results to manual methods. Adjust model parameters based on initial outcomes.
- Phase 4: Full Rollout & Training – Deploy across all production lines, train operators and quality staff, and establish standard operating procedures for using the software.
- Phase 5: Continuous Improvement – Monitor system performance, update models with new data, and refine correction algorithms to improve accuracy over time.
Common Pitfalls & How to Avoid Them
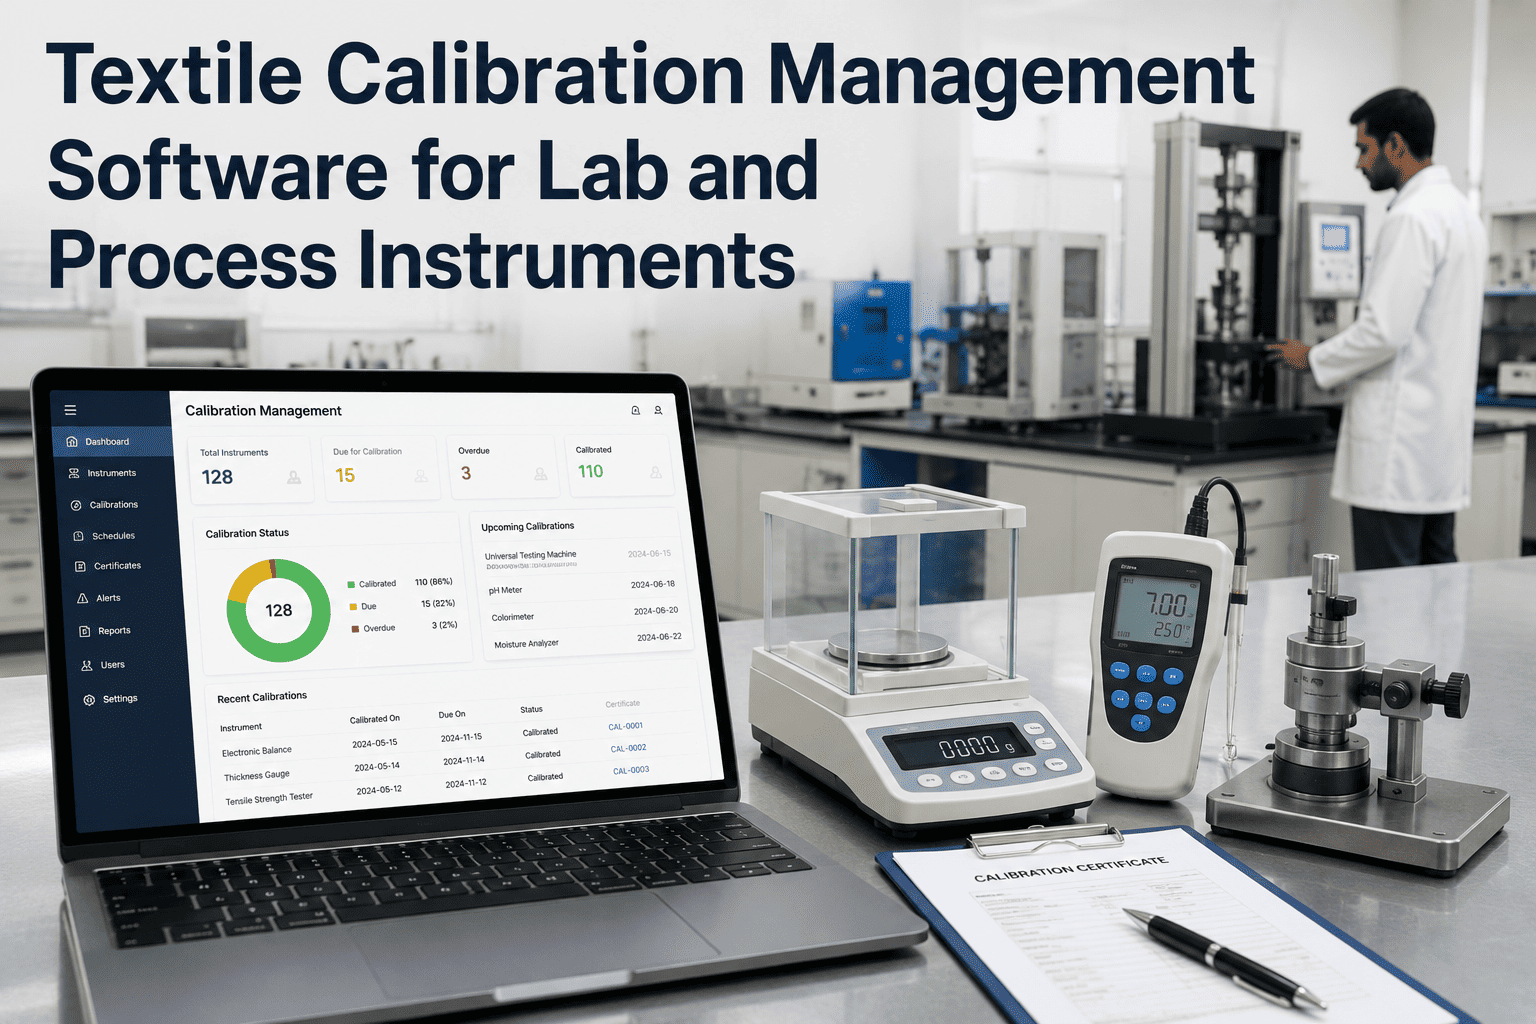
One of the most frequent mistakes is relying solely on lab data without incorporating bulk process variability. The models must be trained on both lab and bulk data to be effective. Another pitfall is neglecting regular maintenance of spectrophotometers—dirty optics or calibration drift can introduce systematic errors. Finally, change management is critical; dyers may resist trusting software recommendations if they have relied on intuition for years. Proper training and demonstrating early wins can overcome this resistance.
Cost-Benefit Analysis of Shade Matching Software
The initial investment in software, integration, and training can range from $50,000 to $200,000 depending on factory size and complexity. However, the return on investment is typically realized within 6-12 months through reduced re-dye costs, lower chemical consumption, and increased production throughput. A mid-sized textile mill processing 10,000 kg of fabric per day can save over $500,000 annually by reducing re-dye rates from 15% to 5%.
Case Study: Implementation at a Leading Denim Manufacturer
A global denim producer implemented iFactory's AI Quality Analytics for shade matching across five plants. Within three months, the first-time pass rate increased from 72% to 94%, and re-dye costs dropped by 60%. The system integrated with existing Datacolor spectrophotometers and automated the recipe adjustment process, reducing the time to correct a shade deviation from 45 minutes to under 5 minutes. The manufacturer now uses the system to maintain consistent color across different fabric weights and finishes.
Transform Your Color Management with AI
Stop fighting shade variations. iFactory's software gives you the tools to predict, correct, and perfect color every time.
Regulatory Compliance & Sustainability
Textile dyeing is subject to stringent environmental regulations regarding wastewater discharge and chemical usage. Shade matching software helps reduce chemical waste by minimizing re-dyes and optimizing dye concentrations. Additionally, many brands now require suppliers to provide color consistency data as part of their sustainability audits. A digital system provides transparent, auditable records that demonstrate compliance with standards such as OEKO-TEX and GOTS.
Future Trends: AI & IoT in Color Management
The next generation of shade matching systems will leverage IoT sensors on dyeing machines to capture even more granular data—fabric tension, dye bath circulation patterns, and even real-time chemical composition via near-infrared spectroscopy. AI models will become increasingly autonomous, capable of making corrections without human intervention. The ultimate goal is a fully closed-loop dyeing process where the software continuously optimizes parameters to maintain perfect color with zero waste.
Frequently Asked Questions
How does lab-to-bulk shade matching software handle different fabric types?
The software uses fabric-specific calibration curves that account for differences in fiber chemistry, weave structure, and surface finish. For example, cotton and polyester have different dye uptake rates, so the software maintains separate models for each fiber type. When a new fabric is introduced, the system can be quickly calibrated using a set of standard dyeings. The calibration process involves dyeing a range of concentrations for each dye, measuring the resulting shades, and fitting the Kubelka-Munk model parameters. Once calibrated, the software can accurately predict the dye amounts needed for any shade on that fabric. For more details on integration, visit iFactory Support.
What is the typical implementation timeline for a shade matching system?
A typical implementation takes 8 to 12 weeks from project kickoff to full operational use. The timeline includes a 2-week assessment phase where the current processes and data sources are evaluated, followed by a 4-week deployment phase where the software is installed and integrated with spectrophotometers and dyeing machines. A 2-week pilot run validates the system on a subset of recipes, and the final 4 weeks are dedicated to training and full rollout. Factors that can extend the timeline include the number of machines to integrate, the availability of historical data for model calibration, and the need for customizations to existing ERP systems. To discuss your specific timeline, Book a Demo.
Can the software work with any brand of spectrophotometer?
Yes, the software is designed to be spectrophotometer-agnostic. It supports data import from all major brands including Datacolor, X-Rite, Konica Minolta, and HunterLab. The data acquisition layer uses a standardized API that can be configured to read from any spectrophotometer that outputs spectral data in a common format such as CSV, XML, or direct TCP/IP connection. For older models without digital output, the software can accept manual entry of L*a*b* values. The system also supports inline spectrophotometers that are mounted directly on the dyeing machine for real-time monitoring. If you have a specific spectrophotometer model, check compatibility with our team via iFactory Support.
How does the software handle corrections during an active dyeing batch?
The real-time monitoring engine continuously compares the current shade to the target. If the Delta E exceeds a predefined threshold (e.g., 0.5), the software calculates a corrective addition of dye or chemical based on the deviation and the current bath volume. The recommendation is displayed to the operator on the dashboard, along with the expected impact on the final shade. The operator can approve the correction, which is then sent automatically to the dosing system. The software also logs the correction for future analysis. This closed-loop control ensures that corrections are made early, preventing major deviations at the end of the batch. For a live demonstration of this feature, Book a Demo.
What kind of training is required for operators to use the system?
Operators typically require 2 to 3 days of hands-on training to become proficient with the software. The training covers basic navigation, interpreting spectral data, understanding correction recommendations, and using the dashboard for batch monitoring. No prior experience with color science is required, as the software provides intuitive visualizations and clear guidance. Advanced training for quality managers and process engineers covers model calibration, trend analysis, and system administration. iFactory provides on-site training as part of the implementation package, along with access to a comprehensive knowledge base and video tutorials. Ongoing support is available through iFactory Support.
Ready to Achieve Perfect Shade Consistency?
Join leading textile manufacturers who have transformed their dyeing operations with iFactory. Book your demo today.