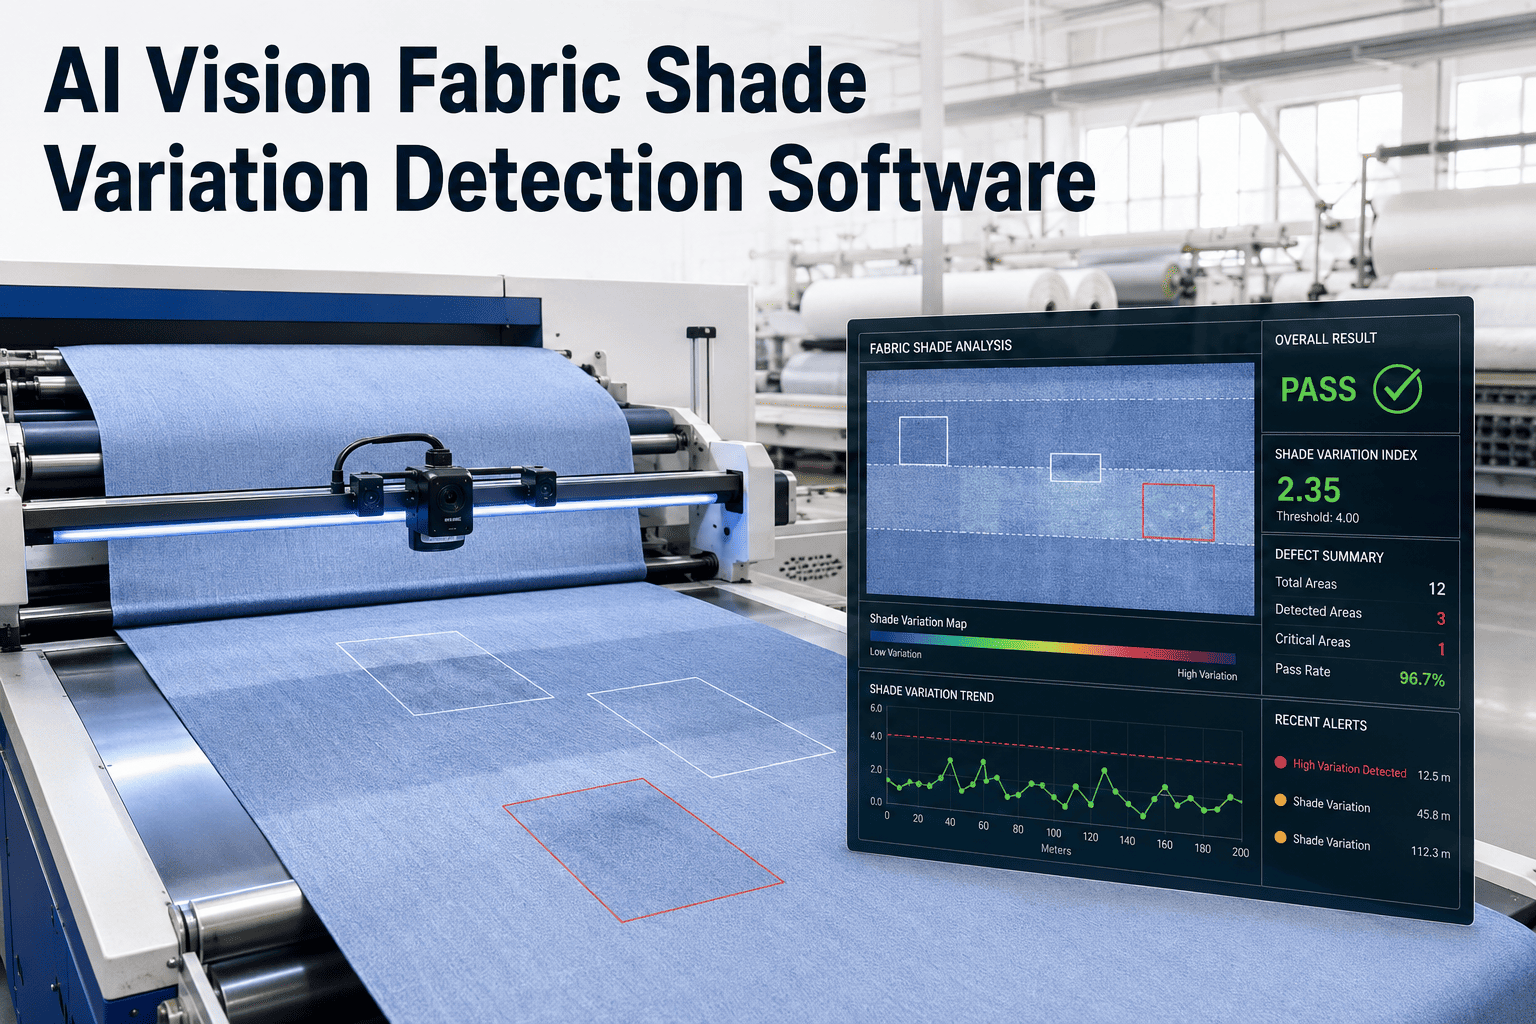
A shade difference that nobody sees on the dye house floor can become a rejected shipment once two panels sit side by side on a garment. Colour variation hides between batches, across the width and along the length of a single roll. Eyes adapt, lighting changes through the day, and memory is a poor reference. Measured colour data gives every roll the same standard to be judged against. Textile teams can watch colour variation detection on sample fabric and compare it with how they judge shade today.
AI VISION AND QUALITY FOR TEXTILE PRODUCTION
Catch Shade Drift Before It Reaches the Cutting Table
iFactory AI measures colour across the whole fabric, flags drift from your reference shade, and links every roll to its dye lot.
Reference shadeWithin toleranceDrifting out
FOUR WAYS SHADE VARIES
Where Colour Variation Shows Up in Fabric
Each pattern points to a different cause, so naming the pattern is half the diagnosis.
Side to side
One edge differs from the other, often from uneven dye flow or squeezing.
End to end
Shade shifts along the roll as the bath or process conditions change.
Centre to selvedge
Edges run darker or lighter than the middle, a pattern called listing.
Batch to batch
Two lots of the same colour fail to match once sewn together.
MEASURING DIFFERENCE
Reading the Delta E Scale
Delta E expresses colour difference as a single number. Smaller means closer to the reference.
0 to 1
Not noticeable to most viewers
1 to 2
Seen only on close inspection
2 to 10
Noticeable at a glance
Above 10
Clearly a different colour
Acceptable limits depend on the buyer and the colour. Dark and pale shades often need different tolerances.
See how your dye lots measure up
Share a few rolls from different lots and review their colour difference against your reference shade.
WHY EYES MISS IT
Three Reasons Visual Shade Checks Fall Short
ALighting changes the colour
Two fabrics can match under one light and split apart under another, a effect known as metamerism.
BEyes adapt and tire
After long viewing, small differences fade from perception.
CSamples are spot checks
A swatch from one end says little about the metres in between.
DECISION RULES
From Measurement to Accept, Review or Reject
Clear bands turn a colour reading into a fast, repeatable decision.
Accept
Difference sits inside the agreed tolerance. The roll moves on.
Review
Difference is near the limit. A supervisor checks the colour map.
Reject or re-dye
Difference exceeds the limit. The lot is held and its cause traced.
TRACEABILITY
Linking Every Roll Back to Its Dye Lot
When colour data travels with the roll, a complaint can be traced in minutes.
Dye lot and recipe record
Rolls from the lot with colour readings
Cut panels grouped by matching shade
Finished garments with a shade history
CHOOSING A METHOD
Three Ways to Check Shade Compared
| Factor | Visual Check | Handheld Spectrophotometer | Inline Vision |
|---|
| Coverage | Samples by eye | Single spots only | Whole width, continuous |
| Objectivity | Varies by person | Numeric and repeatable | Numeric and repeatable |
| Speed | Quick but subjective | Slow across a full roll | Runs with the fabric |
| Record | Notes or memory | Spot readings | Colour map per roll |
FREQUENTLY ASKED QUESTIONS
Questions Dyeing and Quality Teams Ask
Does it work on dark, pale and printed fabrics?
Yes, but each type is handled with its own tolerance and lighting setup, since pale shades and prints behave differently from dark solids. Models are calibrated on your own fabrics. A
short demo conversation can cover your range.
Can it replace our spectrophotometer?
Many mills keep the spectrophotometer for recipe matching and lab work, while inline vision monitors the production fabric continuously. They complement each other.
Our support specialists can advise how the two fit together.
How is the reference shade set?
The reference is taken from an approved standard or lab dip and stored with its tolerance. Each new roll is compared against that stored standard.
Ask in a demo session how reference shades are managed.
Will it find streaks and patches too?
Yes, the same vision data highlights streaks, patches and bands, not just an average shade difference. These show up on a colour map of the roll.
Contact our support team to see how maps are displayed.
How does it help with buyer complaints?
Stored colour readings per roll and lot let you show what was measured before shipping and trace which lot is affected. That shortens investigations. You can
plan a traceability walkthrough with our team.
MATCH THE SHADE, EVERY LOT
Give Your Mill a Colour Standard That Never Blinks
iFactory AI brings continuous colour measurement, tolerance decisions and lot traceability into one connected quality view for textile fabric production.