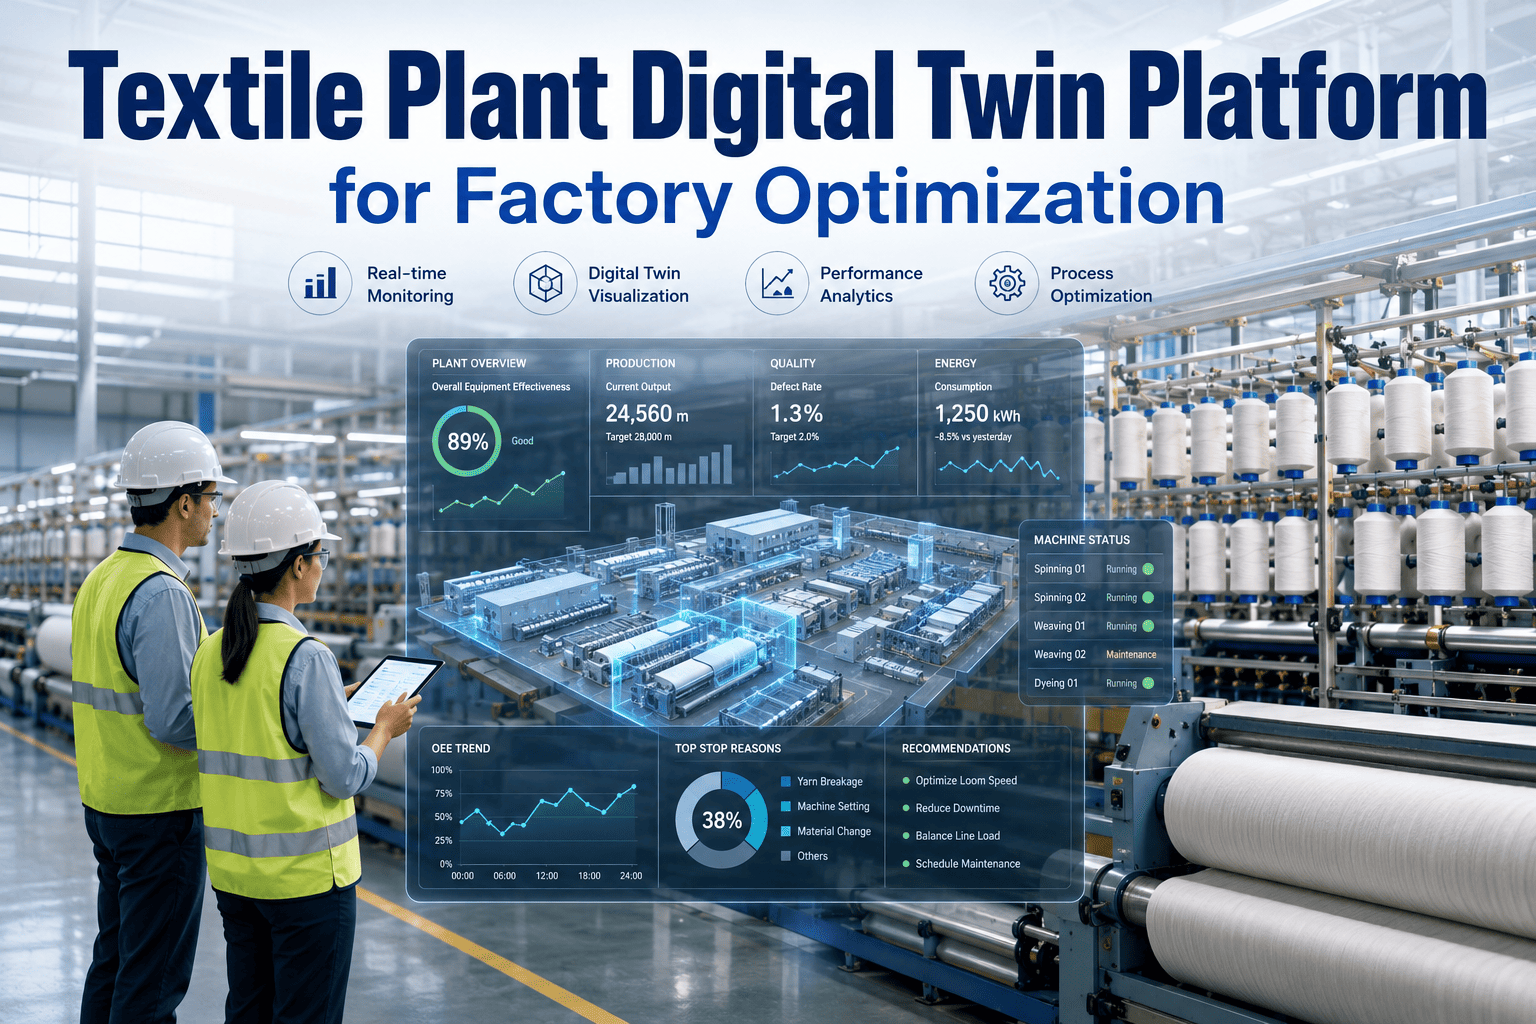
Textile machines don't just break — they signal. A subtle vibration here, a slight temperature spike there, a gradual dip in output. Preventive maintenance is the discipline of listening to those signals before they become stoppages. 88% of manufacturing companies already use preventive maintenance as their primary strategy — yet most still run it on gut feel and paper schedules. The factories pulling ahead are the ones running it on data. Book a free demo to see how iFactory brings structure to your maintenance programme.
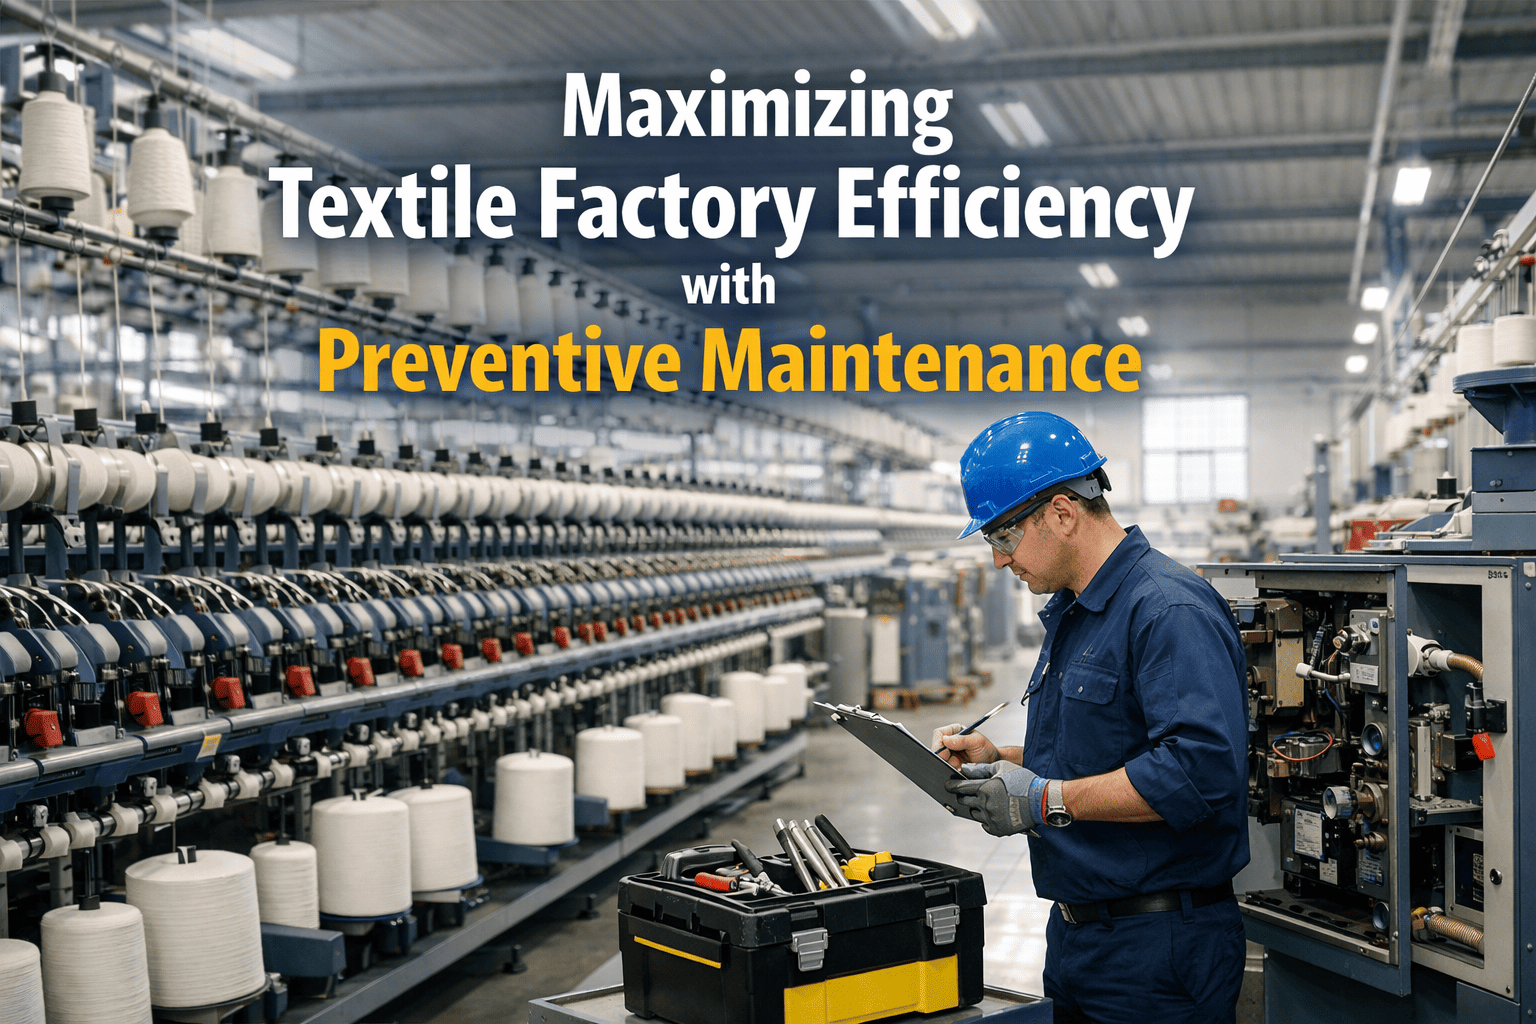
Preventive Maintenance:
The Strategy That Keeps Textile Factories Running.
Mills that shift from reactive to preventive maintenance report up to 45% less downtime, 25% lower maintenance costs, and machines that last twice as long. The data is clear — and the factories acting on it are winning orders.
Why Textile Factories Can't Afford to Wait for Machines to Break
The average textile mill runs on thin margins and tight delivery windows. One unexpected machine failure at peak season doesn't just cost a repair bill — it costs customer trust, late delivery penalties, and rushed overtime that erodes the entire order margin.
of unplanned downtime
4 Hours
Average duration of a single unplanned equipment outage in manufacturing
34%
Of unplanned failures caused by ageing equipment — the primary trigger in textile mills
3–5×
Higher cost for emergency reactive repairs vs planned preventive maintenance work
81 Min
Mean time to repair has climbed from 49 to 81 minutes — driven by skills gaps and parts delays
The 3 Maintenance Strategies — And Where Most Mills Get Stuck
Not all maintenance is equal. Understanding where your factory sits on this spectrum is the first step to knowing where the biggest gains are hiding.
Reactive Maintenance
Run it until it breaks, then fix it. Zero planning. Maximum disruption. Repair costs 3–5× higher. Buyers notice the delivery delays.
Preventive Maintenance
Scheduled servicing based on time or usage intervals. Machines serviced before failure, not after. 20–50% lower maintenance costs. The standard for competitive mills.
Data-Driven Preventive + Predictive
Scheduled maintenance enhanced with live performance data. Maintenance triggered by actual machine condition — not just a calendar. Up to 50% downtime reduction. Best-in-class OEE.
6 Pillars of an Effective Preventive Maintenance Programme
A real preventive maintenance strategy for a textile mill is not a spreadsheet of service dates. It is a living system built on six interconnected disciplines that compound in value over time.
Scheduled Service Intervals
Every machine gets a defined service schedule — lubrication, belt checks, filter changes — tied to production hours or calendar intervals, not operator memory.
Machine History Logs
Every service action, part replaced, and technician note is recorded against the machine — building the institutional knowledge that outlasts any individual worker.
Quality-Linked Checks
In-process quality metrics — yarn breakage rate, weave defect frequency, dye consistency — are monitored as machine health indicators, not just production outcomes.
Spare Parts Planning
Robust inventory management reduces emergency procurement costs by up to 15%. Critical parts are available before the service window — not ordered in crisis.
Output Performance Tracking
Shift-by-shift output tracking per machine surfaces efficiency drops before they cause failures. A machine producing 12% below target is signalling — not just underperforming.
Technician Accountability
Named work orders, timestamped completions, and digital sign-offs replace verbal confirmations — creating a verifiable maintenance chain that holds every action accountable.
What Preventive Maintenance Actually Returns
The ROI case for preventive maintenance is not theoretical. These are verified outcomes reported across manufacturing sectors — with direct parallels in textile production.
Ready to move from paper schedules to a live maintenance system?
iFactory gives textile mills the work order management, machine history, and output tracking that turns a good maintenance strategy into a measurable competitive advantage.
A Preventive Maintenance Calendar Built for Textile Mills
Different machines and components require different maintenance frequencies. This framework is based on standard textile industry maintenance cycles — adapt intervals to your specific equipment age and running hours.
How iFactory Operationalises Your Maintenance Strategy
iFactory doesn't just store your maintenance data — it connects machine performance, production output, and quality outcomes into a single operational picture that makes preventive maintenance proactive rather than paperwork.
Digital Work Orders
Create, assign, and track maintenance tasks digitally — with technician sign-offs, timestamps, and parts used recorded in one place per machine.
Shift-Level Output Tracking
Track production output per machine per shift. Efficiency dips become visible immediately — not at the end of the week when the damage is already done.
Quality-to-Machine Linking
When a defect is flagged at a quality checkpoint, it's linked to the specific machine and shift — giving your maintenance team the evidence to act on the right asset.
Automated Maintenance Reports
Maintenance completion rates, downtime events, and machine-level OEE reports generated automatically — ready for internal review, buyer audits, and certification bodies.
Frequently Asked Questions
The questions textile mill managers ask most when building or improving a preventive maintenance programme — answered with factory-floor practicality.
Your Machines Are Telling You
Something. Are You Listening?
iFactory gives textile factories the digital infrastructure to run a real preventive maintenance programme — with machine-level data, digital work orders, and automated reports that prove it to your buyers.