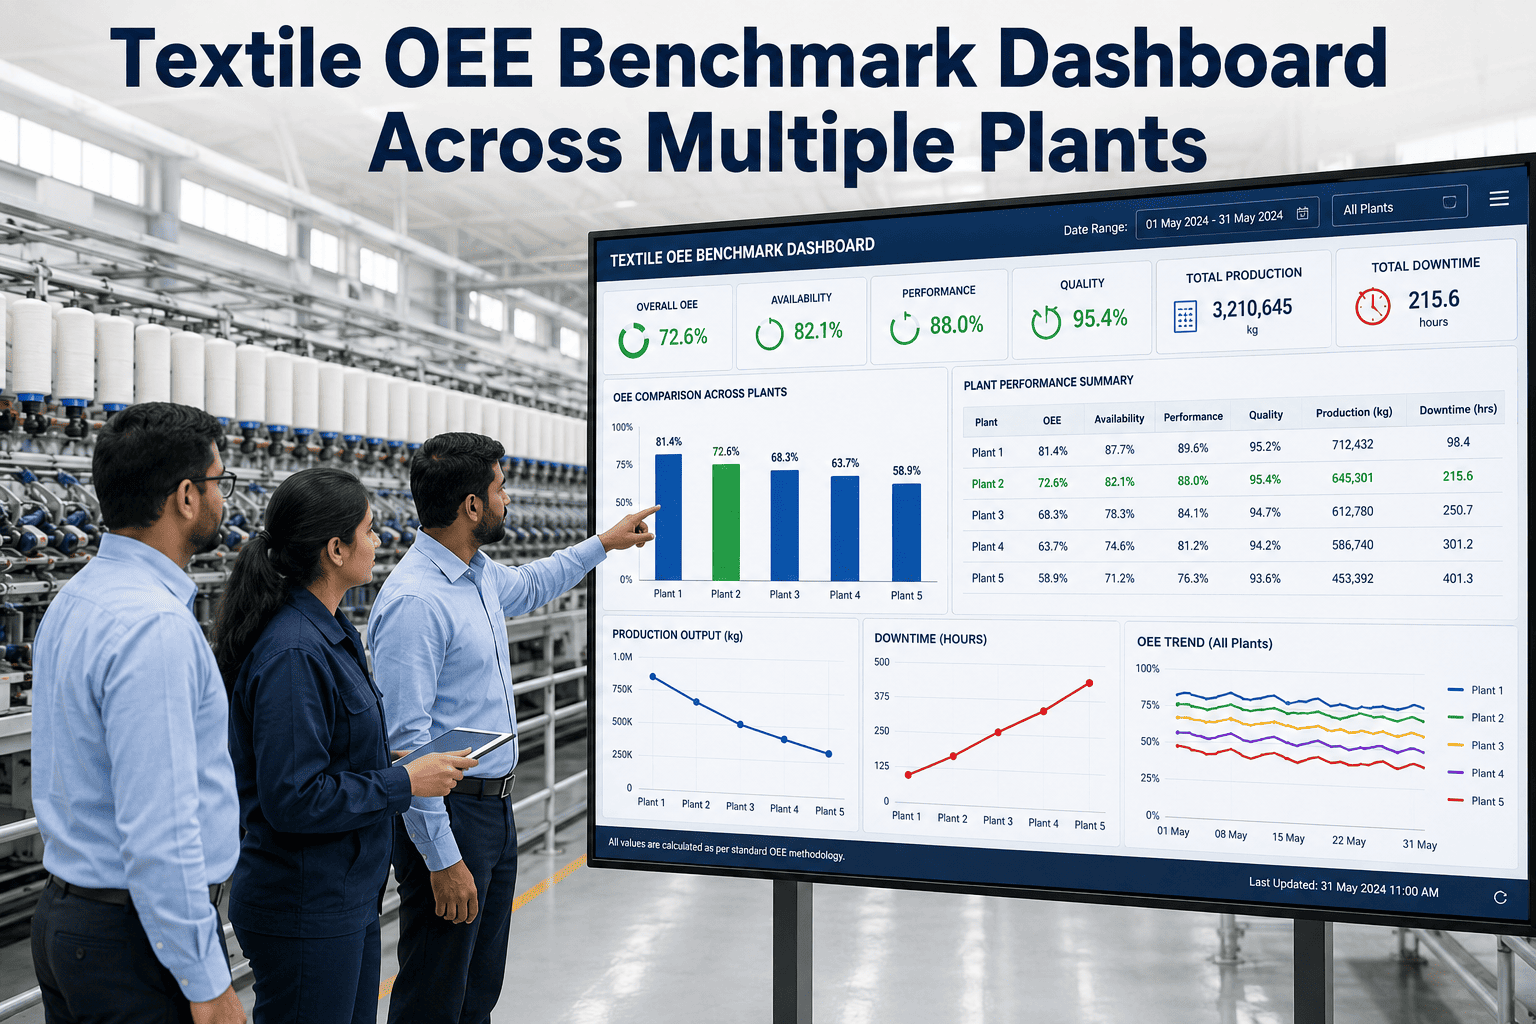
Ask five plant managers in the same textile group what their OEE is and you'll often get five different definitions of downtime, five different shift-change conventions, and five numbers that can't actually be compared. That's the real problem multi-plant groups face — not that performance varies, but that nobody can prove which plant is actually best, or why. A properly standardized benchmark dashboard fixes that by forcing every site onto the same clock, the same loss categories, and the same scoring rules. Book a demo to see your own plants ranked on a level playing field.
Multi-Plant Analytics · OEE Benchmarking
Which Plant Is Actually Your Best? Now You Can Prove It.
Rank every plant, department, machine, and shift on one standardized OEE scale, and surface the specific practices that separate your top performers from the rest.
A Sample Group Leaderboard
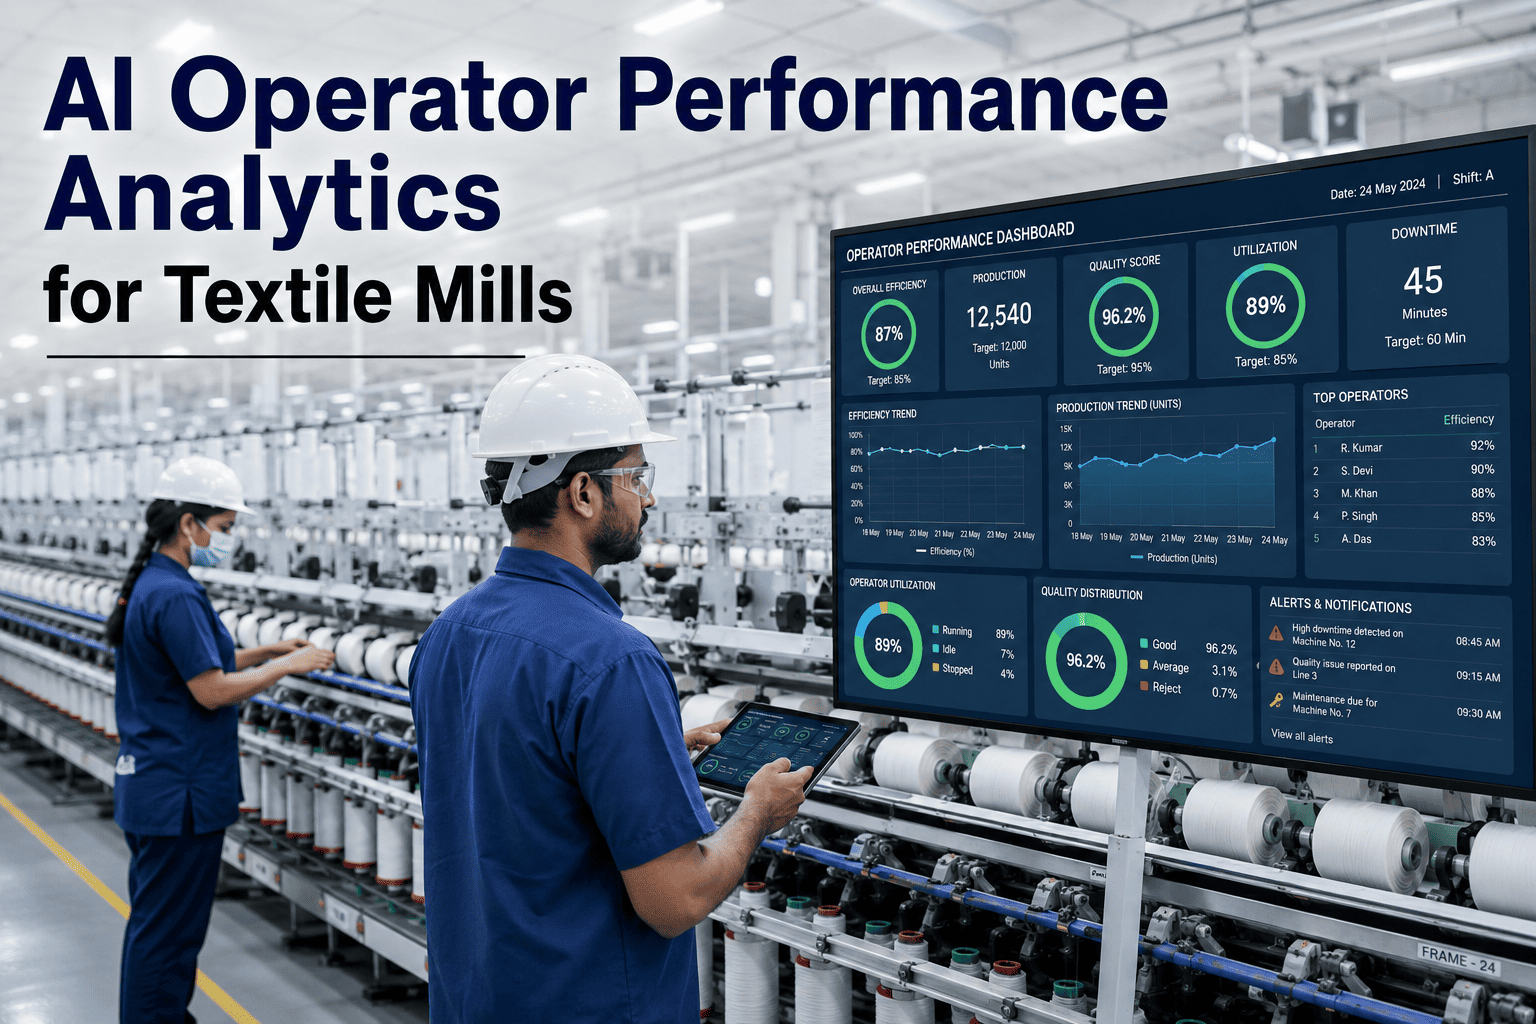
Once every site reports on the same standardized definition, ranking stops being a political argument and starts being a simple, ordered list — the format below is how a five-plant group's dashboard typically looks after standardization.
1
Plant C — Vietnam
81.4%
4
Plant D — Bangladesh
65.3%
A 22-point spread between top and bottom plant is common in unbenchmarked groups — and it usually isn't explained by equipment age or product mix alone.
What Actually Separates Rank 1 From Rank 5
When groups dig into the gap, it rarely comes down to newer machines. It comes down to a handful of repeatable operating habits that transfer easily once they're identified.
Standardized Downtime Codes
Top plants tag every stop with the same reason-code taxonomy, so group-level Pareto analysis actually means something across sites.
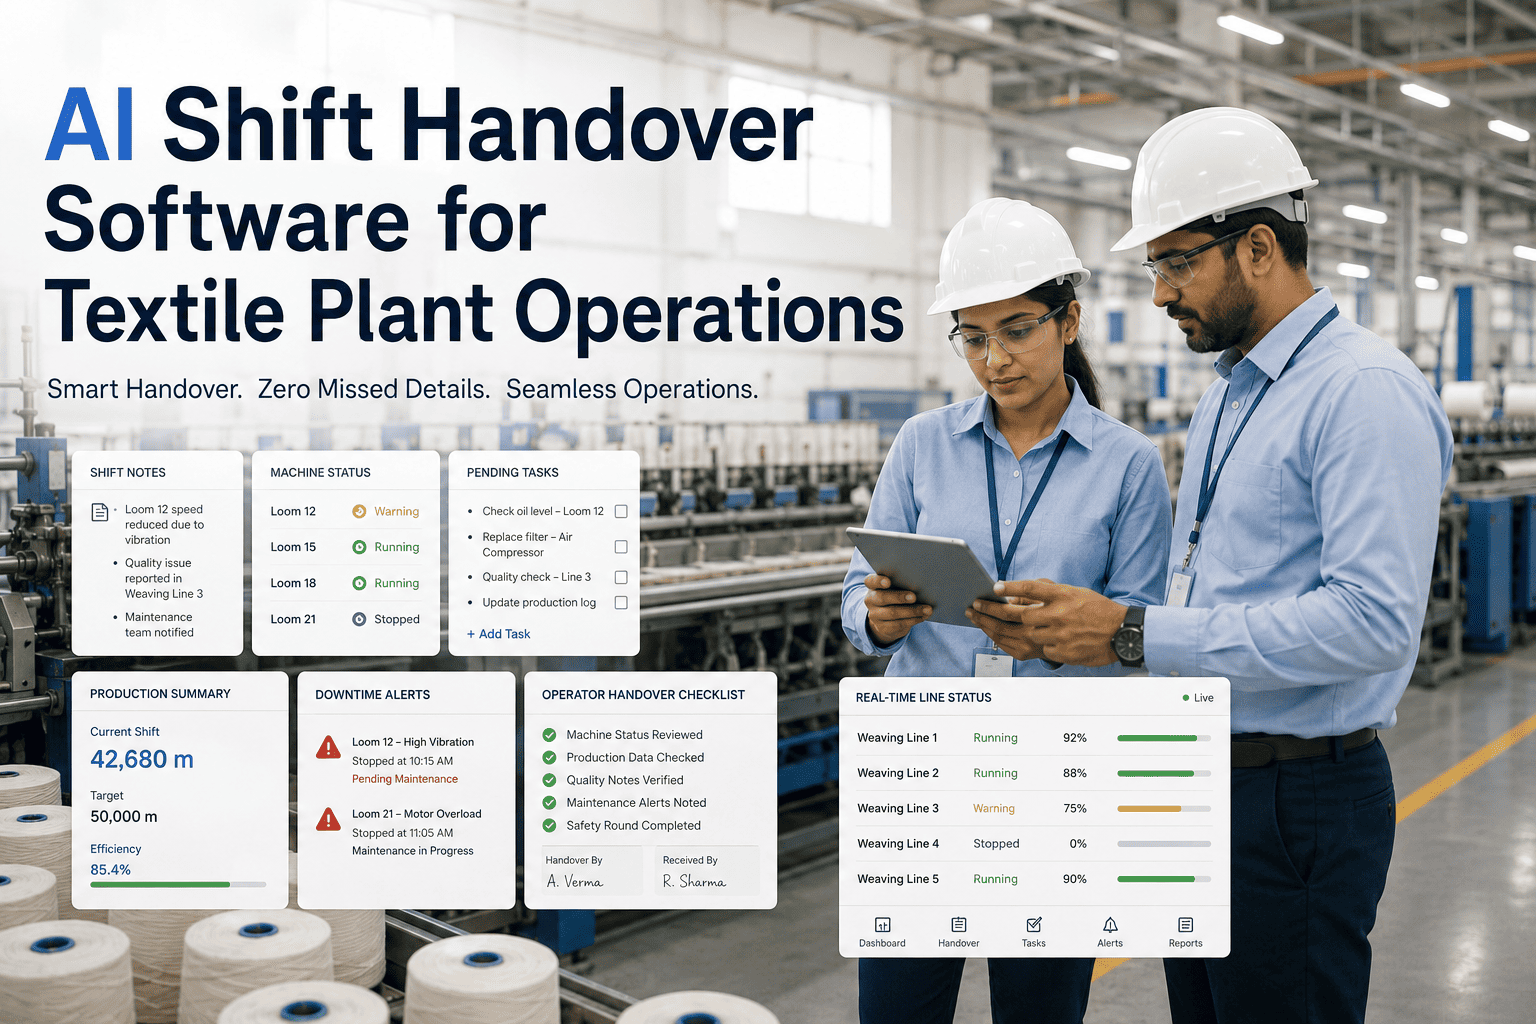
Shift Handover Discipline
Consistent handover checklists prevent the same micro-stop from recurring across three consecutive shifts before anyone flags it.
Changeover Time Targets
High-ranking plants set and track SMED-style changeover targets per product family instead of treating changeover as unavoidable.
Daily Loss Review Cadence
Reviewing yesterday's top losses every morning, in front of live data, closes gaps in weeks instead of the following month's report cycle.
A benchmark dashboard is only useful if every plant is measured the same way. Standardizing the definition is what turns a ranking into a management tool instead of a dispute.
Department-Level Comparison Inside One Plant
Benchmarking doesn't stop at the plant level. The same standardized scoring applied within a single site usually reveals just as much variation between departments.
| Department |
Availability |
Performance |
Quality |
OEE |
| Spinning |
88% |
91% |
99.2% |
79.4% |
| Weaving |
81% |
86% |
98.5% |
68.6% |
| Dyeing & Finishing |
76% |
89% |
97.1% |
65.7% |
| Garmenting |
84% |
82% |
98.8% |
68.1% |
Field Insight
The biggest win from multi-plant benchmarking usually isn't finding your worst site — it's discovering that your best site solved a problem eighteen months ago that three other plants are still fighting today. Without a shared scoring standard, that knowledge never travels. With one, a changeover technique or a downtime-coding habit can move from your top plant to your bottom plant in a single quarter.
Group Operations Director, Multi-Site Textile Manufacturing
Frequently Asked Questions
Our plants use different machines and product mixes — is a fair comparison even possible?
Yes, as long as the comparison accounts for context rather than forcing every site into an identical mold. The standardized scoring applies the same availability, performance, and quality definitions everywhere, but the dashboard also segments comparisons by product family and machine class so you're comparing similar work rather than apples to oranges. This is usually more revealing than it sounds, because most of the real gap between plants turns out to be operating discipline rather than equipment or product differences.
Book a demo to see how segmentation works with your specific plant mix.
How long does it take to standardize OEE definitions across an existing group of plants?
Aligning the core definitions, planned time, downtime reason codes, and quality criteria, typically takes two to four weeks per plant depending on how far each site's current tracking has to move. Most groups roll this out in waves rather than all at once, starting with the two or three plants where leadership most needs visibility. A full group-wide standardized dashboard is usually live within one quarter for a five to ten plant group.
Contact support for a rollout plan sized to your group.
Will plant managers resist being ranked against each other?
Some initial resistance is normal, especially at plants that expect to rank lower once measurement becomes consistent. In practice, most managers come around quickly once they see the same dashboard also surfaces the specific, actionable causes behind a low rank rather than just a scoreboard number to be defensive about. Framing the leaderboard as a tool for spreading best practice, not a punishment mechanism, is what makes adoption stick.
Book a demo to see how the dashboard presents root causes alongside rankings.
Can this integrate with the different ERP and machine data systems each of our plants already uses?
Yes. Multi-plant benchmarking is designed to sit on top of whatever machine monitoring, SCADA, or ERP systems each site already runs, pulling standardized metrics from otherwise inconsistent source systems. This is usually less disruptive than replacing each plant's existing infrastructure, since the standardization happens at the reporting layer rather than requiring every site to adopt identical hardware.
Contact support to review integration options for your current plant systems.
How often should group leadership actually review the benchmark dashboard?
Group-level strategic reviews typically happen monthly or quarterly, focused on trend direction and best-practice transfer between sites. At the plant level, though, the dashboard is most valuable reviewed daily by local teams, since that's the cadence at which losses can still be corrected before they compound into a full reporting period. The two cadences work together: daily local action feeding into a monthly group-level view of who's actually closing the gap.
Book a demo to see both review cadences in the same dashboard.
Stop Guessing Which Plant Is Actually Winning
A single standardized OEE scale across every plant, department, and shift in your group.