The P-F Curve Explained: How Predictive Maintenance Extends the Warning Window

By Rebecca on June 11, 2026

pf-curve-explained-predictive-maintenance-warning-window

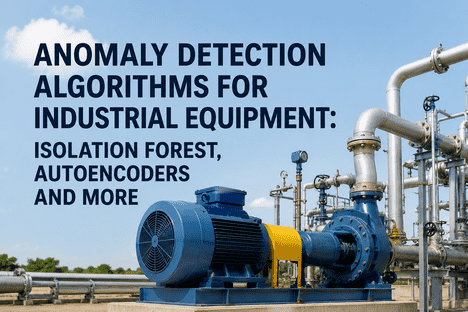
In reliability-centred maintenance (RCM), the P-F curve maps the interval between the first detectable sign of potential failure (Point P) and the moment an asset can no longer perform its intended function (Point F). This interval — the P-F interval — is the warning window maintenance teams have to plan, schedule, and execute corrective action before functional failure occurs. Traditional time-based and reactive maintenance approaches often detect failure only hours or days before functional failure, compressing the P-F interval to near zero and forcing emergency repairs that cost 3–5× more than planned interventions. iFactory's AI-powered predictive maintenance platform extends the P-F interval from days to months by detecting subtle precursor patterns in vibration data, temperature trends, oil analysis, motor current signatures, and acoustic emissions that human operators and conventional alarm thresholds miss. Book a Demo to see how iFactory's ML models extend your asset P-F intervals.


RCM Methodology · Predictive Maintenance 2026
The P-F Curve Explained: How Predictive Maintenance Extends the Warning Window

Potential failure detection · P-F interval analysis · AI-driven early warning · Condition-based planning · All flowing into iFactory CMMS & Shift Logbook.

Potential Failure (P)
Earliest detectable sign — vibration, temperature, wear debris
P-F Interval
Warning window — time to plan, procure, schedule intervention
Functional Failure (F)
Asset can no longer meet required performance standard
AI Extension
ML detects failure precursors weeks before traditional methods

Why the P-F Curve Is the Foundation of Predictive Maintenance Strategy

The P-F curve, formalised in John Moubray's RCM2 methodology, is the theoretical basis for every condition monitoring and predictive maintenance decision. Every failure mode follows a P-F curve — the shape and duration of the interval varies by asset type, failure mechanism, and operating context. A spindle bearing in a centrifugal pump may have a P-F interval of 3–6 months when monitored through vibration analysis, while a cracked turbine blade under high-cycle fatigue may progress from potential to functional failure in under 200 operating hours. The goal of predictive maintenance is to detect Point P as early as possible in the failure progression and maximise the P-F interval available for planning. iFactory's platform achieves this by fusing multiple sensing modalities — vibration, thermography, oil analysis, motor current, acoustic emissions — into ensemble ML models that recognise failure precursors before any single sensor crosses its alarm threshold.

CONSEQUENCES OF SHORTENED P-F INTERVALS
1
Emergency maintenance cost multiplier — repairs executed within a compressed P-F window cost 3–5× more due to overtime, expedited shipping, and production losses
2
Zero planning flexibility — maintenance teams cannot optimise resource allocation, procure long-lead components, or schedule shutdowns during low-demand periods
3
Secondary damage accumulation — operating an asset beyond Point P without intervention accelerates collateral wear, turning a $5,000 bearing replacement into a $50,000 shaft and housing rebuild
4
Unpredictable production impact — short P-F intervals create random failure patterns that force reactive scheduling, buffer stock depletion, and missed delivery commitments

Three P-F Curve Detection Zones iFactory Monitors

01
Early Zone — Precursor Detection Before Conventional Alarms
The earliest detectable signs of potential failure often appear in data streams that conventional SCADA systems and alarm thresholds ignore — subtle shifts in vibration energy bands, micro-degree temperature gradients, trace element concentrations in oil samples, and harmonic distortions in motor current. These precursors emerge weeks or months before vibration amplitudes reach ISO 10816 alert levels or bearing temperatures trigger protection trips. iFactory's ML models are trained on labelled failure histories to recognise these early signatures and separate them from normal operating variability. In rotating equipment applications, the platform detects bearing degradation signals 4–8 weeks before conventional vibration alarms would activate, extending the usable P-F interval by 2–3×. Book a Demo to learn how iFactory detects failure precursors weeks before traditional methods.
4-8 week early detection2-3× P-F extensionML-driven precursors
02
Mid Zone — Condition Monitoring and Trend Analysis
As failure progresses, sensor readings cross conventional alarm thresholds — vibration exceeds ISO 2372 alert levels, bearing temperature rises above baseline, oil particle counts increase, and thermographic images show developing hot spots. In this mid-zone, the P-F interval has already partially elapsed, but maintenance teams still have days to weeks of planning time if they act immediately. iFactory's Shift Logbook captures inspection findings, vibration readings, and operator observations alongside the sensor data stream, creating a unified record that improves model accuracy and enables root-cause correlation across asset classes. The platform continuously learns from each mid-zone intervention to refine its early-zone detection algorithms, progressively shifting detection earlier on the P-F curve.
Days-weeks planningShift Logbook correlationContinuous model refinement
03
Late Zone — Emergency Intervention and Damage Limitation
When failure progression goes undetected through the early and mid zones, the asset enters the late zone where functional failure is imminent — vibration spikes, temperature excursions, audible noise changes, and performance degradation become obvious to operators. At this stage, the P-F interval has collapsed to hours or days, leaving no time for planned maintenance. Emergency shutdowns, overtime labour, expedited parts procurement, and secondary damage costs multiply rapidly. iFactory's predictive models are designed to prevent assets from ever reaching this zone. When a late-zone event does occur due to a missed detection, the Shift Logbook captures the full event timeline — sensor trends, operator actions, maintenance response, and failure analysis — creating a root-cause record that trains the models to detect that specific failure pattern earlier in the future.
Hours-days remainingEmergency cost multiplierRoot-cause feedback loop

How iFactory Extends the P-F Interval Across Detection Technologies

iFactory is the AI software intelligence layer — not a sensor manufacturer or hardware vendor. The platform integrates with vibration sensors, temperature probes, oil analysis labs, thermal cameras, ultrasonic detectors, motor current transducers, acoustic emission sensors, and SCADA/PLC telemetry already deployed on your assets. The Shift Logbook captures operator shift reports, daily inspection findings, and maintenance notes alongside the real-time sensor stream, creating a unified data fabric for predictive model training and fleet-wide reliability analysis.

Detection Technology
P-F Curve Position
iFactory P-F Extension
Business Impact
Oil / Wear Debris Analysis
Early Zone (near P)
ML trend prediction 6–8 weeks before alarm
Longest planning horizon for spares and labour
Vibration Analysis
Early–Mid Zone
Ensemble models detect bearing fault 4–6 weeks early
Scheduled outage vs emergency shutdown
Thermography / IR
Mid Zone
Temperature gradient ML predicts hotspot 2–4 weeks early
Planned electrical maintenance avoided
Motor Current / MCSA
Early–Mid Zone
Harmonic analysis detects rotor bar faults 3–5 weeks early
Motor rewind vs replacement cost savings
Extend Your Asset P-F Intervals With iFactory AI

AI-powered predictive maintenance platform that integrates vibration, temperature, oil analysis, motor current, and acoustic emission data into ML models that detect failure precursors weeks before conventional methods — extending your P-F interval, eliminating emergency repairs, and shifting maintenance from reactive to condition-based.

P-F Curve Analysis Predictive Maintenance RCM Methodology Condition Monitoring Shift Logbook

P-F Curve Applications Across Industrial Asset Classes

Rotating Equipment
P-F Interval Optimisation for Pumps, Fans, Compressors
Continuous

Centrifugal pumps, fans, and compressors exhibit bearing wear, impeller erosion, shaft misalignment, and cavitation damage that follow well-characterised P-F curves. In oil analysis, the P-F interval begins when wear metal concentrations trend upward — often 3–6 months before functional failure. Vibration analysis detects bearing faults 1–3 months before failure. iFactory's ML models ingest both oil analysis and vibration data simultaneously, fusing the two modalities to push Point P detection earlier than either technique alone. The Shift Logbook captures oil sample results, vibration route readings, and seal replacement history to build asset-specific P-F curve models that improve with every intervention.

P-F ExtensionUp to 8 weeks
Data FusionOil · vibration · temperature
Talk to an Expert
Electrical Assets
Motor, Transformer and Switchgear P-F Monitoring
Continuous

Electric motors, power transformers, and switchgear exhibit distinct P-F curve shapes depending on the dominant failure mode — insulation degradation, rotor bar cracking, bearing wear, or loose connections. Motor current signature analysis (MCSA) detects rotor bar faults 3–5 weeks before vibration signatures emerge, while dissolved gas analysis (DGA) in transformers can indicate developing faults 6–12 months before functional failure. iFactory's Shift Logbook integrates DGA lab results, thermographic inspection findings, and motor current data into a single asset timeline, enabling reliability engineers to correlate multiple detection technologies and identify the earliest possible Point P for each failure mode.

Detection RangeMCSA · DGA · thermography
P-F HorizonWeeks to months
Talk to an Expert
Static & Structural
Tank, Pipe and Pressure Vessel P-F Curve Analysis
Periodic

Static assets — storage tanks, pressure vessels, piping systems, and structural supports — experience corrosion, erosion, fatigue cracking, and material degradation with P-F intervals ranging from months to years. Ultrasonic thickness (UT) measurements, acoustic emission monitoring, and corrosion coupon analysis provide periodic snapshots of wall loss and crack growth. iFactory ingests UT data, corrosion rate trends, inspection reports, and process conditions (temperature, pressure, flow velocity) into ML models that forecast remaining wall thickness and predict when minimum allowable thickness will be reached. The Shift Logbook captures inspection findings and repair history alongside sensor data to build increasingly accurate corrosion P-F models.

P-F RangeMonths to years
Data SourcesUT · AE · corrosion coupons
Talk to an Expert

What iFactory Delivers for P-F Curve-Based Maintenance Planning

2-3×
P-F interval extension vs threshold-based alarms
ML detects precursors weeks before conventional methods
40-60%
Fewer emergency repair events per year
Planned intervention replaces reactive response
3-5×
Cost reduction per maintenance event
Emergency vs planned repair cost comparison
85%+
Detection accuracy after model maturation
Continuous learning loop improves over 6–12 months
Deploy iFactory for P-F Curve-Based Predictive Maintenance

AI-powered predictive maintenance platform fusing vibration, oil analysis, thermography, motor current, and acoustic emission data into one unified intelligence layer — with ML-based failure precursor detection, P-F interval extension, Shift Logbook integration, CMMS workflow automation, and plant-wide reliability analytics.

P-F Curve Analysis Predictive Maintenance RCM Methodology Condition Monitoring Shift Logbook CMMS Integration

Share This Story, Choose Your Platform!