A plant manager at a tier-2 automotive supplier in Stuttgart started every Monday the same way — manually pulling defect data from three separate systems, cross-referencing SPC charts printed the previous Friday, and building a quality summary in a spreadsheet that was already outdated by the time he emailed it to leadership. His team was not short on data. They were drowning in it. Fourteen thousand inspection points generated daily across four production lines, stored across an MES, two standalone SPC tools, and a shared drive full of Excel files nobody trusted. The information existed. Visibility did not. When a customer complaint arrived about dimensional drift on a critical brake component, it took his team eleven days to trace the root cause — a gradual tool wear pattern that a real-time quality command center would have flagged in hours. By then, 28,000 suspect parts had shipped.
iFactory Manufacturing Intelligence
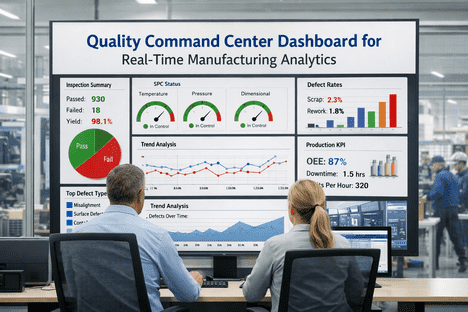
Quality Command Center Dashboard for Real-Time Manufacturing Analytics
The centralised quality intelligence platform that turns fragmented inspection data, SPC signals, and defect trends into a single live view your entire team can act on — before quality escapes reach customers
14,000+
Inspection points per day on a typical line
73%
Of manufacturers lack real-time quality visibility
58 min
Saved per quality inspector daily with digital workflows
90%+
Defect detection accuracy in mature AI systems
Why Quality Teams Are Flying Blind
The average manufacturing facility generates more quality data in a single shift than most teams can analyse in a week. The problem is not data scarcity — it is data fragmentation. When inspection results live in one system, SPC charts in another, CAPA records in a third, and customer complaints in email threads, no single person has a complete picture of quality performance at any given moment.
MES / ERP
Production counts, batch records, order status
SPC Tools
Control charts, Cp/Cpk, process stability alerts
Inspection Systems
CMM results, gauge data, visual inspection logs
IoT Sensors
Temperature, pressure, vibration, humidity
CAPA / QMS
Corrective actions, non-conformances, audit findings
Customer Feedback
Complaints, returns, warranty claims, 8D requests
Anatomy of a Quality Command Center
A quality command center is not just a dashboard — it is the operational nerve centre of your quality organisation. It unifies every quality data stream into a single, role-specific, real-time interface that transforms raw signals into decisions. Here are the seven layers that make it work.
01
Real-Time OEE and Quality Scoring
Live OEE broken into availability, performance, and quality components. The quality score updates every cycle — not every shift — so drift is visible within minutes, not days.
02
SPC Control Charts with AI Alerting
Live X-bar, R-charts, Cp/Cpk monitoring with AI pattern recognition that detects trends, runs, and shifts before they breach control limits — catching drift that rules-based SPC misses.
03
Defect Pareto and Trend Analysis
Auto-generated Pareto charts showing top defect categories by line, shift, product, and time period. Trend overlays reveal whether corrective actions are actually working.
04
Inspection Completion Tracker
Visual status of all scheduled and ad-hoc inspections across every line. Overdue inspections escalate automatically. Completion rates are tracked by shift and operator.
05
CAPA Pipeline and Aging Monitor
Every open corrective action visible with aging indicators. Overdue CAPAs turn red. Risk-weighted prioritisation ensures the most critical issues get attention first.
06
Supplier Quality Scorecard
Incoming inspection pass rates, PPM trends, and supplier risk scores updated in real time. Early-warning alerts trigger when a supplier's quality begins drifting before it crosses reject thresholds.
07
Compliance and Audit Readiness Score
A live compliance health score showing documentation completeness, training currency, calibration status, and CAPA closure rates — so you are always audit-ready, not scrambling before one.
Want to see these seven layers working together in a live manufacturing environment? Book a personalised demo.
The KPIs That Matter Most
A quality command center is only as valuable as the metrics it tracks. These are the twelve KPIs that leading manufacturers monitor in real time — and the benchmarks that separate world-class from average.
Role-Based Views — One Platform, Every Perspective
A quality command center that shows the same screen to everyone serves no one well. The power of a centralised dashboard is that it provides role-specific views — giving each person exactly the information they need to make decisions at their level, without noise.
Sees: OEE trends across all lines, cost-of-quality summary, customer complaint trajectory, compliance readiness score, month-over-month quality improvement velocity
Decides: Capital allocation, staffing priorities, strategic quality investments, customer escalation responses
Sees: CAPA pipeline aging, SPC violations by line, audit readiness gaps, supplier scorecards, defect Pareto by product family, inspection completion rates
Decides: CAPA prioritisation, audit scheduling, supplier interventions, process capability improvement projects
Sees: Live first-pass yield per line, shift-level defect rates, real-time SPC alerts, inspection queue status, machine-level OEE breakdown
Decides: Line adjustments, operator reassignment, immediate containment actions, shift handover priorities
Sees: Current inspection checklist, pass/fail results, measurement entry forms, SPC chart for current feature, photo capture prompts for defects
Decides: Accept/reject/quarantine at the station, escalation of abnormal readings, real-time defect documentation
From Data to Decision — How Fast?
The value of a quality command center is measured in the gap between something going wrong and someone knowing about it. Here is how response times compare between traditional quality management and a centralised AI-powered dashboard.
SPC violation detected
4-8 hours (next SPC review)
Defect trend identified
Minutes (AI pattern detection)
Root cause isolated
5-14 days (cross-system analysis)
CAPA initiated
2-5 days (manual workflow)
Audit report compiled
3-7 days (data gathering)
Traditional QMS
Quality Command Center
Ready to close the gap between data and decision? Talk to our manufacturing intelligence team.
Frequently Asked Questions
What data sources can a quality command center integrate with?
A modern quality command center connects to virtually any manufacturing data source — ERP systems (SAP, Oracle), MES platforms, SCADA, PLCs via OPC-UA and MQTT, standalone SPC tools, CMM and gauge systems, IoT sensors, and existing QMS databases. The platform normalises data from all sources into a unified model, eliminating the silos that prevent cross-system analysis.
How long does implementation take?
Most manufacturers see initial dashboards live within 4-6 weeks. Digital inspection checklists replace paper from day one. SPC monitoring and real-time OEE go live within weeks 5-12. AI-driven predictive models mature over months 3-6 as the system learns your specific production patterns and defect signatures.
Can the dashboard support multiple facilities and production lines?
Yes. The platform is designed for multi-site, multi-line deployments with role-based access controls. Plant managers see their facility, regional directors see cross-site comparisons, and corporate leadership gets an enterprise-wide quality view — all from the same platform with no duplicate data entry.
What compliance standards does the platform support?
The quality command center maintains audit-ready documentation for ISO 9001, IATF 16949, FDA 21 CFR Part 11, AS9100, ISO 14001, and GMP. Every data point, inspection result, and quality decision is automatically timestamped and stored in a tamper-proof audit trail that satisfies all major regulatory frameworks.
Does it work with legacy equipment and older PLCs?
Absolutely. iFactory connects to legacy PLCs and equipment from any era using standard industrial protocols including Modbus, OPC-UA, MQTT, and REST APIs. Even equipment from the 1970s-1980s can feed data into the command center through protocol converters, ensuring complete visibility regardless of equipment age.
See Everything. Miss Nothing.
Your Quality Data Already Exists. Your Visibility Does Not. Fix That Today.
iFactory's Quality Command Center unifies every inspection point, SPC signal, defect trend, and compliance record into a single real-time dashboard. From shop floor to boardroom, everyone sees the truth — and acts on it before quality escapes.
Real-Time
Quality visibility across every line
12 KPIs
Monitored continuously
1-Click
Audit-ready compliance reports
4-6wk
To first live dashboards