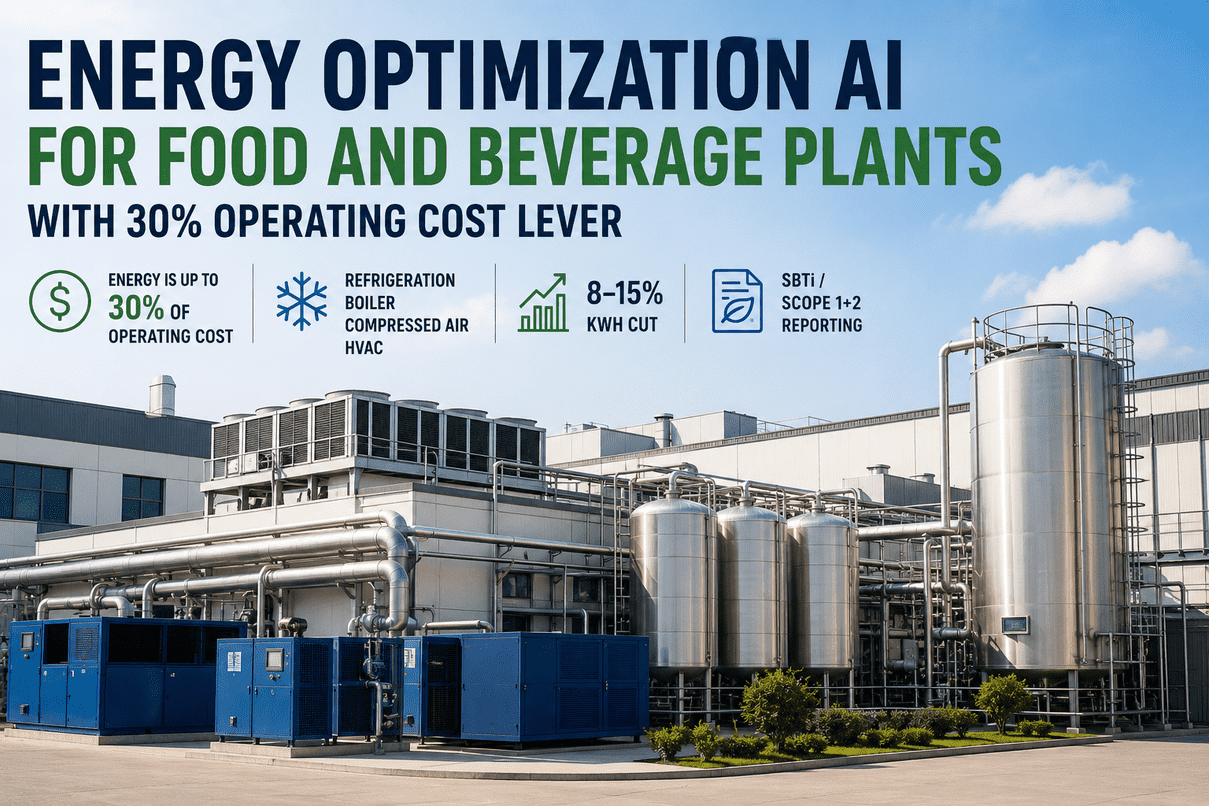
Energy does not feel like a strategy problem until you see the number. In most food and beverage plants, energy is 15–30% of total operating cost — often the second-largest cost after raw materials, and the one that procurement has the least visibility into. Refrigeration runs all day whether demand requires it or not. Boilers idle between production cycles burning gas nobody measured. Compressed air leaks silently through the weekend. The AI sees all of it, continuously, and orchestrates every system against a single objective: lowest kWh per tonne of output, within every food-safety and product-quality constraint you operate under. See it running on your plant data.
Cut Energy 8–15% Without Touching Product Quality or Food Safety
iFactory AI orchestrates refrigeration, boilers, compressed air, and HVAC as one system — not four separate maintenance problems. Running on an NVIDIA RTX Pro 6000 Blackwell on-site appliance, every setpoint recommendation arrives with a confidence score, a kWh impact estimate, and a food-safety constraint check. Operators approve. Every action logs to your Scope 1 and 2 reporting ledger automatically.
Energy Is 15–30% of Your Operating Cost. Most Plants Manage It With Weekly Reports.
The gap between what plants spend on energy and what they could spend is not an equipment problem — it is a visibility and coordination problem. Each system runs on its own logic. Nobody is optimising all four simultaneously, in real time, against production demand.
Refrigeration · Boilers · Compressed Air · HVAC — Optimised As One
Most plants treat these four as separate utilities managed by separate teams. iFactory treats them as one interconnected energy budget — where a decision on refrigeration setpoint affects the HVAC load, and a boiler scheduling choice affects compressed air peak draw. The AI sees the whole plant. Each team sees the recommendations relevant to their system.
The largest single energy consumer in most F&B plants. AI models the thermal mass of cold rooms, production heat loads, and ambient conditions together — then optimises compressor staging, head pressure setpoints, and defrost scheduling to cut kWh without touching product temperatures.
Steam demand in F&B is highly variable — CIP cycles, pasteurisers, blanchers, and autoclaves create sharp load swings. AI learns the demand profile for each production recipe and pre-fires boilers only when needed — cutting idle gas burn and reducing blowdown losses.
Compressed air is the most expensive utility per unit of work delivered in any F&B plant — and the most wasted. Leakage alone accounts for 20–30% of generated air in a typical plant. AI continuously monitors system pressure, compressor efficiency curves, and end-use demand to identify both mechanical waste and scheduling inefficiencies.
HVAC in an F&B plant is not just comfort — it is food safety. Temperature and humidity in production zones directly affects microbial control, product quality, and regulatory compliance. AI optimises HVAC within the food-safety envelope, never below it, and coordinates with refrigeration to avoid simultaneous peak loads.
A Recommendation You Can Act On in 30 Seconds — With the Reasoning Included
Every recommendation from iFactory carries the same anatomy: which system, which lever, what change, what kWh impact, what the food-safety constraint is, and confidence. Operators approve. The action logs. See a live walkthrough with your utility data.
Ambient wet-bulb temperature is currently 11.4°C — 6°C below the design condition for this condensing circuit. The current head pressure setpoint of 10.8 bar is below the minimum recommended for oil return in the suction accumulators at this load level. Raising setpoint to 12.1 bar reduces compressor lift, improves COP by an estimated 0.18, and keeps oil return safe. Product temperatures in Zones 2, 3, and 4 will remain within HACCP limits — the model has verified against the current zone thermal mass and the next scheduled door-open event at 16:30. No food-safety constraint is breached by this action.
8–15% kWh Cut. What That Means in Your Currency.
The saving is not a single lever — it is the aggregate of dozens of small setpoint optimisations across all four systems, every shift, every day. The numbers below are representative for a mid-size F&B plant running a 24/7 operation. Your figure depends on your starting efficiency level, energy mix, and tariff.
Every kWh Saved Is Already in Your Scope Report
The pressure to report Scope 1 and 2 emissions accurately — and reduce them credibly — is moving from voluntary to contractual. Major retail buyers and institutional investors now require validated reduction roadmaps. iFactory turns energy optimisation actions into audit-ready emissions data automatically, with no separate reporting workflow.
Operator approves a refrigeration or boiler setpoint change. The system records timestamp, system, setpoint delta, and predicted kWh impact.
Actual kWh metered over the next 1–4 hours against the baseline. Verified saving calculated — not modelled saving, actual saving from your sub-meters.
The verified kWh saving is converted to CO2e using your grid emission factor (Scope 2) or fuel-specific factor (Scope 1) and logged to your emissions ledger — automatically.
Monthly and annual Scope 1+2 reports generated in GHG Protocol format — ready for SBTi submission, CDP disclosure, or retail buyer audit, with the action log as supporting evidence.
What Energy Managers Ask Before Deployment
No. Food-safety and HACCP temperature limits are hard constraints — the model does not generate recommendations that breach them. Every recommendation includes a food-safety constraint check as part of the output. If the check cannot be satisfied, the recommendation is suppressed, not presented with a caveat.
Baseline learning takes 2–3 weeks of healthy-operation data. By the end of week 4, the model has sufficient history to distinguish production recipe changes from genuine inefficiency. First recommendations are typically in validation mode for the first two weeks — reviewed with your team before any action is taken.
No. iFactory reads from your existing BMS, SCADA, and energy metering infrastructure — and writes back setpoint candidates on a write-confirm pattern. Your existing control layer stays in place. The AI sits on top of it, not instead of it.
Every approved action is followed by a measurement window using your sub-metering data. The verified saving is the difference between the measured kWh and the counterfactual baseline computed from the preceding period at equivalent load. The counterfactual method is documented and exportable for third-party audit.
See What Your Plant Is Spending That It Doesn't Need To
We do not sell you a dashboard. iFactory delivers the complete solution — pre-configured NVIDIA RTX Pro 6000 Blackwell appliance shipped to your plant, our team connects to your BMS, SCADA, and energy meters, models calibrate to your production recipes, and the first recommendations are live within the 6-week pilot. You see real kWh savings on your actual plant before you commit to full deployment.