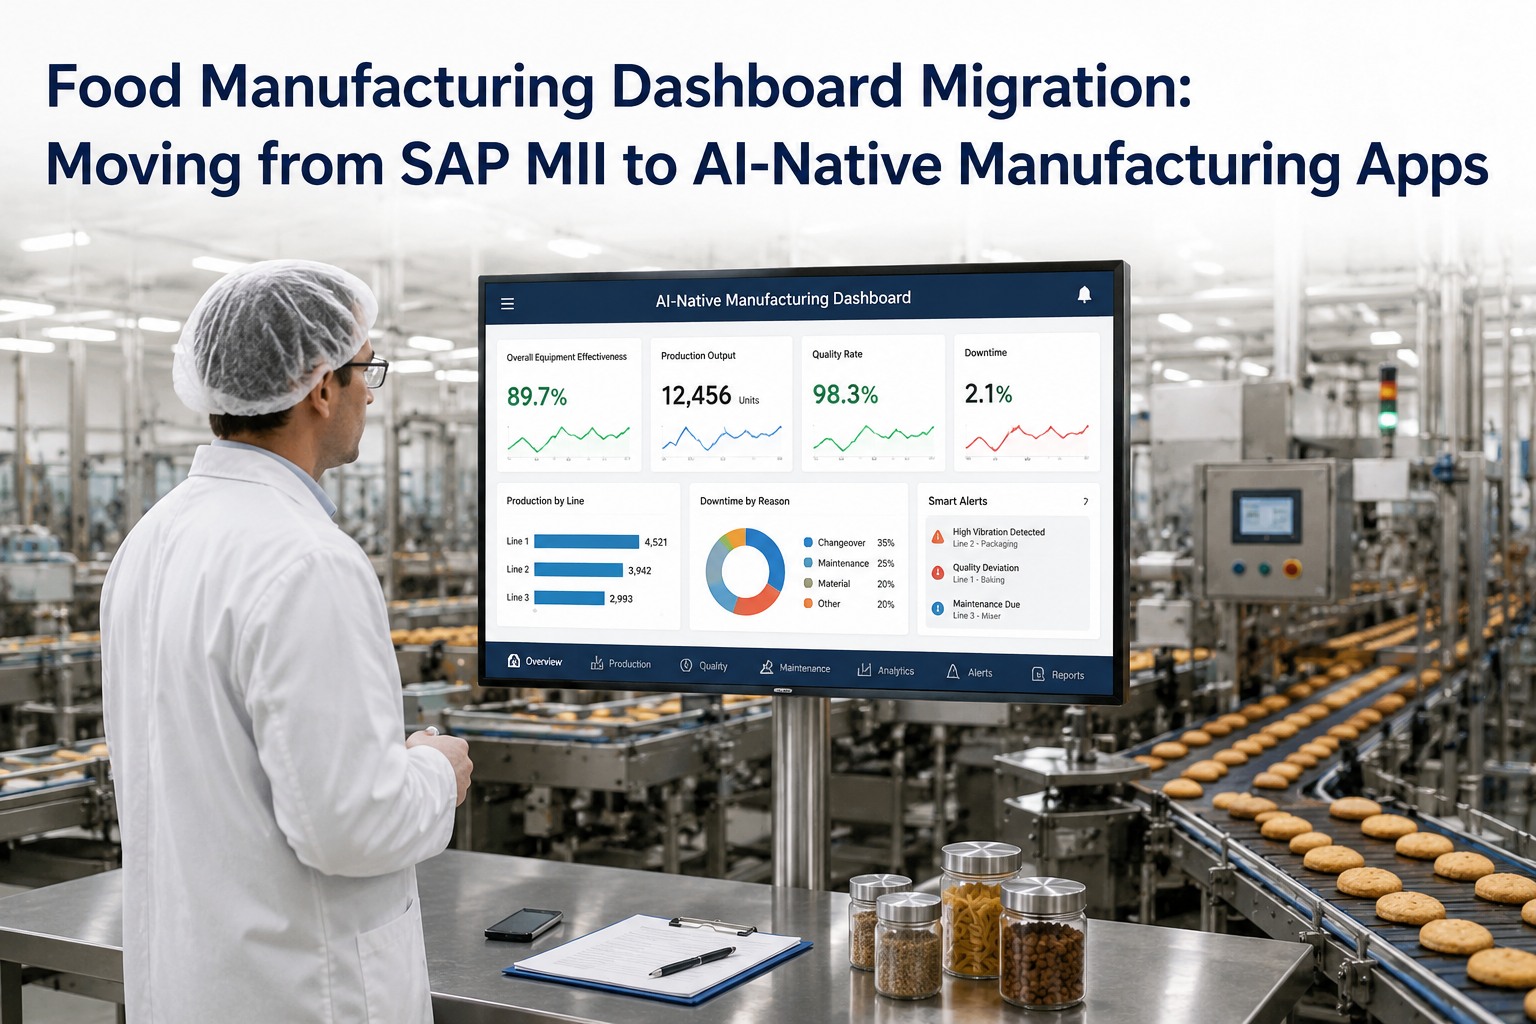
Walk into a food manufacturing plant today and you will likely find SAP MII dashboards displayed on plant-floor screens: OEE rollups, downtime ticker boards, sanitation completion charts, batch genealogy lookups, HACCP deviation panels. They have been running for years. They work. And they are running on a platform with extended maintenance ending December 31, 2030 — built for a 2010 era of static reporting, designed before AI was a serious factory tool, and increasingly mismatched with what food plants actually need to compete in 2026. This page walks through exactly how food manufacturers are migrating these dashboards from legacy SAP MII to AI-native manufacturing apps — without losing what operators trust, what auditors expect, or what leadership relies on. Real KPIs, real food-industry workflows, real migration patterns. Book a 30-minute working session to map your specific food plant dashboards against AI-native equivalents.
+15%
Average OEE lift food plants report after moving from batch-mode to real-time AI dashboards
−4%
Reduction in product waste through AI-driven anomaly detection on production lines
FSMA 204
Traceability requirements satisfied with automated CCP and batch lineage capture
$1.1M
Annual value one snack-food plant unlocked by discovering true OEE was 58%, not 74%
Why Food Plants Are Migrating: Three Forces Pulling at the Same Time
The migration conversation in food manufacturing is being driven by three forces that have arrived simultaneously. Any one of them would justify the effort. All three at once make the case unavoidable.
FORCE 01
Regulatory pressure has accelerated
FSMA Section 204 traceability mandates are now fully active. BRCGS and SQF auditors are demanding tighter deviation-to-corrective-action linkage. FDA, USDA, and GFSI auditors increasingly expect real-time evidence, not month-end PDFs. Static MII dashboards struggle to produce audit-ready documentation on demand.
FORCE 02
The OEE truth gap got too expensive to ignore
Plants measuring OEE manually or on monthly cycles consistently underestimate losses. One Georgia snack-food plant believed their OEE was 74%; real-time data showed 58%. That gap cost roughly $1.1M per year on a single line. Across an entire plant the gap compounds. Real-time dashboards close it; legacy MII rarely can.
FORCE 03
SAP MII end-of-support is a date on the calendar
Mainstream maintenance ends Dec 31, 2027. Extended ends Dec 31, 2030. Plants without a migration plan in motion by 2027 will face compressed timelines, consultant scarcity, and rising audit pressure on EOL software in food-grade environments.
The Food Plant Dashboards You Actually Need to Migrate
A typical food manufacturing MII estate carries between 15 and 40 dashboards, organized around the five operational domains every food plant runs. Below is the standard inventory with the food-specific KPIs that drive each one — and how each one maps to its AI-native equivalent.
DOMAIN 01
Production & OEE Dashboards
The most visible dashboards in any food plant. Live OEE on plant-floor screens. Availability, performance, and quality decomposed separately so operators respond to the actual loss type. Downtime ticker boards categorized by fault, asset, shift.
Live OEE — Continuously calculated, not end-of-shift
Availability / Performance / Quality — Broken out separately
Throughput vs. plan — Actual vs. target by line, by SKU
Top 5 downtime causes — Ranked automatically by total impact
Changeover duration — Critical for high-variety food plants
AI-Native upgrade: Real-time OEE replaces shift-end reporting. AI predicts downtime causes before they fully manifest. Plant-floor screens stay familiar; the engine behind them is decades ahead.
DOMAIN 02
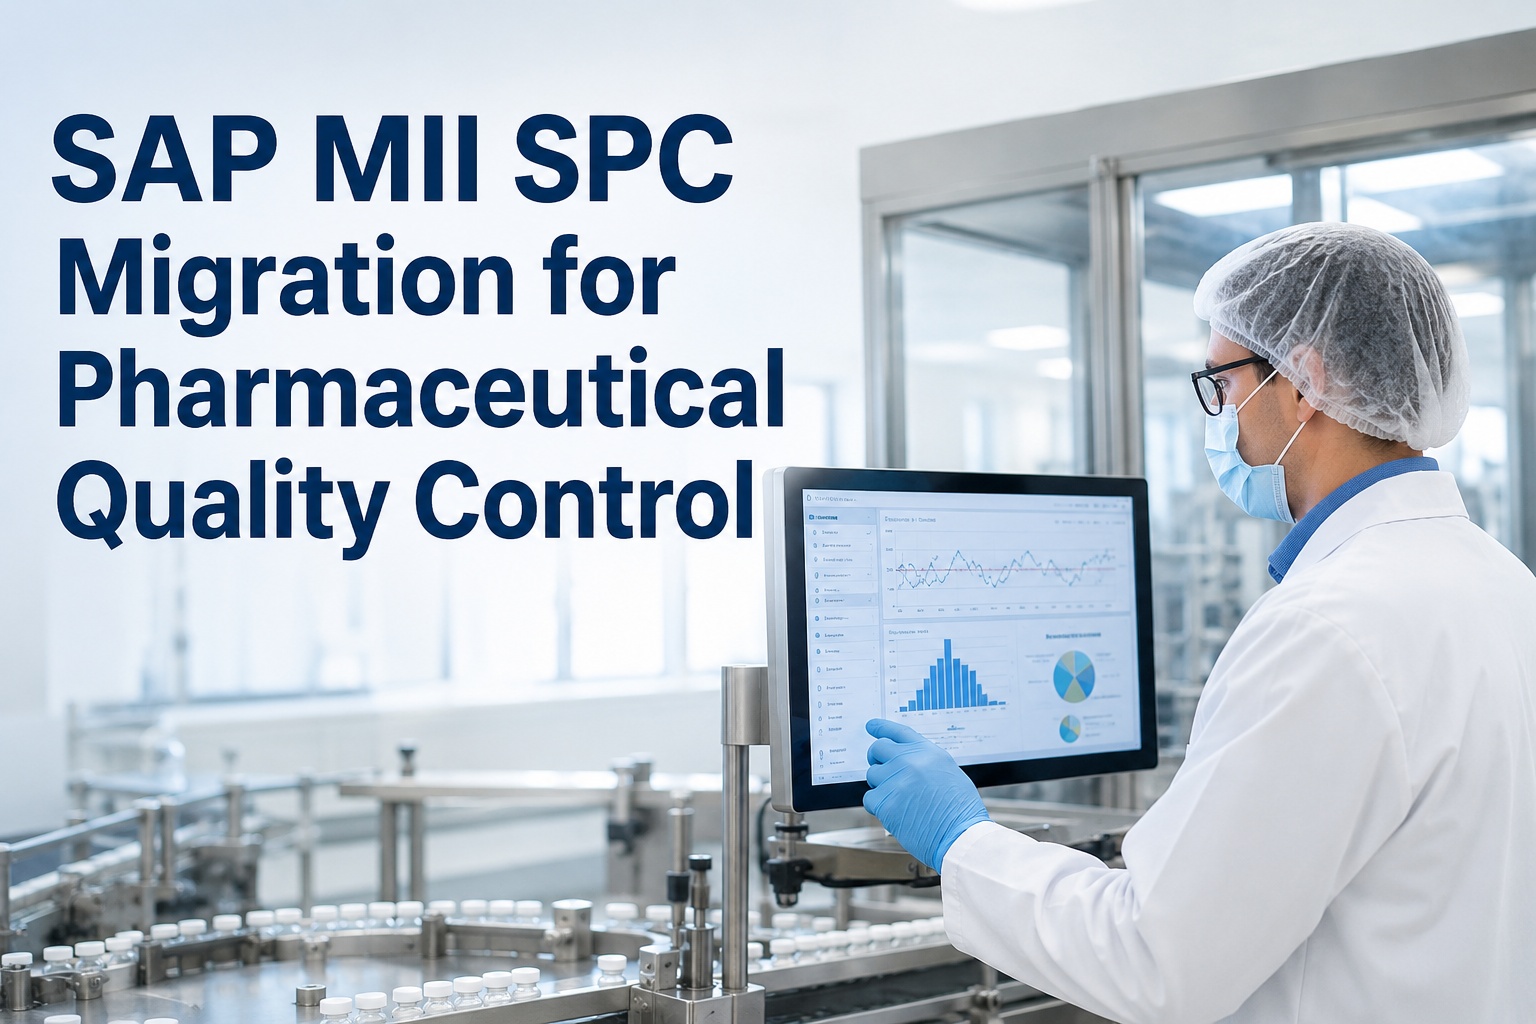
Quality & HACCP Dashboards
The dashboards auditors look at first. CCP (Critical Control Point) deviation logs. Sanitation completion vs. plan. Calibration currency for instruments. Allergen changeover verification. First-pass yield by line and shift.
CCP deviation rate — By line, by shift, by hour
First-pass yield — Quality losses upstream of inspection
Sanitation completion — Live progress vs. scheduled tasks
Calibration currency — Days remaining for every instrument
Allergen changeover verification — Documented swabs and signoffs
AI-Native upgrade: Vision AI catches defects faster than human inspection. Anomaly detection flags drift before CCP excursion. Audit packs generate in minutes, not days. FSMA 204 traceability satisfied automatically.
DOMAIN 03
Maintenance & Reliability Dashboards
The dashboards plant engineers live in. MTBF, MTTR, PM compliance for HACCP-critical equipment, asset health trends, work order backlog by criticality. Often the dashboards where MII customization runs deepest.
MTBF / MTTR — Calculated from work order timestamps
PM compliance — Especially for HACCP-critical assets
Asset criticality heat map — Risk-weighted equipment view
Work order backlog — Aging analysis by priority
Safety work order response time — Compliance-relevant metric
AI-Native upgrade: Predictive maintenance models flag bearing failures, motor wear, and seal degradation weeks ahead. PM plans optimize against asset criticality automatically. Maintenance moves from reactive to scheduled.
DOMAIN 04
Traceability & Genealogy Dashboards
The dashboards that matter most during a recall or audit. Forward and backward batch lineage. Ingredient-lot-to-finished-product traceability. Supplier non-conformance tracking. Mock recall trace-back times.
Forward / backward trace time — From ingredient lot to shipment
Mock recall completion time — Required by FSMA 204
Supplier non-conformance — Trend by supplier, by ingredient
Batch lineage completeness — Gaps in chain-of-custody
FSMA 204 KDE coverage — Key Data Elements captured
AI-Native upgrade: Automated KDE capture eliminates manual entry. AI accelerates mock recall trace-backs from hours to minutes. Supplier patterns surface before they become quality events.
DOMAIN 05
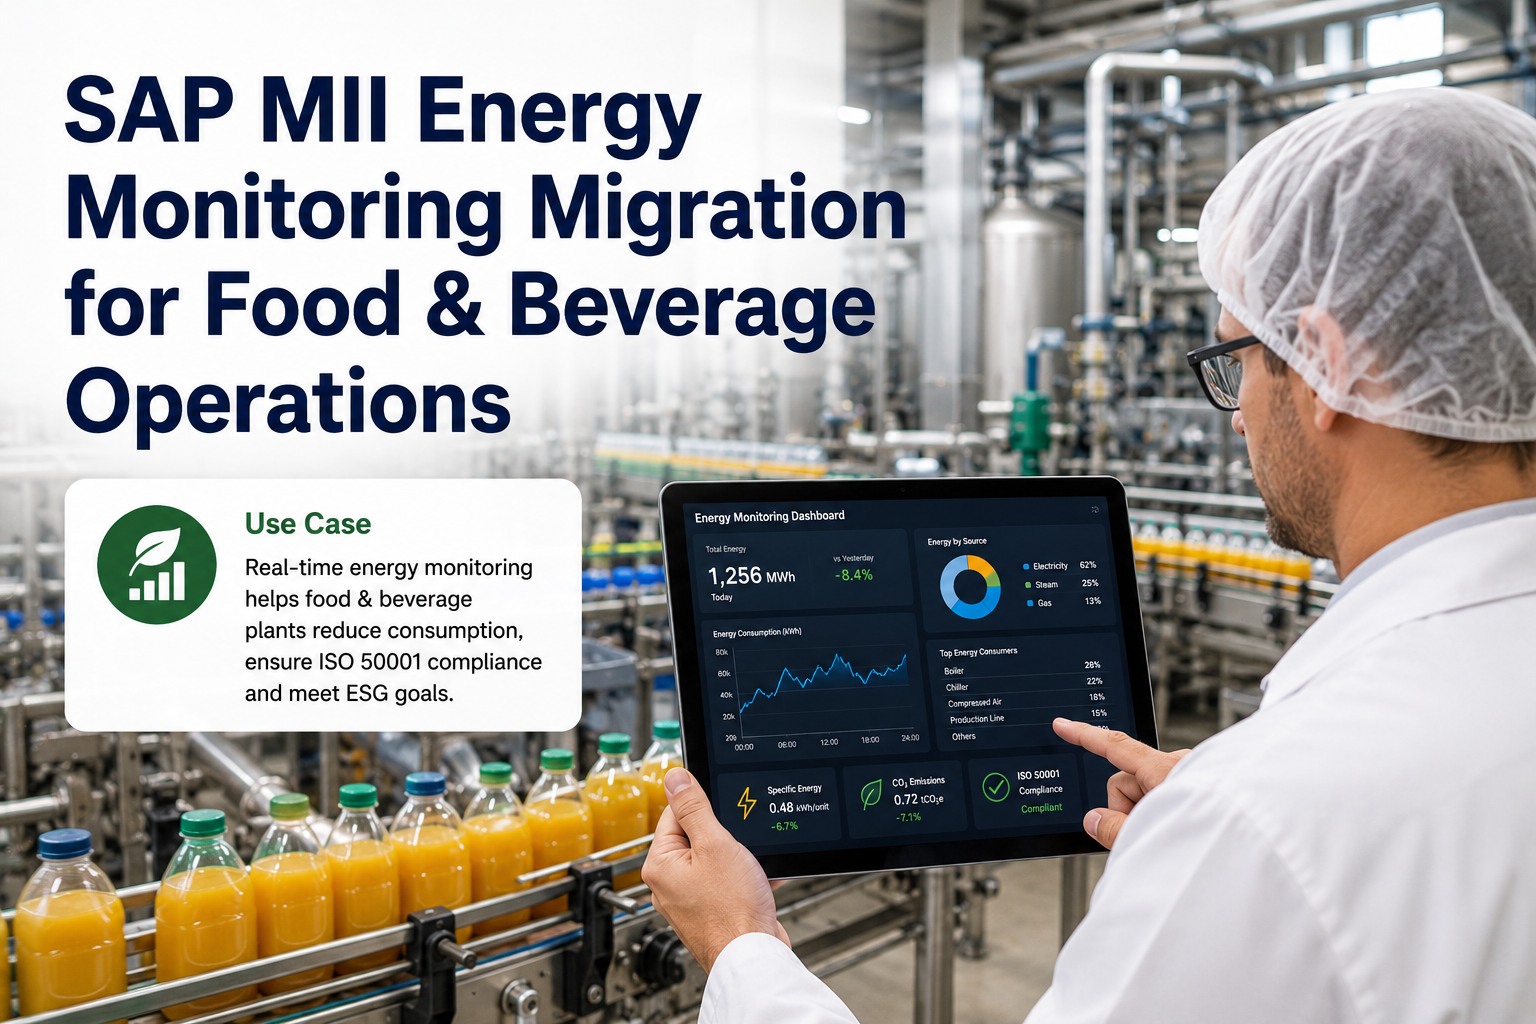
Energy, Yield & Sustainability Dashboards
The dashboards leadership increasingly asks about. Energy intensity per unit produced. Water consumption per batch. Yield losses by stage. Carbon-footprint reporting for retailer sustainability scorecards.
Energy per unit produced — kWh per finished case or kg
Water consumption per batch — Critical for CIP-heavy plants
Yield loss by stage — Where material disappears in the process
Scrap / rework rate — By SKU, by line, by shift
Carbon intensity — Per unit, per SKU, per facility
AI-Native upgrade: Energy optimization recommendations from AI copilots. Real-time yield-loss attribution. Sustainability scorecards generated from live data, not month-end estimates.
Five Dashboard Domains. Same Plant Floor. Modern AI Engine Behind Them.
Food plants do not need to choose between continuity and modernization. The dashboards your operators recognize stay recognizable. The AI underneath becomes predictive, real-time, and audit-ready. iFactory's food manufacturing migration playbook is built for this specific transition.
What Changes for Each Role in the Food Plant
Technology only matters when it changes how people work. Here is what each person on a food manufacturing site actually experiences when MII dashboards are replaced with AI-native equivalents.
LINE OPERATOR
Same dashboard layout, but it tells the truth in real time.
The OEE board is in the same place. The downtime ticker still scrolls. But numbers update continuously instead of once per shift. Alerts surface before a problem becomes a stoppage. Operators run with confidence instead of guessing.
PRODUCTION SUPERVISOR
Knows about deviations within minutes, not at end of shift.
CCP deviations, allergen changeovers, sanitation gaps — all surface as they happen. AI suggests root causes from similar past events. The supervisor stops being the bottleneck for shift-handover reports.
MAINTENANCE LEAD
Schedules repairs days ahead, not minutes.
Predictive AI flags bearing wear, motor anomalies, and seal degradation weeks before failure. PM compliance for HACCP-critical equipment becomes automatic. Emergency calls drop. Overtime drops. Sanity returns.
QA & FOOD SAFETY MANAGER
Audit prep becomes a five-minute report download.
HACCP logs, CCP deviation history, sanitation completion, calibration currency — all live, all timestamped, all linked. FDA, USDA, BRCGS, SQF auditors get exactly what they ask for, when they ask for it.
PLANT MANAGER
One dashboard, every line, every shift, real-time.
No more waiting for the morning meeting to learn what happened yesterday. Live OEE, live yield, live energy, live quality — across every line. Anomalies surface with AI-suggested explanations. Decisions get made on what is happening, not what already did.
OPERATIONS DIRECTOR
Compare plants, find best practices, scale them.
Cross-site KPIs in one view. Identify the best-performing plant on a metric and the worst on the same. Surface best practices for replication. Walk into board meetings with answers grounded in today's data.
The Migration Pattern: Lift and Modernize, Site by Site
Food manufacturers cannot accept big-bang cutovers. Production must continue. Quality must hold. Auditors must stay satisfied. The migration pattern that works in food plants is phased — lift the dashboards onto the new platform, validate behavioural equivalence, modernize one domain at a time, scale site by site.
WEEKS 1–4
Discovery & Dashboard Inventory
Catalog every MII dashboard — OEE boards, HACCP panels, maintenance heat maps, traceability lookups, energy dashboards. Tag each with current owner, usage frequency, and food-specific compliance dependencies. Tag each for preserve, transform, or retire.
WEEKS 4–10
Lift & Validate Preserve-Tagged Dashboards
Translate the dashboards operators rely on onto iFactory. Same layout, same KPIs, same colour codes. Validate behavioural equivalence by running both platforms in parallel against identical production data. Operations and QA sign off.
WEEKS 10–16
Modernize Transform-Tagged Dashboards
Add AI-native capabilities to the dashboards that benefit most: predictive maintenance on critical assets, vision QC on inspection lines, anomaly detection on CCP streams, energy optimization on CIP-heavy systems. New capability stacks on top of preserved logic.
WEEKS 16–24
Pilot Site Cutover with Hypercare
Cut over the first site. Run new and MII in parallel for at least one full production cycle. Hypercare for 30–60 days. Operators, QA, maintenance, and plant management all sign off before considering the cutover complete.
MONTHS 6–18
Roll Out Across Remaining Sites
Site-by-site rollout informed by pilot lessons learned. Each site gets parallel run, hypercare, and stable-quarter validation before MII is retired locally. Cross-site dashboards activate as sites come online.
MONTH 18+
MII Decommissioning & Compliance Reset
Formally retire MII components. Archive historical data for FSMA 204 retention requirements. Update audit documentation across BRCGS, SQF, FDA, USDA preparation files. Refresh cyber insurance to reflect the modernized posture.
SAP MII vs. AI-Native: Side-by-Side for Food Plants
The honest comparison, framed for the food-industry workload specifically. Both have legitimate strengths. The shift toward AI-native is real, and it is happening for specific reasons.
Real-Time OEE. AI-Driven Quality. Audit-Ready by Default.
Food plants modernizing their dashboards report 15% average OEE lift, 4% reduction in product waste, and dramatically faster audit prep. iFactory's food manufacturing migration playbook delivers first quick wins inside 4–12 weeks, with full site cutover inside 6 months.
Frequently Asked Questions
Will our HACCP and FSMA 204 documentation still be acceptable to FDA and USDA auditors after migration?
Yes — and typically stronger. AI-native platforms generate audit-ready logs with full timestamping, deviation-to-corrective-action linkage, and FSMA 204 KDE coverage. FDA, USDA, BRCGS, and SQF auditors increasingly prefer real-time digital evidence over end-of-month PDF binders.
Book a Demo to see sample audit packs.
Can we keep our existing dashboard layouts so operators are not retrained from scratch?
Yes. The lift-and-shift approach preserves layout grammar, tab order, colour codes, and KPI conventions operators already trust. The runtime modernizes; the operator experience stays familiar. Modernization layers (vision AI, predictive maintenance, mobile views) are added as additions, not replacements.
Talk to Support about dashboard preservation.
How does AI-driven predictive maintenance work in food plants with frequent sanitation cycles?
AI models trained on food-plant signatures account for sanitation cycles, CIP runs, and changeovers as normal patterns rather than anomalies. Failures, by contrast, present as drift outside those expected patterns. Most plants see meaningful predictive value within 60 days of model training on their specific equipment.
Book a Demo for food-plant predictive examples.
What about our data servers connecting to historians like OSIPi, IP21, or iHistorian?
All major historians used in food manufacturing — OSIPi, IP21, iHistorian, GE Proficy — connect via the modern platform's native connector framework. Tag mappings and sample rates migrate from existing MII configurations. Most connections re-authenticate and run with no logic changes.
Talk to Support for historian patterns.
Can the new platform handle the data volumes of a high-line-count food plant?
Yes. Modern AI-native platforms are built for industrial telemetry scale — thousands of tags, hundreds of cameras, continuous CCP streams. The architecture distributes ingestion across edge gateways and centralizes only the data that needs central processing. Performance is rarely the binding constraint.
Book a Demo for capacity discussions.
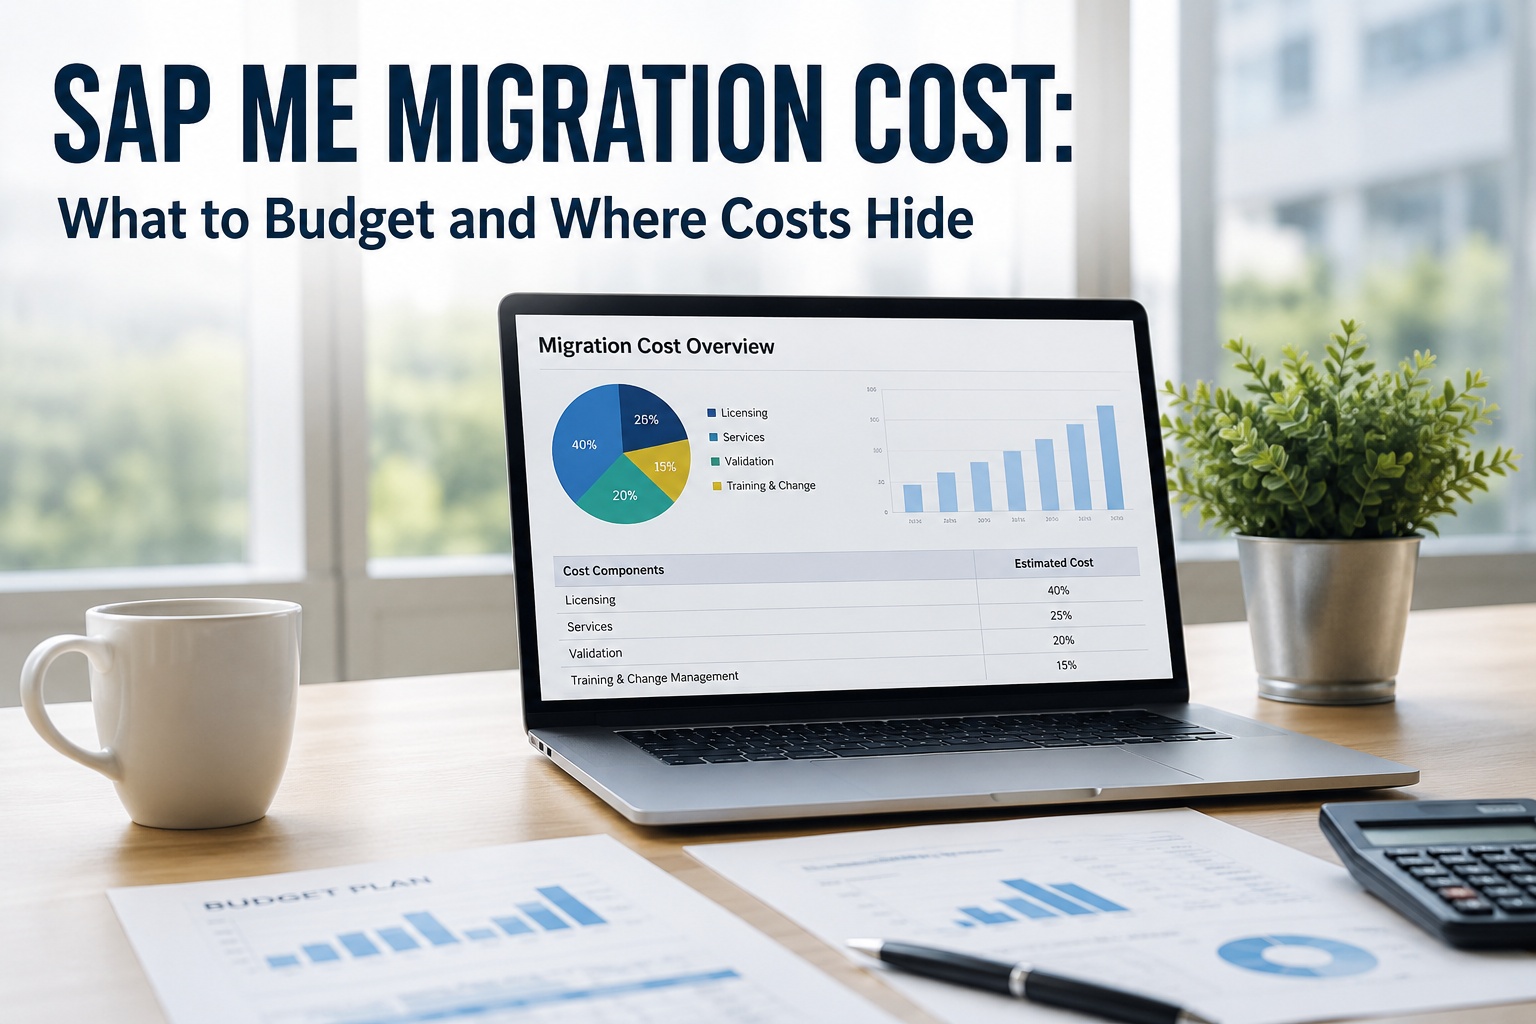
What does the migration cost compared to staying on MII through 2030?
It depends on plant size and customization depth, but the math typically favors migration. Staying on MII through 2030 carries premium support fees from 2028, rising consultant scarcity costs, cyber insurance escalation, and growing audit pressure. Migration delivers OEE lifts, waste reduction, and energy savings that often pay back the program inside 12–18 months.
Talk to Support for a TCO model.
Your Food Plant Dashboards Have a Future. The Engine Behind Them Doesn't Have to Be Legacy.
Five dashboard domains. Hundreds of food-specific KPIs. Strict regulatory requirements. Operators who need continuity. Auditors who need evidence. Leadership who needs answers. iFactory's food manufacturing migration playbook handles all of it — preserving what works, modernizing what does not, and delivering measurable results inside one quarter.
15% average OEE lift after migration
4% reduction in product waste through AI
FSMA 204, HACCP, BRCGS, SQF compliance built in
First quick wins live in 4–12 weeks
Site-by-site rollout with operator continuity