AI vision inspection models rarely fail at deployment — they fail at data preparation, and the failure surfaces months later as a quality escape or an audit finding. A model trained on an imbalanced dataset, labeled inconsistently by three annotators, and validated only against training-adjacent samples will report 97% accuracy at commissioning and drop to 82% within eight weeks of production exposure. iFactory's AI Vision Model Training and Validation Checklist covers every gate in the model lifecycle — data collection, annotation standards, class balance, augmentation, dataset splitting, training, accuracy criteria, and pre-deployment sign-off. Facilities using structured model validation workflows report 62% fewer quality escapes tied to model drift and consistently sustain 99%+ accuracy after go-live. Reach out to Contact Support for the working template.
Model Training Checklist · Dataset Preparation · Validation Standards · Accuracy Thresholds
AI Vision Model Training and Validation Checklist — Every Gate From Dataset to Production Sign-Off
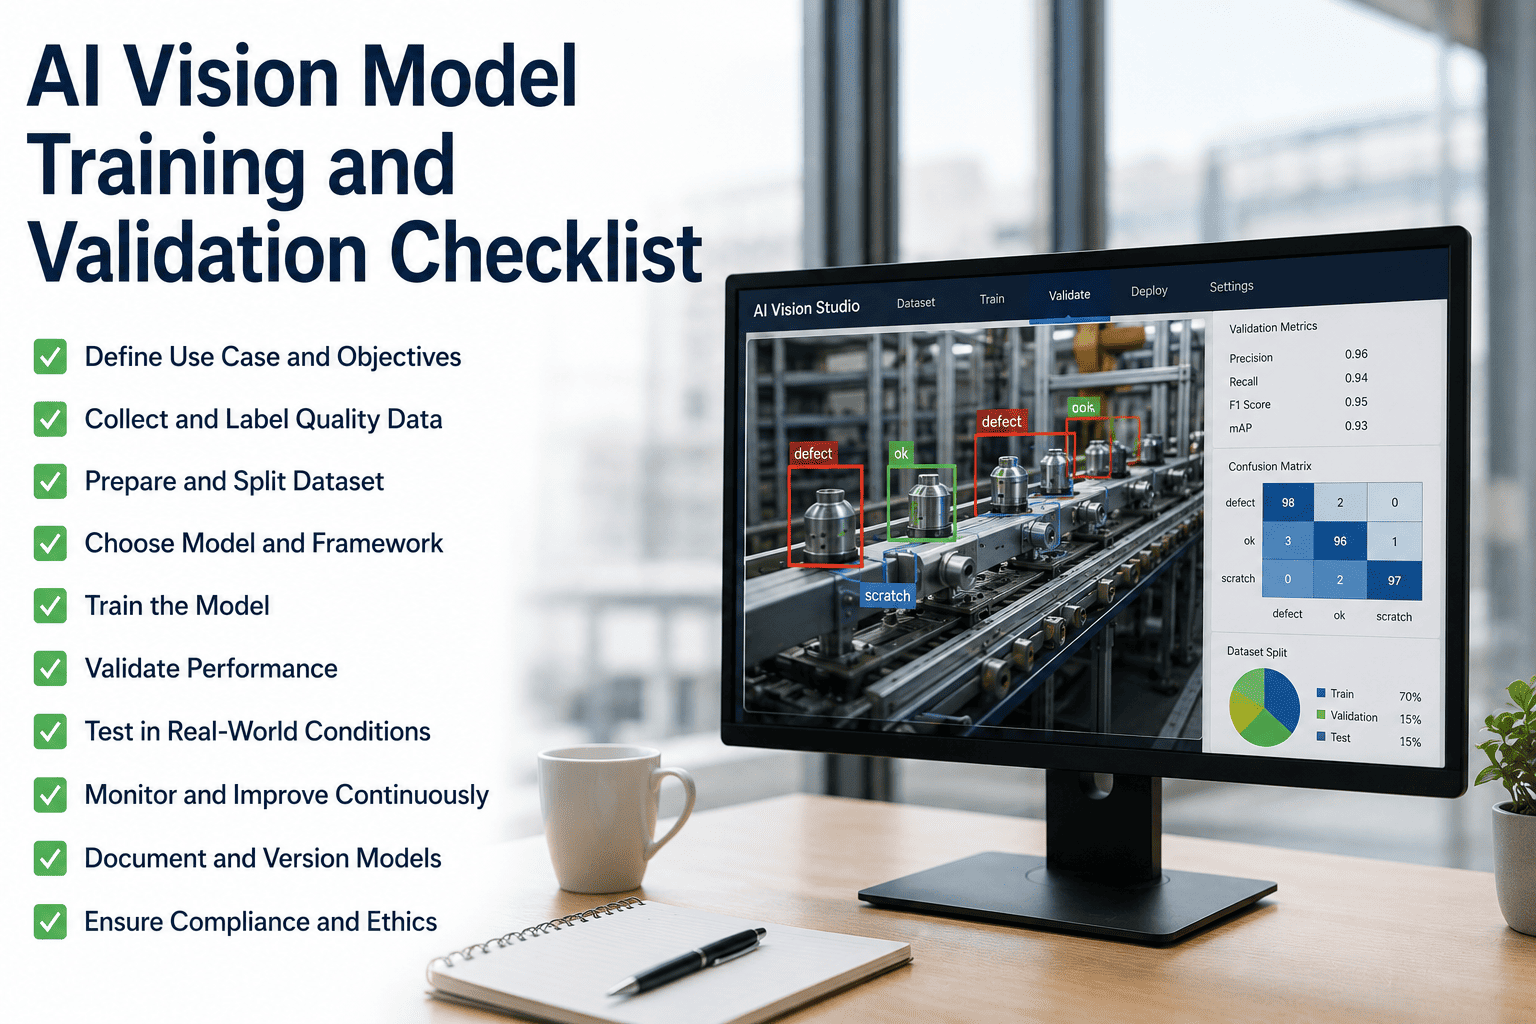
iFactory's structured 4-phase training checklist covers data collection, image labeling standards, class balance, augmentation strategy, training/validation splits, and accuracy criteria — so every model reaching your production line has earned its specification.
62%
Fewer quality escapes tied to model drift with structured validation
44%
Shorter time from data collection to validated production deployment
99%+
Sustained accuracy on trained defect categories after go-live
4 wk
Average time from labeled dataset to validated production model
Four Silent Failure Modes That Structured Model Validation Catches
Most AI vision projects assume that a good training accuracy metric equals a production-ready model. That assumption ignores the four failure modes that dominate real-world performance: annotation inconsistency between labelers, class imbalance masked by aggregate scores, data leakage between training and test splits, and confidence threshold selection that optimizes precision at the cost of recall. Each produces a model that passes commissioning and fails quietly in production. The checklist that follows gates each failure mode with a specific verification step, so no model advances without evidence the current phase is clean.
01
Annotation Inconsistency
Three annotators labeling the same defect produce three different bounding boxes; the model learns the confusion, not the signal. Inter-annotator agreement below 0.85 is the single largest source of production accuracy loss.
02
Hidden Class Imbalance
A dataset with 95% good parts across seven defect classes produces per-class counts as low as 20 images. Aggregate accuracy of 96% is meaningless when the model defaults uncertain cases to "pass".
03
Train-Test Data Leakage
When multiple images of the same physical part appear in both training and test sets, test accuracy becomes memorization, not generalization. This is the failure mode behind most "97% at commissioning, 82% in production" trajectories.
04
Threshold Miscalibration
A model tuned to maximize F1 on a balanced test set may produce false-negative rates 3× the target when deployed against real production class distributions. Threshold selection must be validated against production-representative data.
Phase 1: Dataset Preparation — Data Collection, Labeling, and Class Balance
Phase 1 determines 70% of final production accuracy — before a single training epoch runs. Data collection defines what the model can learn, labeling standards define how consistently that signal is delivered, and class balance verification determines whether rare defects will actually be learned. This phase must be formally reviewed before any training compute is committed.
Data Collection Planning
Define target defect taxonomy with production and quality stakeholders
Document every defect class the model must detect with reference images and written descriptions. Ambiguous definitions produce inconsistent labeling downstream.
Establish per-class sample count target — 500 to 2,000 labeled images
Rare defect classes with fewer than 100 samples require targeted collection or documented augmentation coverage to reach adequate representation.
Capture diversity across shifts, batches, lighting, and material variation
A dataset collected in one day under one lighting setup will not generalize to production six months later. Plan for multi-week, multi-batch capture windows.
Document camera, lens, exposure, and lighting configuration
Any deviation between capture setup and production setup reduces model transfer. Record every hardware and configuration parameter.
Image Labeling and Annotation Standards
Publish annotation guideline document with visual examples
Written rules for bounding box tightness, partial-defect handling, occlusion, and ambiguous cases. Every annotator works from the same reference.
Measure inter-annotator agreement on a 100-image calibration set
Two or more annotators label the same 100 images; calculate IoU or Cohen's kappa. Target ≥0.85; below 0.75 requires guideline revision before proceeding.
Implement second-annotator review on rare classes
Every image in a defect class with fewer than 200 samples must be reviewed by a second annotator — labeling errors disproportionately impact rare-class learning.
Class Balance Verification
Generate per-class sample count and imbalance ratio report
Ratio between largest and smallest class should stay under 10:1. Ratios above 20:1 require documented imbalance mitigation.
Select and document imbalance mitigation strategy
For ratios above 10:1, choose weighted loss, minority-class oversampling, focal loss, or targeted synthetic augmentation — and record the rationale.
Phase 2: Training Setup — Splits, Augmentation, and Hyperparameter Baselines
Phase 2 converts the prepared dataset into an executable training run. The consequential decisions are the split strategy, augmentation pipeline, and hyperparameter starting point. Errors here surface only as inconsistency between training metrics and production behavior — the model appears to work until it doesn't. Book a Demo to see how iFactory's pipeline enforces these gates before any GPU run is dispatched.
Training / Validation / Test Split
Apply stratified split at documented ratio (70/15/15 or 80/10/10)
Stratified sampling preserves class distribution across all three subsets — critical for imbalanced datasets where random splits can leave the test set without rare-class samples.
Verify no data leakage between splits
Multiple images of the same physical part, near-duplicates, and multiple crops must all live in the same split. Zero overlap by source identifier before training.
Reserve test set as write-once, held-out artifact
The test set is not accessed during training or hyperparameter search. Repeated access turns it into a second validation set and inflates final accuracy.
Augmentation Strategy
Apply augmentation only to training split — never validation or test
Augmenting validation or test images inflates apparent accuracy and disconnects the metric from real production performance. Augmentation lives in the training loop only.
Design augmentations that preserve label semantics
Horizontal flip is safe for random-orientation parts but wrong for directional features. Extreme rotation may create image conditions the camera cannot physically produce.
Set augmentation multiplier per class based on imbalance ratio
Rare classes may receive 5× to 10× multiplier while abundant classes receive 1× to 2×. Goal is to balance effective per-epoch sample count, not to blindly multiply.
Hyperparameter Baseline
Document baseline learning rate, batch size, and epoch count
Every training run starts from a documented baseline derived from prior projects of similar dataset size. Hyperparameter sweeps happen from a known starting point.
Set early stopping criteria on validation loss
Training halts when validation loss plateaus or climbs. Running past this point overfits training data and produces perfect training accuracy paired with poor generalization.
See iFactory's Training Pipeline Enforce Every Gate Automatically
iFactory's AI Vision platform integrates this checklist directly into the training pipeline — inter-annotator agreement, split leakage verification, class balance, and threshold calibration run as gating checks before promotion to production. The demo walks through your dataset structure and shows how the platform blocks a training run when a gate fails.
Phase 3: Validation and Testing — Accuracy Thresholds and Golden Datasets
Phase 3 is where a trained model earns — or fails to earn — production entry. Aggregate accuracy is insufficient; the model must be evaluated on per-class precision and recall, confusion matrix behavior, confidence score distributions, and a golden reference dataset representing full production conditions. Facilities that formalize Phase 3 gating catch roughly 8 of 10 models that would have degraded within their first production quarter.
Accuracy Threshold Criteria
Verify overall recall ≥99% on held-out test set
Recall is the customer-facing metric — every missed defect is a potential quality escape. 99% is the baseline for most industrial applications.
Verify false-positive rate ≤2% on test set
FPR above 2% creates operator fatigue, rework cost, and eventual override behavior that undermines the whole inspection system.
Report per-class precision, recall, and F1 — not just aggregate
An aggregate F1 of 0.94 can mask a single class at F1 0.62. Every class must independently meet acceptance criteria.
Golden Reference Dataset Validation
Assemble golden dataset separate from training and test splits
200 to 500 curated images covering all defect classes plus edge cases and hard negatives — for one-time acceptance and ongoing drift monitoring.
Run confusion matrix analysis on golden set
Every misclassification is reviewed. Pattern analysis identifies whether errors cluster around specific defects, lighting, or part orientations.
Analyze confidence distribution on true positives and negatives
High overlap between classes indicates a model that is technically accurate but operationally fragile — small production shifts will flip its behavior.
Threshold Calibration
Select production threshold from precision-recall curve
Threshold is chosen to hit target recall while keeping FPR in budget — not to maximize F1 on a balanced test set.
Validate threshold against production-representative class distribution
Test-set class ratios are typically balanced; production ratios are heavily skewed toward "good" parts. Re-verify threshold behavior before locking it in.
Phase 4: Deployment Sign-Off — Documentation, Monitoring, and Governance
Phase 4 converts a validated model into a production asset with the documentation, monitoring, and governance needed to sustain accuracy across its operational life. This phase is skipped in most projects — and it is the single largest reason models that pass Phase 3 still degrade in production. Sign-off must include model version records, deployment configuration, monitoring alerts, and defined retraining triggers before the first inference serves a production part.
Documentation Package
Record model version identifier and training dataset hash
Every production model traceable to the exact dataset, training config, and framework version used. IATF 16949 and FDA 21 CFR Part 11 require this traceability.
Publish acceptance test report with all metrics against pass criteria
Per-class precision, recall, F1, confusion matrix, threshold rationale, and golden dataset performance — signed by quality engineering before authorization.
Production Monitoring Setup
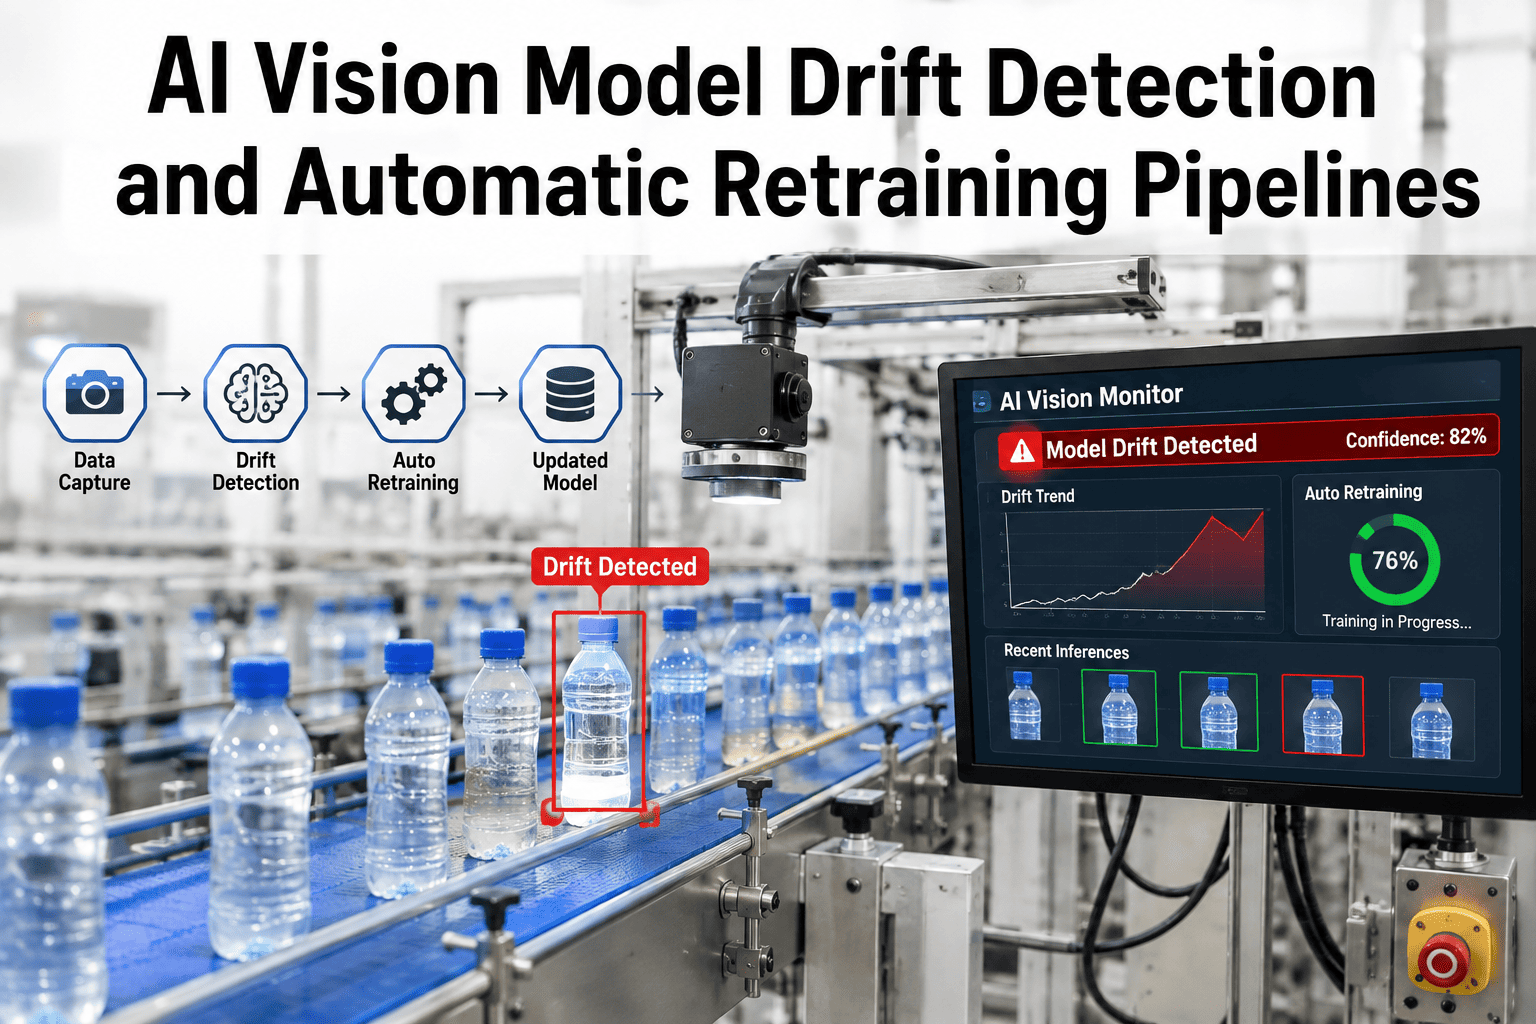
Configure daily FNR and FPR trend monitoring with alerts
Rolling daily metrics against baseline. Alerts trigger on trend deviations of 0.5 percentage points per week or absolute specification breach.
Schedule weekly golden dataset regression test
Golden dataset re-run weekly against the production model. Drift beyond ±1% from acceptance baseline triggers formal investigation.
Retraining Governance
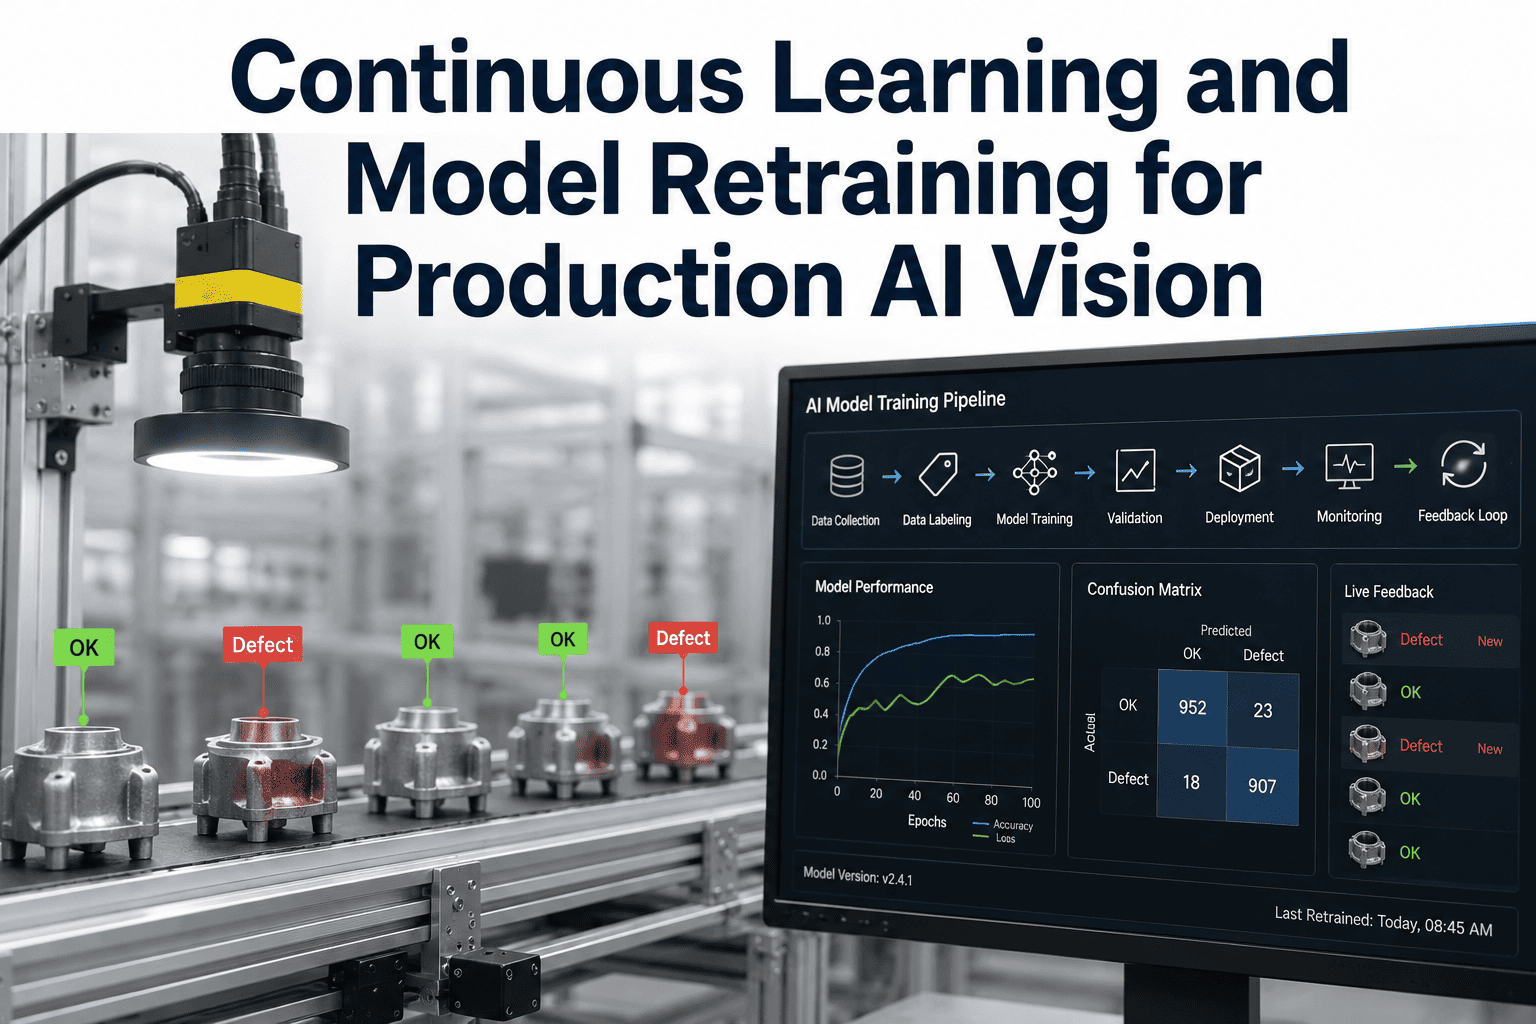
Define retraining trigger criteria with quality engineering sign-off
Document specific FNR, F1, or novel-defect conditions that trigger retraining. Uncontrolled retraining produces model churn.
Establish rollback procedure and previous-version retention
Every deployment must have a documented rollback path to the previous validated version, with weights retained for at least two production cycles.
Acceptance Criteria Reference: Metric Targets and Action Thresholds
The table below captures the numerical targets and warning thresholds referenced across all four phases. These reflect consensus practice across iFactory deployments and should be reviewed against your specific application, customer specifications, and regulatory context before adoption as facility standards.
Swipe horizontally to view full table on mobile
| Metric / Gate |
Phase |
Target |
Warning Zone |
Action Required |
| Inter-Annotator Agreement |
Phase 1 |
≥0.85 IoU / Kappa |
0.75–0.85 |
Revise guidelines; retrain labelers |
| Per-Class Sample Count |
Phase 1 |
≥500 per class |
100–500 |
Targeted collection or augmentation |
| Class Imbalance Ratio |
Phase 1 |
≤10:1 |
10:1 to 20:1 |
Apply weighted loss or resampling |
| Train / Val / Test Split |
Phase 2 |
70/15/15 stratified |
Non-stratified |
Re-split with class stratification |
| Data Leakage |
Phase 2 |
Zero overlap |
Any overlap |
Halt; regenerate by source ID |
| Test Set Recall |
Phase 3 |
≥99% |
97–99% |
Retrain with more minority samples |
| Test Set False Positive Rate |
Phase 3 |
≤2% |
2–4% |
Threshold recalibration; hard-negative mining |
| Per-Class F1 Score |
Phase 3 |
≥0.90 all classes |
0.85–0.90 |
Class-level error analysis and targeted retrain |
| Golden Dataset Weekly Drift |
Phase 4 |
Within ±1% of baseline |
±1% to ±3% |
Root cause investigation |
| Production FNR Trend |
Phase 4 |
Stable at baseline |
Rising >0.5pp/week |
Formal drift investigation and retrain review |
Expert Perspective: What ML Engineers Say About Validation Discipline
The models that fail in production almost never fail because the architecture was wrong. They fail because someone was in a hurry during data preparation, because inter-annotator agreement was never measured, because the test set was contaminated with training data, or because the acceptance threshold was tuned on a balanced dataset that looks nothing like production. Across fifteen years of computer vision deployments in automotive, semiconductor, and medical device manufacturing, the pattern is consistent — the projects that hold accuracy for three to five years spent 70% of their effort on data quality and validation discipline. The projects that spent 30% on data and 70% chasing state-of-the-art architectures shipped fast, looked impressive at acceptance, and quietly degraded within a quarter. A phase-gated checklist makes the invisible failures visible before they lock into production, and creates the audit trail that keeps ML governance defensible when the regulators or customer quality team asks how you know the model works.
— Principal ML Engineer, U.S. Industrial AI Quality Systems Group · 15 Years in Production Computer Vision · iFactory Reference 2026
8 of 10
Failing models caught by Phase 3 gating before go-live
70%
Of production accuracy is determined during Phase 1 data preparation
3–5x
Higher cost of fixing data quality issues post-deployment vs Phase 1
Frequently Asked Questions
How many labeled images are needed to train a production-grade defect detection model?
The realistic working range is 500 to 2,000 labeled images per defect class for most industrial applications, with rare classes needing at least 100 to 200 samples supplemented by augmentation. Total dataset sizes typically land between 5,000 and 25,000 images. What matters more than raw count is diversity — samples must cover the full range of production lighting, material batches, part orientations, and shift-to-shift variability. A dataset of 10,000 near-identical images produces a model that fails when a single condition shifts, while a smaller but diverse dataset generalizes far better.
Book a Demo to see how iFactory's data readiness assessment quantifies coverage before training begins.
What is the difference between recall, precision, and F1 — which one matters most for defect inspection?
Recall is the percentage of true defects the model catches; precision is the percentage of model defect calls that are actually defects; F1 is the harmonic mean of the two. For defect inspection, recall is almost always the primary metric because every missed defect is a potential customer escape and warranty exposure. Precision matters as a secondary metric because low precision creates operator fatigue and rework cost. F1 is useful for comparison but should never be the sole gating metric — a model at 95% F1 can still be shipping unacceptable false-negative rates on rare but critical defect classes.
How does data augmentation help — and how can it backfire?
Augmentation helps the model learn invariance to conditions that vary in production but do not change what the part actually is — small rotations, lighting shifts, position offsets, minor scale changes. Applied carefully to the training split only, it improves generalization and helps rebalance minority classes. It backfires when augmentation is applied to validation or test data (inflating metrics), when transformations violate imaging physics (rotations no camera could produce), or when it substitutes for genuinely diverse data collection. Augmentation should extend a diverse dataset, never replace one.
Contact Support for the augmentation configuration templates used across iFactory deployments.
When should a deployed model be retrained rather than left in production?
Retraining should be triggered by specific documented conditions, not by calendar interval. The primary triggers are: sustained rise in false-negative rate greater than 0.5 percentage points per week, F1 score degradation exceeding 5% from acceptance baseline on the golden dataset, appearance of novel defect morphologies, or documented process changes that alter part appearance. Facilities with stable production may go 12 to 18 months without retraining; facilities with frequent process changes may retrain every three to six months. Both are valid — the discipline is having the triggers defined in advance rather than reacting to customer complaints.
What documentation is required to make an AI vision model deployment audit-ready?
Audit-ready documentation covers three layers: dataset artifacts (source images, annotations, dataset version hash, class balance report, inter-annotator agreement records), model artifacts (training config, framework version, weights, hyperparameters, training log, acceptance test report), and governance artifacts (approval signatures, deployment date, retraining trigger criteria, rollback procedure, monitoring configuration). IATF 16949, FDA 21 CFR Part 11, and ISO 9001 audits all expect this three-layer traceability for any automated inspection system. iFactory's platform maintains all three automatically in a format directly exportable for customer and third-party audits.
Stop Shipping Models That Look Right at Commissioning and Drift in Production
iFactory's AI Vision platform enforces every gate in the training and validation checklist automatically — from inter-annotator agreement through split leakage verification, class-level acceptance criteria, and production drift monitoring. See the full workflow demonstrated on a dataset structured around your specific defect classes, capture hardware, and customer quality specifications.