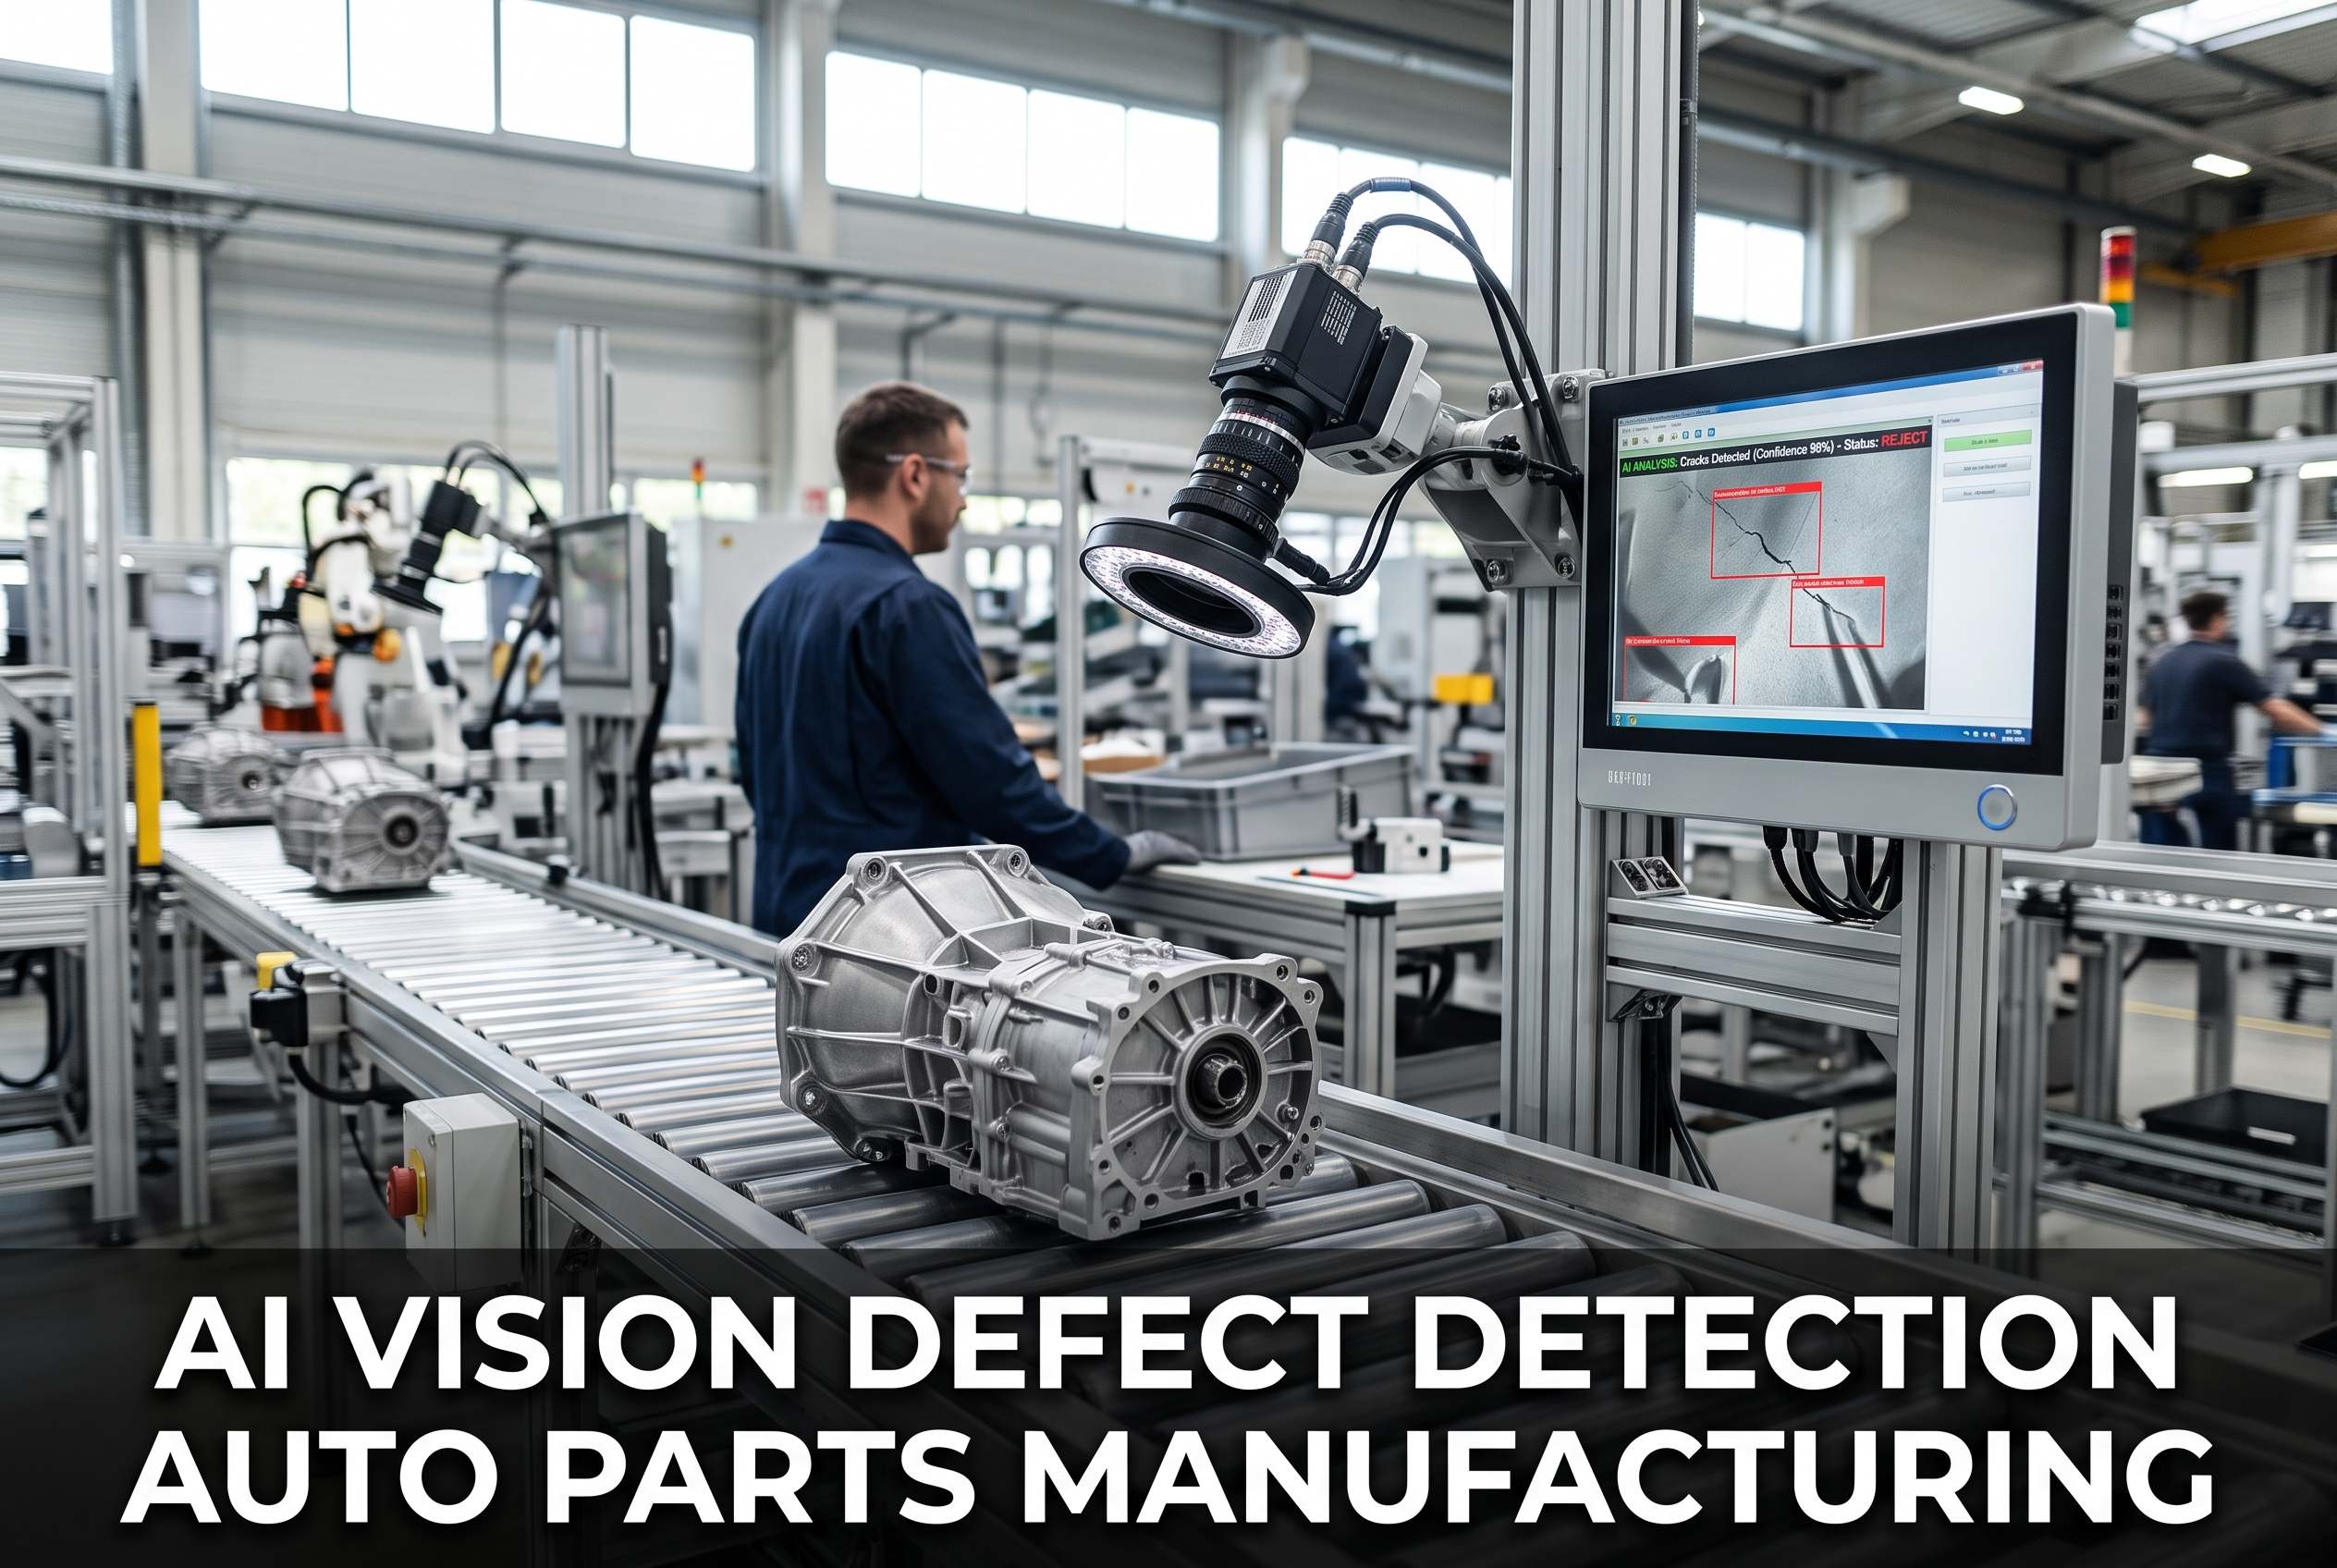
The line lead at your stamping press exit is flagging three parts out of every hundred for burr and porosity, and by the time the quality team pulls the sample tray, the bin of suspect parts has already moved to the machining cell. Auto parts plants under NAICS 3363 live and die by PPM defect rates, scrap cost, and customer PPAP compliance — and most are still relying on end-of-line sampling that catches problems long after the upstream tooling drift that caused them. AI vision dashboards and embeddable widgets change that by inspecting 100% of items in motion at the press exit, routing every part to pass, rework, or scrap through your existing Level 2 PLC and surfacing the defect trend on a live dashboard before a single bad part reaches the customer. This is what modern auto parts quality management looks like when machine vision, MES identity mapping and real-time OEE analytics run as one closed loop on the plant floor.
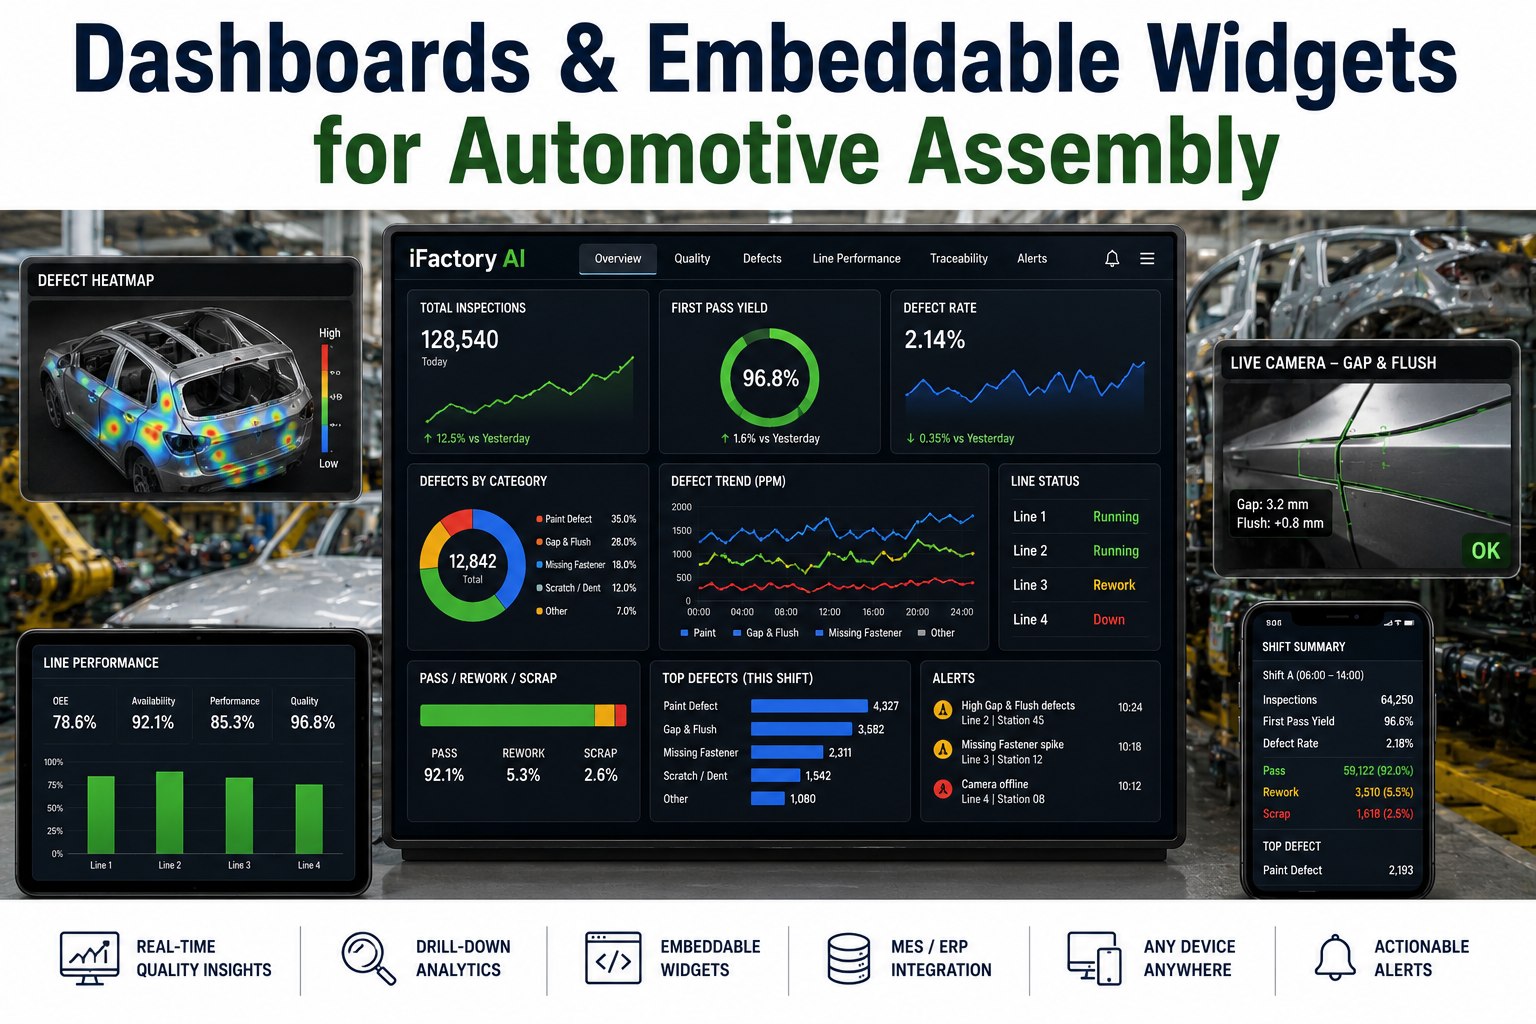
What an AI Vision Dashboard Actually Shows on an Auto Parts Line
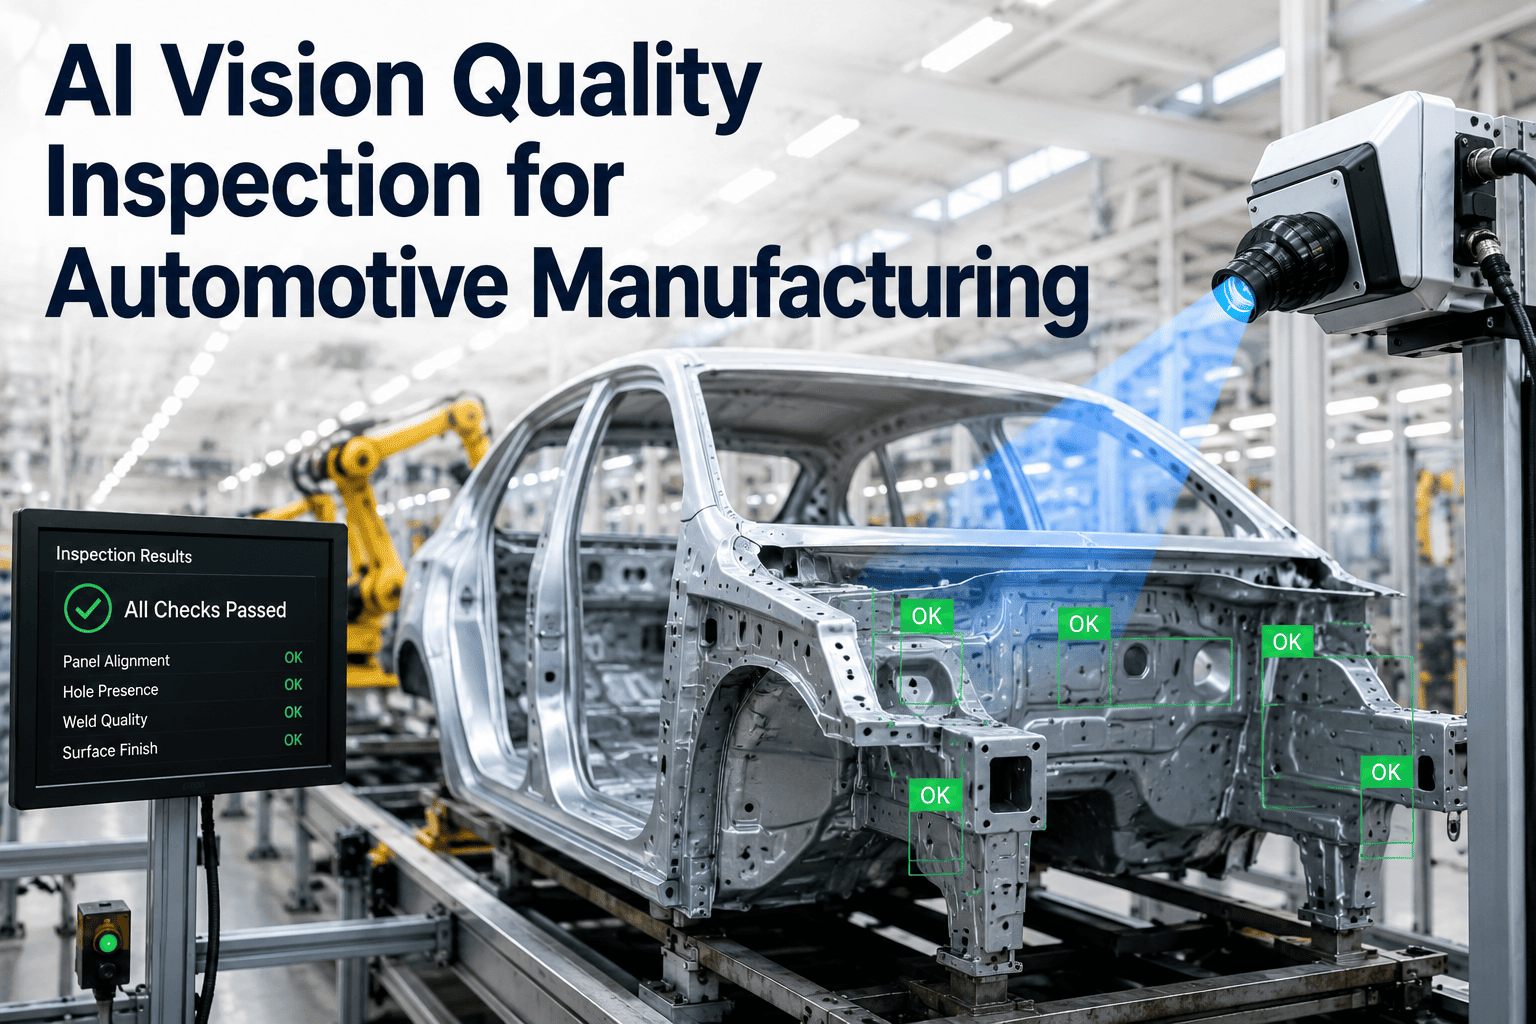
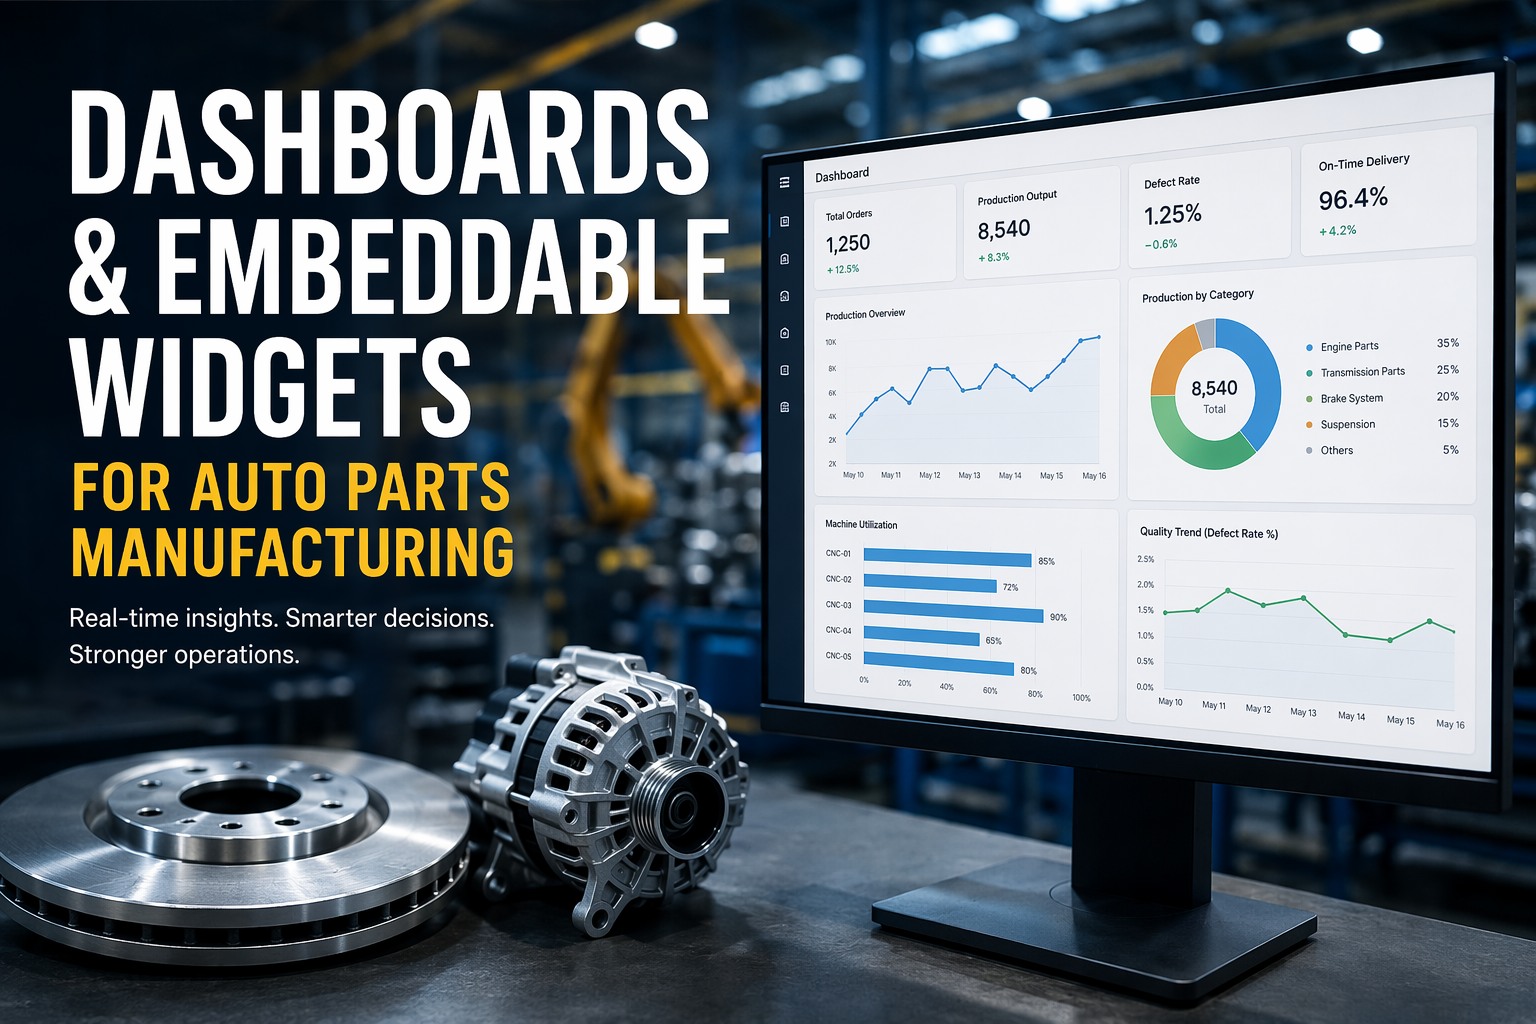
Every widget on the screen is tied to a camera, a PLC tag, or an MES record — not a manually refreshed spreadsheet. Here is what a plant-floor dashboard looks like when 100% in-motion inspection is live.
The Six Defect Classes AI Vision Catches at Press Exit Speed
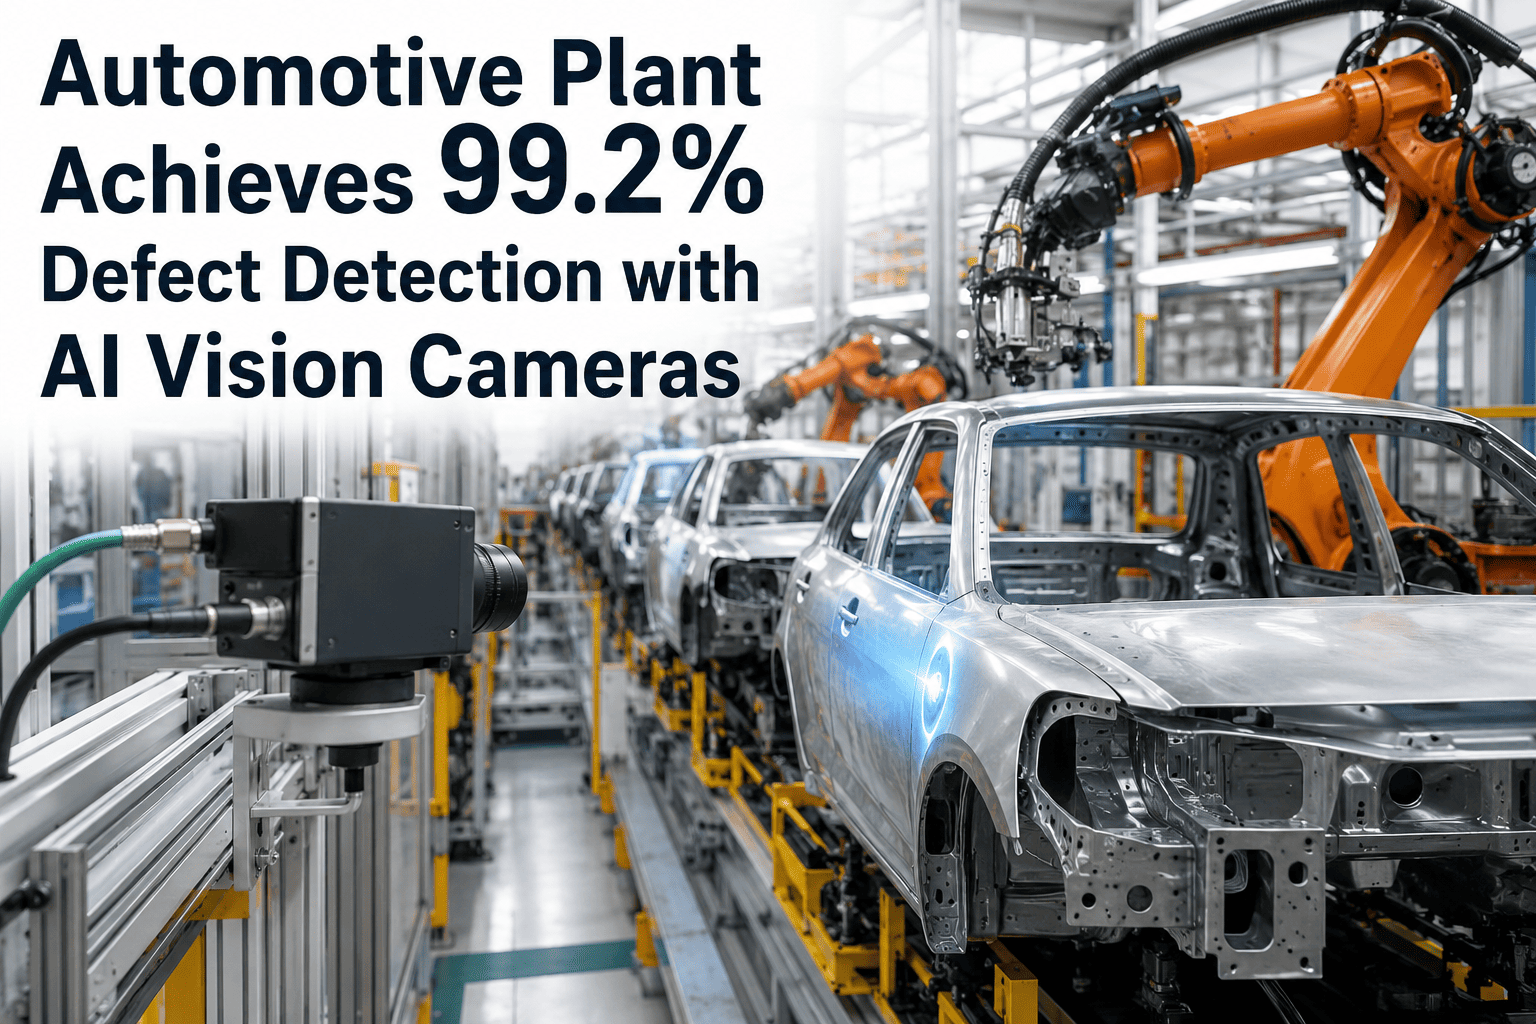
A stamping press running 60 strokes per minute gives a vision system roughly 800 milliseconds to capture, infer, and route. That is enough time for a trained GPU model to classify the six defect families that drive the majority of automotive PPAP failures and customer rejections — if the system is integrated at the press exit, not at a downstream inspection station. Each defect below maps to a specific widget on the plant dashboard and a specific PLC routing tag. Want to see how these map to your actual part portfolio? Book an auto parts vision assessment and we will run your sample defects through the inference engine live.
Burr Formation
Die wear and punch clearance drift produce burrs along trimmed edges. Vision models detect burr height down to 0.1mm at line speed, flagging the die for maintenance before the burr exceeds PPAP tolerance.
Porosity & Casting Voids
For cast and sintered auto parts, subsurface porosity breaks through machined surfaces. Vision systems with controlled lighting detect surface-breaking voids and correlate them to the casting lot for root cause analysis.
Missing Operation
When a machining cell skips a drilling, tapping, or notching step — often due to a tool breakage the operator has not noticed — the vision system flags the missing feature and routes the part to rework before it advances.
Surface Cracks
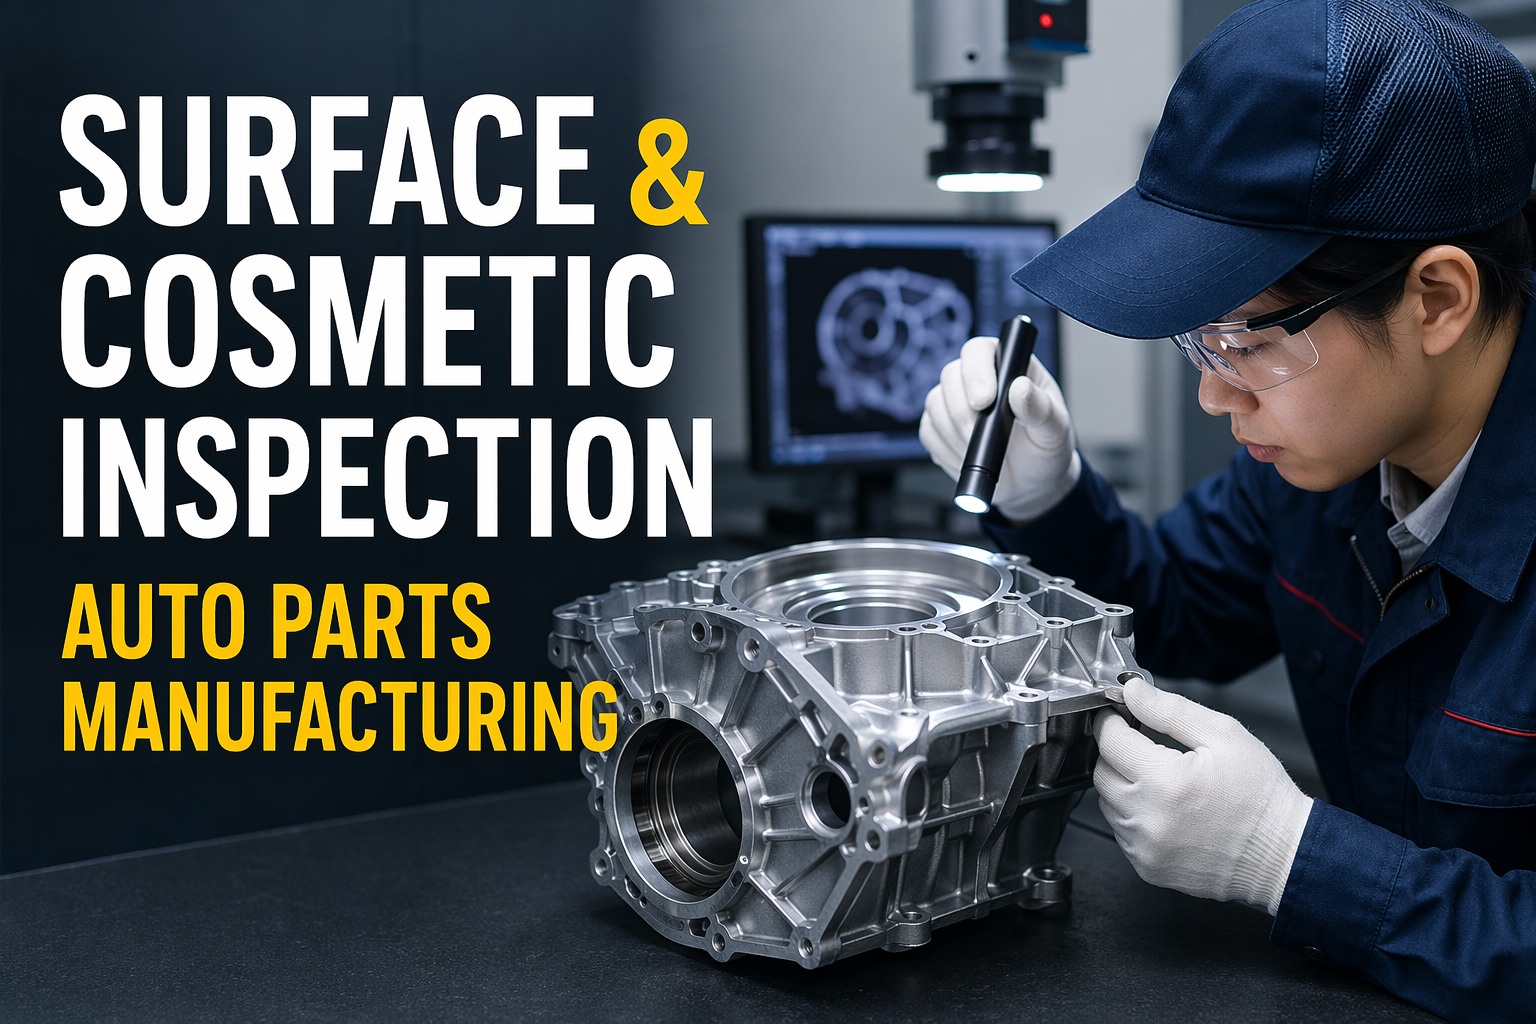
Micro-cracks from forming stress or heat treatment are invisible to the eye but visible to the camera under polarized lighting. Every crack detection event auto-creates a QMS nonconformance record with the image attached.
Dimensional Drift
Critical dimensional features measured in-line via calibrated vision metrology track SPC trends in real time. When Cpk drops below 1.33 on any feature, the dashboard flags the process before it produces a nonconforming part.
Wrong Part / Mix-Up
When a changeover leaves a previous part variant in the bin or a cell runs the wrong program, the vision system verifies part identity against the MES work order and stops the line before a mislabeled shipment reaches the customer.
Before and After: Sampling Inspection vs 100% AI Vision
The gap between end-of-line sampling and 100% in-motion inspection is not incremental — it is structural. Sampling finds defects after a run is complete. AI vision finds them at the press exit, on the part, in real time, and routes them before the next process step. Here is what changes on a typical 60-SPM stamping line producing brake brackets.
End-of-Line AQL Inspection
- 1 in 50 parts pulled every 2 hours for dimensional check
- Defects discovered 2–4 hours after the die drift started
- Burr and porosity missed entirely — no visual inspection at press exit
- Scrap bins sorted manually at end of shift, no root cause data
- PPM defect rate averaged 780–950 over 12 months
- RCA takes 2–3 days of cross-referencing paper logs and MES records
100% In-Motion Inspection
- Every part inspected at press exit — 60 parts per minute, zero sampling
- Defects detected in <800ms, routed to rework or scrap instantly
- Burr, porosity, missing ops, cracks — all classified and logged with image
- PLC tag triggers three-way diverter: pass, rework, or scrap bin
- PPM defect rate dropped to 38–55 within 8 weeks of go-live
- RCA auto-generated from PLC tags, vision images, and MES batch ID in minutes
Curious what your PPM drop would look like on a specific line? Book a single-line vision pilot scoping call and we will build the before-after model with your actual part data.
How AI Vision Connects to Your PLC, MES, and ERP
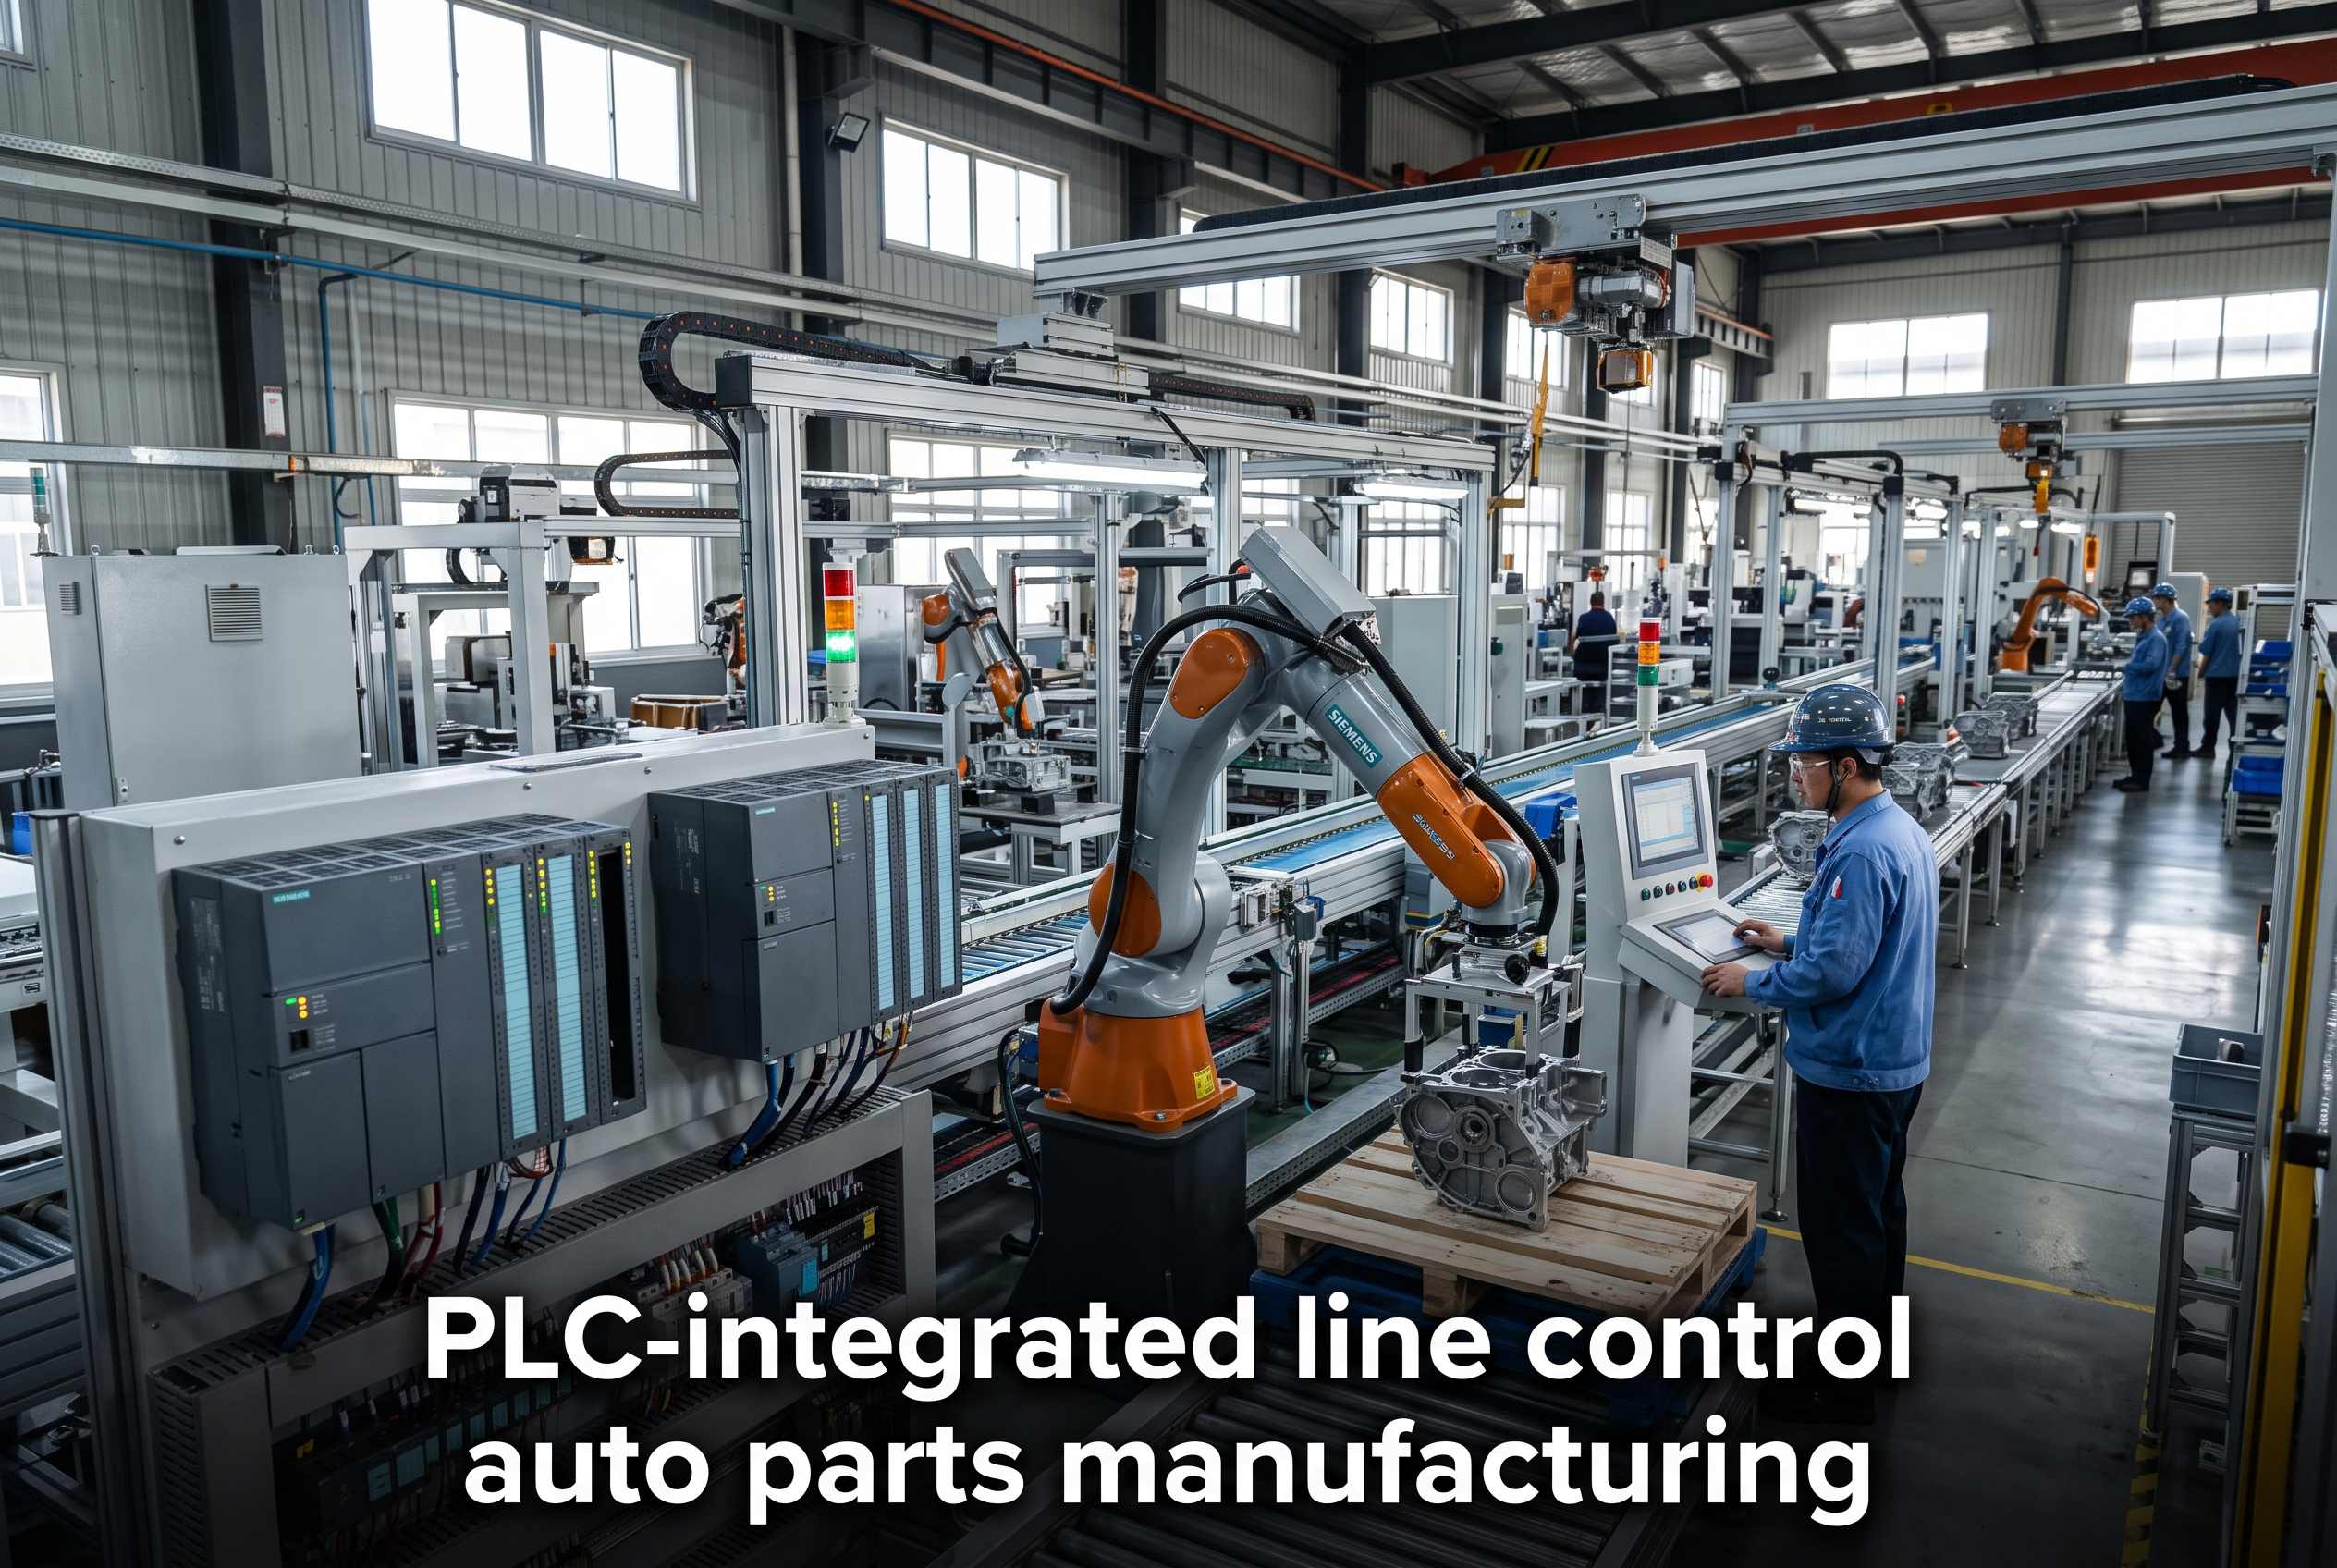
The reason most vision projects stall is that the camera finds the defect but the line does not know what to do about it. iFactory closes that loop by writing the inference result directly into your Level 2 PLC tags, mapping every inspected part to its MES work order identity, and syncing the quality outcome into ERP for real-time scrap cost visibility. The dashboards and widgets you see on the plant floor are simply the visible layer of this closed data loop.
Camera at Press Exit
Industrial vision camera with strobe lighting captures every part at 60 SPM. Images stream to on-prem NVIDIA GPU for inference.
Level 2 PLC / DCS
Inference result writes to PLC tag within 200ms. Three-way diverter routes part to pass, rework, or scrap lane based on defect class.
MES Identity Mapping
Each inspected part is mapped to its MES work order, operation sequence, and batch ID. Nonconformance records auto-create in the QMS with image evidence.
ERP & Dashboards
Scrap cost, PPM trend, OEE impact, and RCA data sync to ERP and plant dashboards via API. Embeddable widgets surface real-time KPIs on any screen.
Need to verify your PLC and MES can accept vision-driven routing tags? Talk to an integration specialist about your specific Allen-Bradley, Siemens, or Mitsubishi setup.
What the Numbers Look Like After 8 Weeks
These are not vendor marketing figures. They are the typical range we see across NAICS 3363 auto parts plants — stamping, machining, and assembly cells — after a single-line AI vision pilot goes live. The variation depends on part complexity, existing OEE baseline, and how fast the maintenance team acts on the dashboard's predictive alerts. If your numbers fall outside this range, the pilot ROI worksheet will show you exactly where the gap is.
reduction in outgoing PPM defect rate when 100% inspection replaces AQL sampling on stamping press exits
scrap cost avoided on a single 60-SPM line producing safety-critical brackets at $0.85 per part
PLC tag write latency from inference result to diverter actuation — fast enough for any press speed
OEE improvement from reduced rework cycles, fewer line stops, and faster changeover verification
Run an 8-Week Single-Line AI Vision Pilot on Your Plant
Fixed price, fixed scope, one stamping or machining line. We retrofit the camera, GPU, and PLC integration to your existing equipment, connect MES and ERP, and hand you a live dashboard with PPM, scrap cost, and OEE widgets. You see the before-after numbers before you commit to a plant-wide rollout.
Expert Perspective
We ran AQL sampling on our stamping line for eleven years and thought 800 PPM was just the cost of doing business with safety-critical brackets. The first week the vision dashboard went live, we saw burr spikes correlated to die temperature drift that our maintenance team had never been able to isolate. Within a month our PPM was under 60, and the customer chargebacks that used to eat my Monday mornings basically stopped. The part I did not expect — the RCA data from the PLC tags meant my quality engineers stopped spending three days reconstructing batch records and started fixing the actual process.
— Darryl Kemper, Plant Manager, Tier 1 brake and suspension component manufacturer, Ohio
of AQL sampling replaced by 100% in-motion vision inspection on the pilot line
of RCA work per defect event reduced to minutes with automated PLC tag and MES correlation
customer chargebacks in the first 90 days post-go-live, down from a recurring monthly cost
Deploy AI Vision on Your Auto Parts Line in 8 Weeks
Fixed-price pilot. One stamping press or machining cell. On-prem NVIDIA GPU inference, PLC tag routing, MES identity mapping, ERP scrap cost sync, and live dashboards with embeddable widgets. You get the PPM drop, the ROI worksheet, and the before-after data — then decide on plant-wide rollout.
Frequently Asked Questions
Can AI vision inspect parts at full stamping press speed without slowing the line?
Yes. A typical stamping press running 60 strokes per minute gives an 800-millisecond window per part. The iFactory on-prem NVIDIA GPU inference engine completes image capture, classification, and PLC tag write in under 200 milliseconds — fast enough for presses up to 120 SPM. The camera mounts at the press exit on an existing conveyor or chute, and no line speed reduction is required during normal operation or changeover.
How does the three-way pass, rework, and scrap routing actually work physically?
The inference result writes to a Level 2 PLC tag that controls an existing or retrofitted diverter mechanism — typically a pneumatic pusher, flap gate, or air-blow nozzle at the press exit. Parts classified as pass continue down the normal conveyor. Parts flagged for rework are diverted to a rework bin or return conveyor. Parts flagged for scrap are diverted to a scrap bin. The routing logic is configurable per defect class and per part number, and the PLC tag capture is logged for automated root cause analysis.
Do I need to replace my existing PLC, MES, or ERP system to integrate the vision dashboards?
No. iFactory integrates with your existing Allen-Bradley, Siemens, Mitsubishi, or Omron PLCs via standard tag read/write protocols. MES integration uses REST or OPC UA APIs to map each inspected part to its work order and operation sequence. ERP integration syncs scrap counts and costs via API — no rip-and-replace required. The dashboards and embeddable widgets run in any modern browser and can be embedded as iframes into your existing HMI, Andon, or ERP portal. Talk to an integration specialist about your specific stack.
What does the fixed-price 8-week single-line pilot include?
The pilot covers one stamping press or machining cell end-to-end: camera and lighting hardware, on-prem NVIDIA GPU inference appliance, PLC tag integration for three-way routing, MES identity mapping, ERP scrap cost sync, dashboard deployment with embeddable widgets, and the ROI worksheet built with your actual part data. The scope is fixed before kickoff, the price is fixed, and the go-live target is week 8. You receive a before-after PPM, scrap cost, and OEE comparison that forms the business case for plant-wide rollout.
How long does it take to train the AI model on a new auto part or defect type?
Initial model training for a new part typically requires 200–500 reference images of good parts and 50–100 images of each defect class you want to detect. The iFactory team collects these during the first two weeks of the pilot using your actual parts and your actual line lighting. New defect classes can be added post-go-live by enrolling new reference images and running a supervised retraining cycle — typically a 2–3 day process that does not require line downtime. The model improves continuously as more production images are captured and classified.
The Bottom Line on AI Vision Dashboards for Auto Parts
AI vision dashboards and embeddable widgets are not a reporting layer bolted onto your plant — they are the visible surface of a closed-loop inspection system that catches every defect at press exit speed, routes every part through your existing PLC, and ties every quality event to its MES identity and ERP cost. For NAICS 3363 auto parts manufacturers, the shift from AQL sampling to 100% in-motion inspection is the difference between discovering a burr problem two hours after the die drifted and catching it on the part that triggered it. The PPM drop, the scrap cost avoidance, and the RCA time savings are measurable within eight weeks. Book a single-line pilot scoping session with iFactory, or talk to a vision integration engineer about your specific stamping, machining, or assembly cell. The fixed-price pilot is the fastest way to see the numbers on your line, with your parts, before you commit to anything bigger.