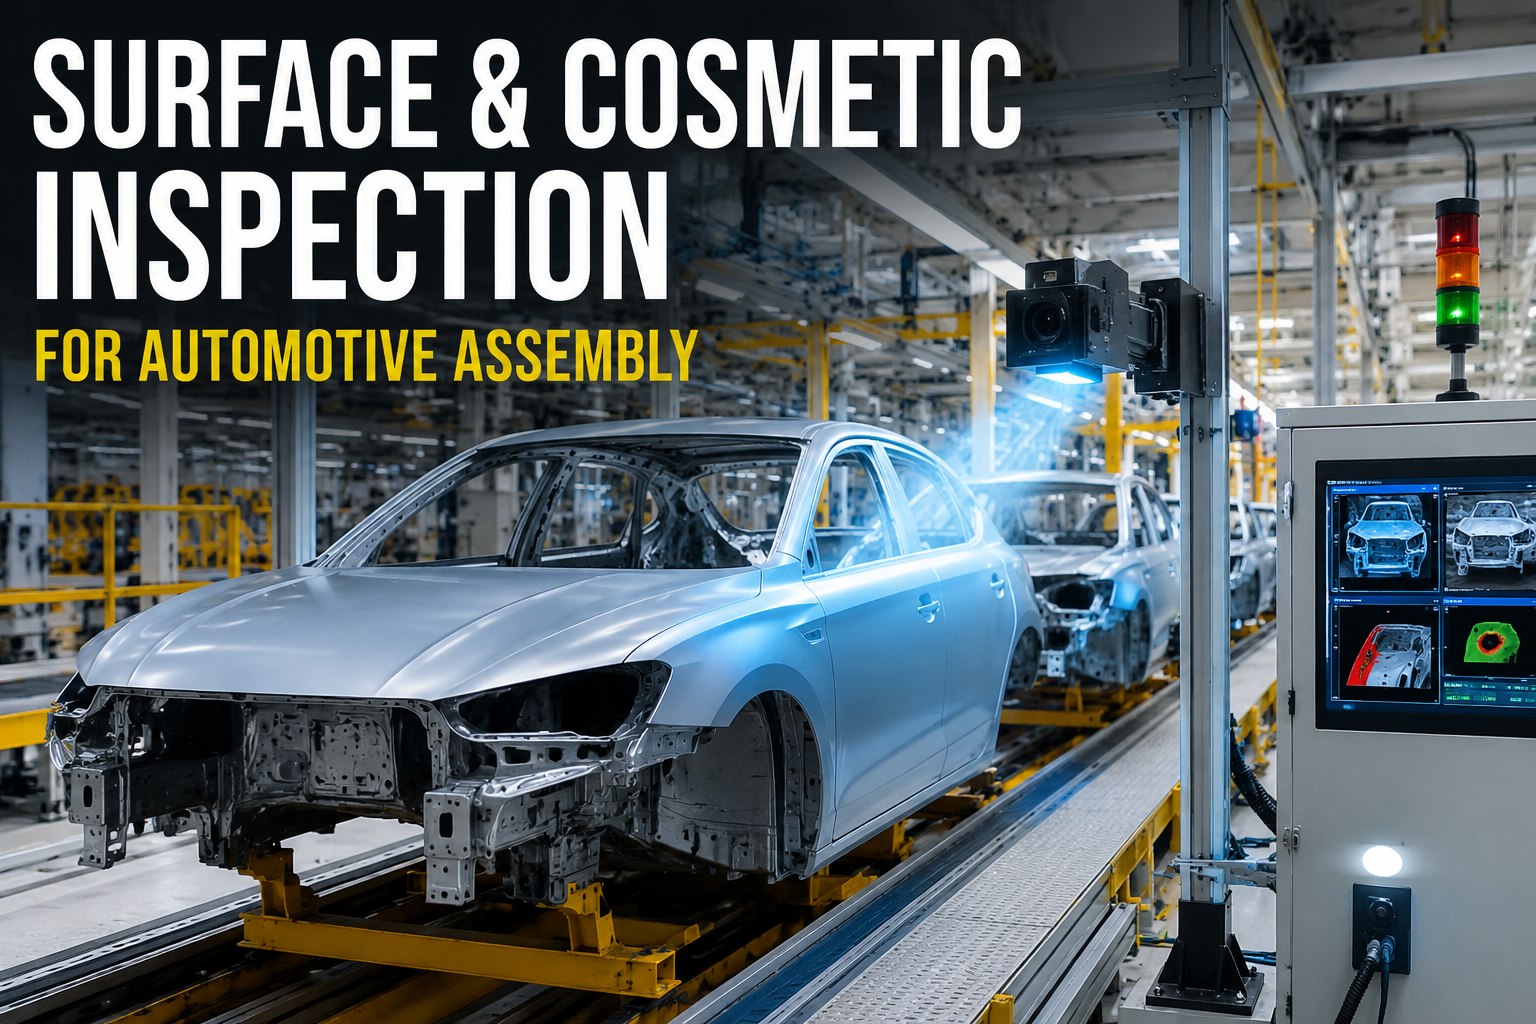
You know the sound. A body-in-white rolls off the skillet line at 58 jobs per hour, and somewhere between the decklid alignment station and the glass booth, a gap-and-flush deviation slips past the operator who has been staring at the same fender contour for nine hours. By the time the trim team catches it at final audit, the rework loop has already cost you 22 minutes of takt, a color-matched panel, and the kind of scrap entry that makes the monthly variance review uncomfortable. AI vision dashboards for automotive assembly exist to kill that exact loop — inspecting 100% of items in motion on the conveyors you already run, routing pass, rework, or scrap decisions to your Level 2 PLC in milliseconds, and pushing every result into the MES and ERP identity chain so the root cause shows up on a dashboard before the next shift starts.
From Camera Capture to PLC Routing in Under 200ms
Every body, every trim, every fastener inspected at line speed — with pass, rework, and scrap decisions written directly to your Level 2 PLC and MES identity chain.
High-Speed Capture
GigE and PoE cameras grab 4K frames on existing body and trim conveyors — no line stoppage, no part manipulation, no cycle-time penalty.
On-Prem GPU Inference
NVIDIA edge appliances run deep-learning models locally — no cloud round-trip, no latency spikes, no production data leaving the plant network.
PLC Tag Write-Back
Defect class and coordinates write to Level 2 PLC tags — diverter gates, reject arms, and rework spur routing execute without operator intervention.
MES & ERP Sync
VIN, body sequence ID, and defect record map to the MES work order and ERP material lot — every result traceable to the exact unit and operator station.
What 100% In-Motion Inspection Actually Delivers on an Assembly Line
The gap between sampling-based quality and 100% in-motion AI vision is not incremental — it is structural. A plant running statistical sampling on a 60 JPH body line inspects roughly 1 in 30 jobs for gap-and-flush. That means 29 jobs per hour leave the station unverified, and the 30th is checked by a human whose attention curve looks like every other human's on the planet. AI vision dashboards flip that ratio: every body inspected, every fastener verified, every paint surface scanned — with results landing on a widget before the next cycle completes. The numbers below are what plants typically see within the first 90 days of a single-line pilot.
Want to see what 100% inspection would do to your scrap variance line on a specific body or trim conveyor? Book a single-line vision pilot scoping call with iFactory's automotive assembly team.
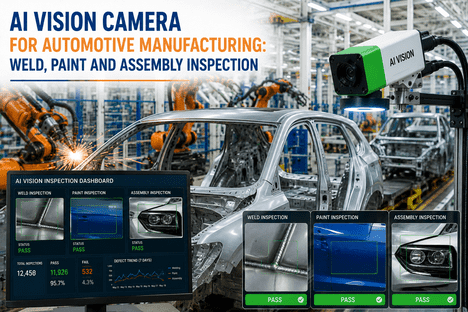
Defect Categories AI Vision Catches at Assembly Line Speed
The reason most legacy vision systems stall in automotive assembly is that the defect universe is not binary. A fender with a 0.3mm gap deviation is not the same defect as a fender with a 2.1mm deviation — one ships, one gets reworked, and the routing decision depends on tolerance bands that change by model and build variant. AI vision dashboards handle that complexity because the models are trained on your actual defect library, not a generic visual ruleset. Here is what the system catches across body, paint, and trim stations.
Run a Fixed-Price 8-Week Vision Pilot on Your Hardest Line
iFactory deploys on-prem NVIDIA GPU inference, GigE cameras, and PLC tag integration on one body, paint, or trim conveyor — with MES/ERP identity mapping, dashboards, and an ROI worksheet delivered before the pilot ends. Fixed price, fixed timeline, measurable FTT and scrap impact.
Three-Way Routing: Pass, Rework, Scrap — Without Operator Guesswork
The most under-discussed capability in an AI vision dashboard is not the detection — it is the routing. Detecting a 1.8mm gap deviation on a decklid is useless if the decision about what happens next still sits with an operator who has 11 seconds before the next body arrives. Three-way routing closes that loop. The inference result writes a defect class and severity tag directly to the Level 2 PLC, and the conveyor diverter, reject arm, or rework spur executes the routing decision automatically. The operator's job shifts from "decide and hope" to "supervise and confirm."
The 11-Second Gauntlet
- Operator visually inspects at station — misses 8–12% of subtle defects
- Defect found at final audit — rework loop costs 18–35 minutes of takt
- Rework vs. scrap decision logged on paper — enters MES hours later, if at all
- No defect image captured — root cause investigation relies on memory
- Scrap cost attributed to line, not to specific body ID or upstream station
Automated, Auditable, Immediate
- 100% of bodies inspected — defect class written to PLC in <200ms
- Rework spur diverts correctable defects before downstream value-add
- Scrap routing triggers automatically for out-of-tolerance structural defects
- Defect image, coordinates, and timestamp tied to VIN in MES batch record
- Root-cause dashboard surfaces station-level defect clusters by shift
Curious how three-way routing would integrate with your existing Level 2 PLC and diverter hardware? Talk to a vision integration specialist about your conveyor and PLC architecture.
MES, ERP, and QMS Integration: Closing the Identity Chain
A vision system that only flashes a red light on the line is a toy. A vision system that maps every defect to a VIN, a work order, an operator ID, a material lot, and a station timestamp — that is a quality system. iFactory's AI vision dashboards are built around identity mapping from the first camera frame. When a body enters the inspection zone, the system reads the body sequence number or RFID tag, pulls the active MES work order, and binds every subsequent defect record to that identity. When the shift ends, the QMS has a complete, queryable record of what happened, where, and why — no manual data entry, no paper travelers, no end-of-shift reconciliation.
MES Work-Order Binding
Every inspection result — pass, rework, or scrap — writes to the active MES work order with body ID, station, timestamp, and defect class. No orphaned records, no end-of-shift data entry.
ERP Material Lot Traceability
Scrap and rework events consume material lots in the ERP — so the variance report at month-end reflects what actually happened on the line, not what the kitting system said should have happened.
QMS CAPA Triggering
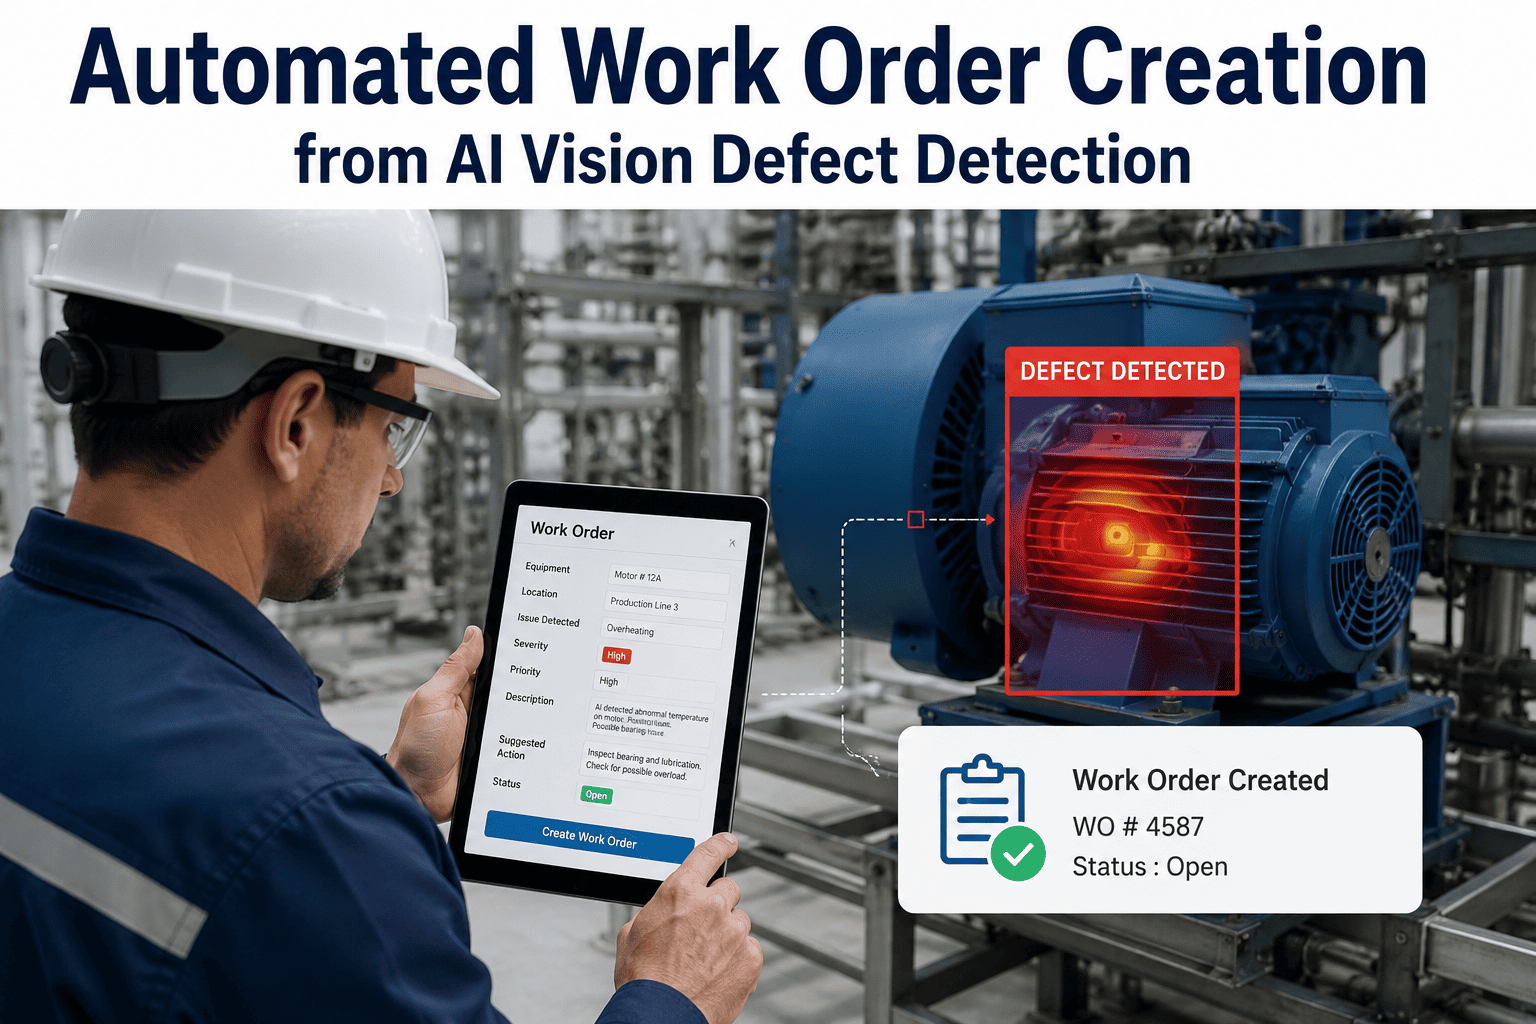
When a defect cluster exceeds threshold at a station for N consecutive cycles, the QMS auto-opens a CAPA with linked images, PLC parameter snapshots, and operator context — no manual ticket creation.
PLC Parameter Capture
At the moment of defect detection, the system snapshots relevant PLC tags — torque values, clamp pressure, robot coordinates — so root-cause analysis starts with data, not guesses.
Need vision results flowing into your specific MES and ERP stack — whether that's SAP, Plex, Ignition, or a homegrown system? Book an integration architecture session to map the API and tag-capture plan.
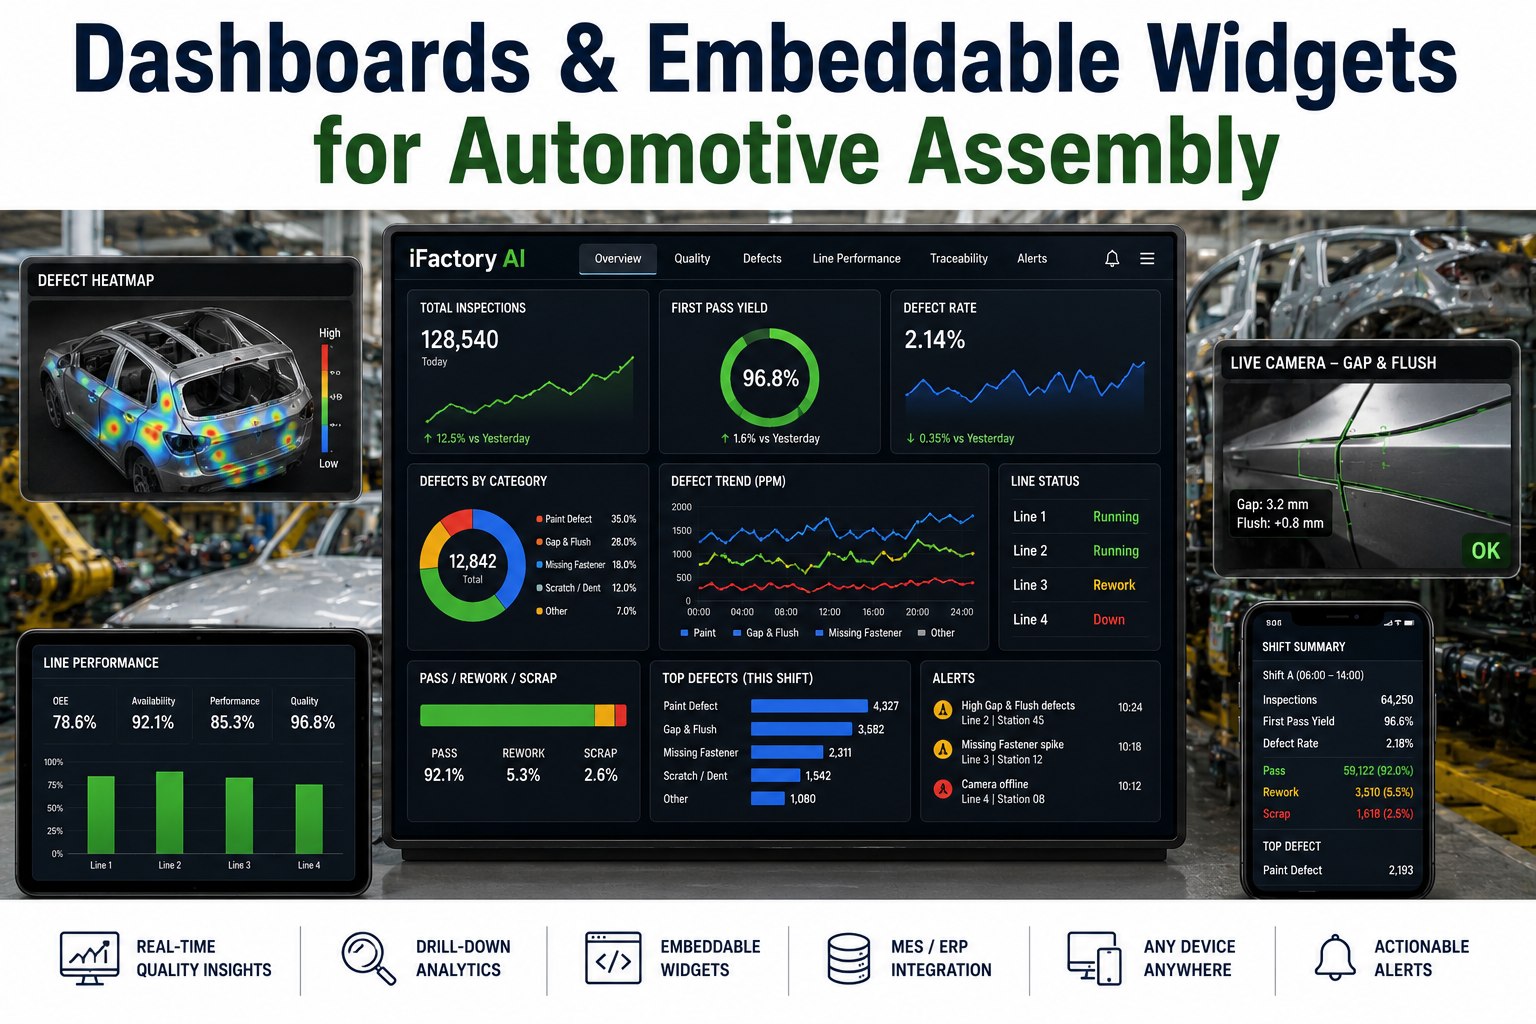
Dashboards and Embeddable Widgets: From Line Floor to Corner Office
The data only matters if the right person sees it in time to act. iFactory's dashboard layer serves three audiences simultaneously: the line operator who needs a pass/fail signal in real time, the shift supervisor who needs to see defect trends across stations, and the plant leadership who needs OEE, scrap cost, and FTT rolled up by line, shift, and model variant. Every widget is embeddable — meaning the same defect-rate chart that lives on the plant-floor HMI can be dropped into a SharePoint page, a morning operations email, or a executive Power BI tab without rebuilding the data pipeline.
Want these widgets embedded in your existing plant dashboard stack before the pilot ends? Schedule a dashboard architecture walkthrough with iFactory's integration team.
The 8-Week Single-Line Pilot: What Happens and When
A vision pilot that drags on for six months is not a pilot — it is a project. iFactory runs a fixed-price, fixed-timeline 8-week pilot on one line, with measurable FTT and scrap impact delivered before week nine. Here is what happens in each phase, and what you get at the end.
iFactory engineers walk the line, map PLC tags, identify camera mount points, and collect 2,000–5,000 images of your actual defects — orange peel, gap deviations, missing fasteners — to build the training set.
Deep-learning models trained on your defect library, validated against holdout images, and deployed to on-prem NVIDIA edge appliances. Cameras mounted, wired, and calibrated on the conveyor — no production stoppage.
System runs in shadow mode — inspecting 100% of bodies, writing results to dashboards, but not yet routing. PLC tag write-back tested in parallel. MES/ERP identity mapping validated against real work orders.
Three-way routing goes live. FTT and scrap cost measured against pre-pilot baseline. iFactory delivers a line-specific ROI worksheet with scaling projections for plant-wide rollout.
Expert Perspective
We ran gap-and-flush checks on 1 in every 25 bodies for years and thought we were doing fine. Then final audit started catching decklid deviations we never saw at the framing station, and every one of them was a 22-minute rework loop. The first week the vision system went live in shadow mode, it flagged 14 gap deviations our operators had cleared — and every single one had the image and the PLC torque snapshot attached. That is the moment I stopped arguing about whether 100% inspection was worth it. The question became how fast we could get it on the other two body lines.
— Dan Reller, Body Shop Plant Manager, Tier 1 automotive assembly plant (NAICS 336110), Midwest US
gap deviations flagged in week 1 of shadow mode that operators had cleared as pass
average rework loop time eliminated per caught deviation before downstream stacking
from line walk to live three-way routing on a single body or trim conveyor
Get the ROI Worksheet and Pilot Your First Line in 8 Weeks
iFactory's fixed-price single-line pilot delivers on-prem NVIDIA GPU inference, 100% in-motion inspection, three-way PLC routing, MES/ERP identity mapping, and embeddable dashboards — with a line-specific ROI worksheet that shows exactly what scrap cost and FTT improvement look like at your plant.
Frequently Asked Questions
How does AI vision integrate with existing PLC and conveyor hardware on an automotive assembly line?
iFactory reads body sequence numbers or RFID tags as each unit enters the inspection zone, then writes defect class and routing decisions directly to Level 2 PLC tags via EtherNet/IP or Profinet. The existing diverter gates, reject arms, and rework spurs execute the routing — no new conveyor hardware required. The system also snapshots relevant PLC parameters (torque, pressure, robot coordinates) at the moment of detection so root-cause analysis starts with data, not guesses.
What is three-way pass, rework, and scrap routing and how does it reduce scrap cost?
Three-way routing means the AI vision system does not just flag a defect — it classifies severity and writes a routing instruction to the PLC. Correctable defects (like a minor gap deviation) route to the rework spur before downstream value-add stacking. Out-of-tolerance structural defects route to scrap automatically. This prevents the most expensive scrap scenario: a defect that travels through paint, trim, and final assembly before being caught at audit. Plants typically see 18–25% scrap cost reduction within 90 days.
Can the dashboards and widgets be embedded into our existing plant HMI and reporting stack?
Yes. Every widget — station-level pass/fail, defect Pareto, scrap cost roll-up, root-cause cluster map — is embeddable via iframe or API. The same defect-rate chart that runs on the plant-floor HMI can be dropped into SharePoint, Power BI, or a morning operations email without rebuilding the data pipeline. iFactory's integration team maps the widget architecture to your specific dashboard stack during the pilot. Book a dashboard architecture walkthrough to see how it fits your environment.
Does the system require cloud connectivity, or does inference run on-premise?
All inference runs on-premise on NVIDIA edge GPU appliances. No production images leave the plant network, and there is no cloud round-trip latency. This is critical for automotive assembly lines running at 55–70 JPH, where a 200ms cloud round-trip would cause buffer accumulation and cycle-time disruption. Cloud connectivity is optional and used only for remote model updates and off-site dashboard access if the plant IT policy permits.
What does the fixed-price 8-week pilot include and what do we get at the end?
The pilot covers one line — body, paint, or trim — and includes line assessment, defect image collection (2,000–5,000 images), model training, on-prem NVIDIA edge appliance deployment, camera mounting and calibration, PLC tag integration, MES/ERP identity mapping, shadow-mode validation, live three-way routing, and embeddable dashboards. At the end of week 8 you receive a line-specific ROI worksheet with measured FTT and scrap impact, plus scaling projections for plant-wide rollout. Talk to a vision specialist to scope the pilot against your hardest line.
What This Means for Your Plant
AI vision dashboards for automotive assembly are not a future-state concept — they are running on body, paint, and trim conveyors right now, inspecting 100% of items in motion, routing pass, rework, and scrap decisions to Level 2 PLCs in under 200ms, and pushing every result into the MES and ERP identity chain. The plants that deploy them stop finding gap-and-flush deviations at final audit. They stop scrapping painted panels for defects that originated at framing. They stop relying on an operator's 11-second visual check to protect a 60 JPH line. The fixed-price 8-week pilot is the fastest way to see what 100% inspection does to your scrap variance line — book a pilot scoping demo and get the ROI worksheet for your hardest line.