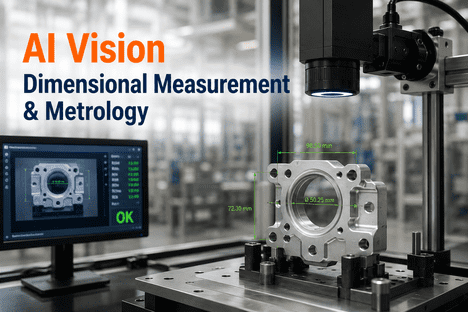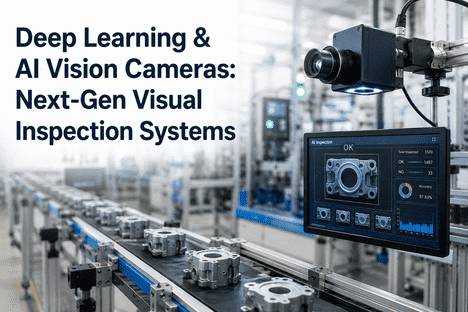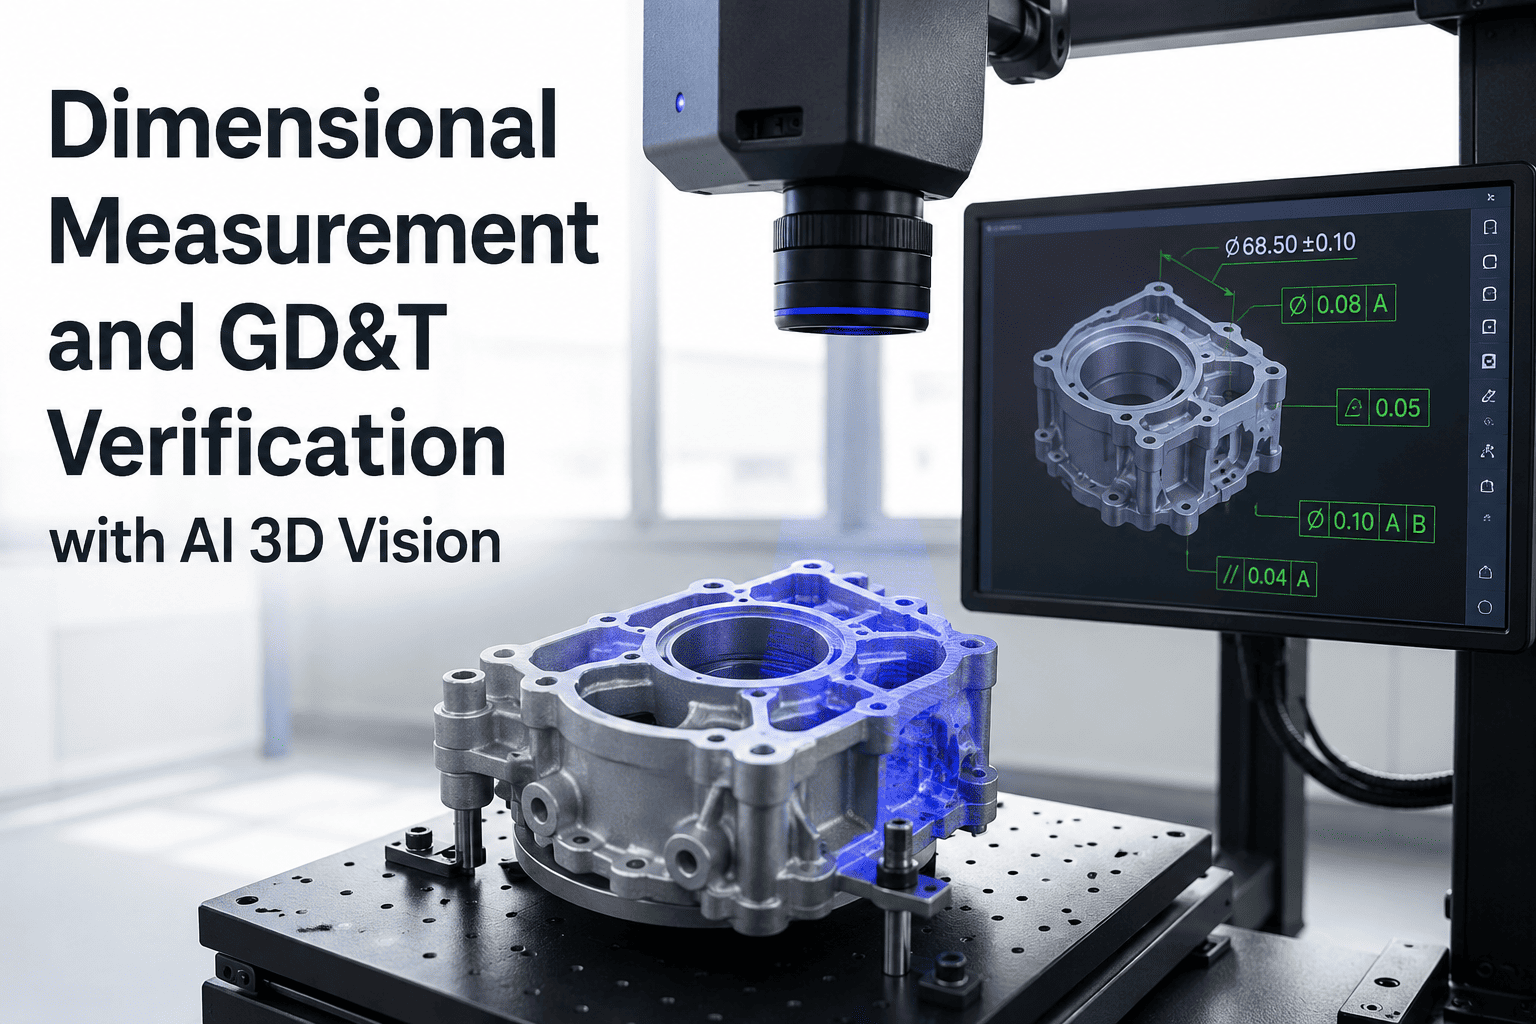
The tolerance is 0.05mm on the boss height of a machined aluminum housing, and the CMM in the quality lab confirms the first-off is good. Six hours later, assembly flags a leak. Metrology remeasures and finds the boss drifted 0.08mm out of spec, and the last 900 parts are suspect. That gap, between what the CMM sees at first-off and what the process actually produces over a shift, is where GD&T conformance quietly breaks down. AI-driven 3D vision closes it by measuring every part at line speed and flagging drift before the tolerance is breached — book a 3D metrology assessment to see how inline measurement fits your machining or stamping line.
Every Part Measured. Every Callout Verified. Every Deviation Traced.
iFactory's AI 3D vision pairs structured-light and laser-triangulation capture with CAD-referenced GD&T evaluation to catch dimensional drift at micron resolution, in-process, without pulling parts off the line.
Where GD&T Drift Actually Hides on a Precision Line
Precision machining and stamping lines lean on a lab CMM and hand gauges. Both are sample-based, both offline, and both leave the shift's production unverified. On a 40-parts-per-hour cell, an 8-minute CMM cycle covers fewer than three parts an hour. The other 37 rely on process capability that everyone hopes has not shifted. Thermal growth, tool wear, coolant drift, and workholding creep stack up over the shift, and the first-off report cannot see any of it.
of production runs between CMM samples on a 40-part/hour precision cell
CMM cycle for a part with 20+ GD&T callouts and full datums
median tolerance stack on aerospace, medical, and EV features under Y14.5-2018
of dimensional escapes traced to drift between sample checks
The 3D Vision Stack: Three Capture Modes, One GD&T Engine
No single 3D capture method fits every part. A gearbox with recessed bosses needs different optics than a bracket on a conveyor. iFactory selects the mode per line, and the point cloud flows into the same GD&T engine regardless of source. Here is how the three primary modes compare.
Blue-Light Structured Light
A blue LED projector casts fringe patterns while stereo cameras record the deformation. Phase-shift decoding builds a dense point cloud from one capture. Best for complex geometries, castings, and blades.
Laser Line Triangulation
A laser line projects across the part while an offset camera captures reflected geometry. The scanner or part moves through the beam; the profile stitches into a 3D surface. The workhorse for high-speed inline on conveyors.
Multi-View Photogrammetry
Calibrated cameras capture the part from multiple angles simultaneously. Feature matching and bundle adjustment reconstruct 3D geometry from 2D imagery. Ideal for larger parts and macro features.
Every GD&T Callout the AI Verifies from One Scan
Under ASME Y14.5-2018, geometric tolerance falls into five families with 14 controls. The 3D vision engine evaluates all of them from one dense point cloud aligned to CAD, with datum hierarchy defined per part number. No re-fixturing, no separate gauges.
Flatness
Two parallel planes contain the surface. A least-squares plane fits the point cloud; peak-to-valley deviation reports without a datum reference.
Cylindricity
Two coaxial cylinders contain the surface. The AI captures taper, barreling, and hourglass from the full point cloud, not a few touch points.
Circularity
Each round cross-section is evaluated against two concentric circles. Worst-case out-of-roundness across every slice, not one sample plane.
Parallelism
Two parallel planes or a cylindrical zone parallel to the datum contain the feature. Datum-referenced orientation deviation reports to spec.
Perpendicularity
The tolerance zone sits at 90 degrees to the datum. Every point on the feature is evaluated against the perpendicular envelope, worst-case flagged.
True Position
The most-used symbol on modern drawings. A cylindrical zone at MMC or RFS contains the feature axis, referenced to primary, secondary, and tertiary datums.
Profile of a Surface
A uniform envelope surrounds the CAD nominal. Ideal for freeform blades, seals, and body panels. Output is a color-map deviation plot per part.
Total Runout
The full surface stays within a rotational zone about the datum axis. Point cloud rotates computationally, replacing the fixture and dial indicator.
CMM Lab Sample vs Inline AI 3D Vision
The CMM is not going anywhere. It remains the reference standard for traceable sub-10-micron verification and PPAP. What changes is role: instead of primary detection tool for every part, it becomes the calibration reference for a vision system that covers the other 97%.
Stop Waiting for the Lab Report. See Drift the Moment It Starts.
See a live scan against your CAD reference on a sample part from your line. iFactory scopes the capture technology, GD&T schema, and integration architecture for a fixed-price 10-week pilot.
The 6-Stage Inline Measurement Pipeline
From the moment a part enters the cell to the moment its measurement lands in SPC, the pipeline runs in under three seconds. Each stage is deterministic, logged, and traceable back to the raw scan, so any reject can be audited from tolerance decision back to sensor data.
Trigger & Part Present
Encoder or through-beam sensor detects the part. MES pulls the production order, part number, and CAD revision. Scan recipe loads.
3D Capture
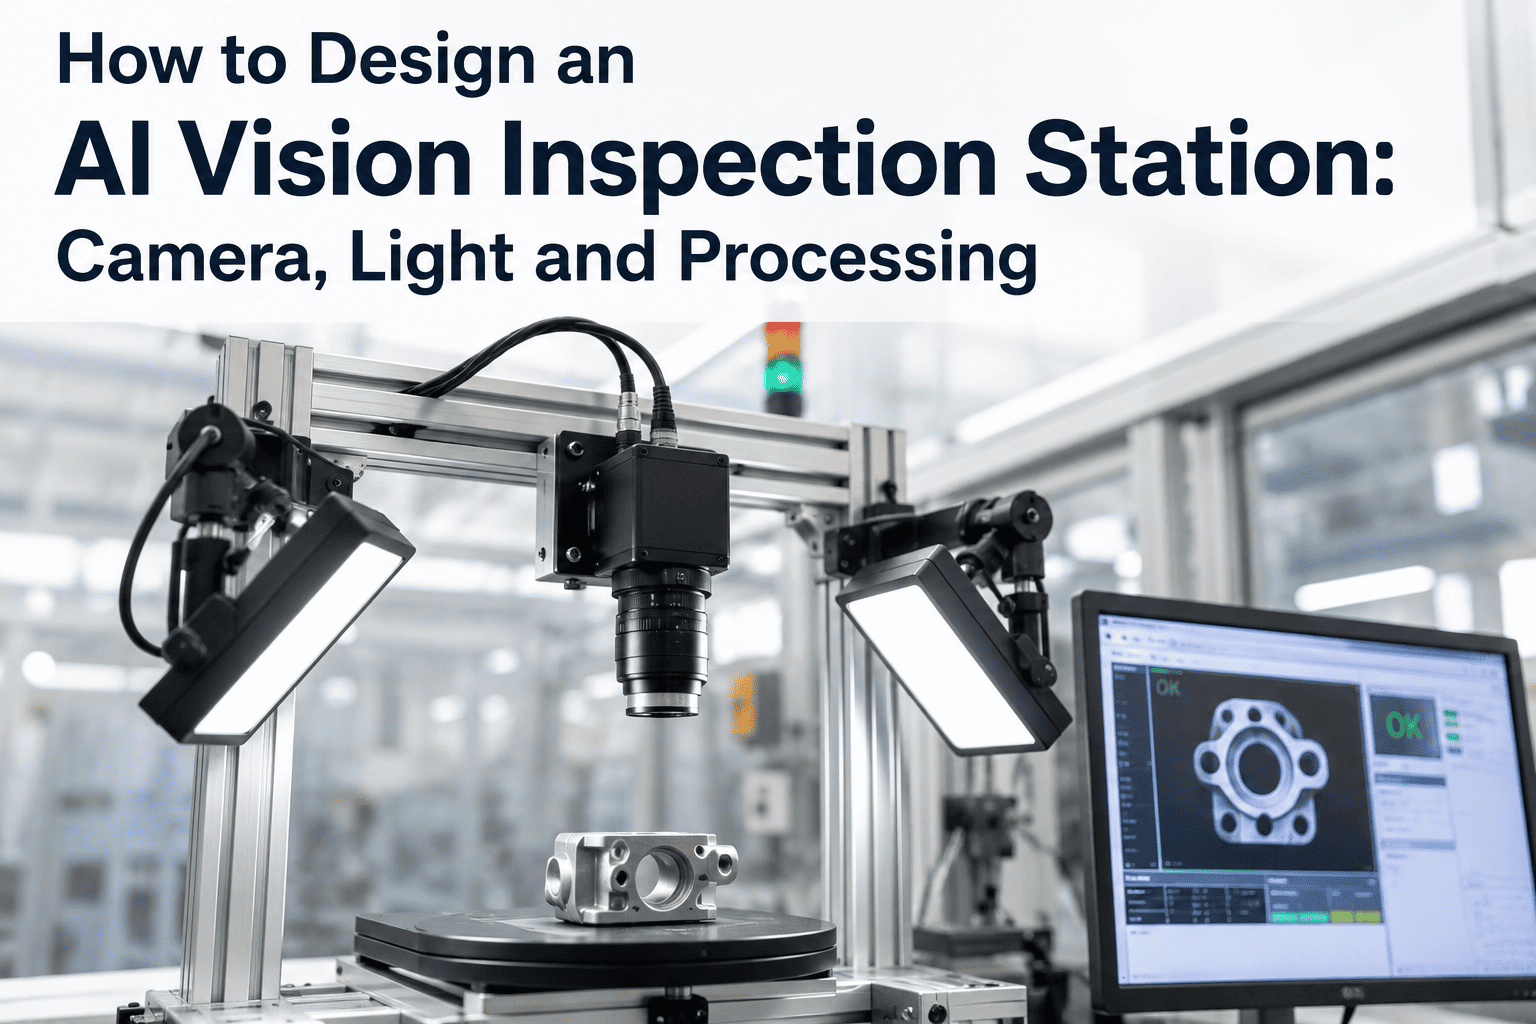
Structured-light projector, laser line, or camera array executes the scan. Multi-view geometry covers complex features and undercuts.
Point-Cloud Build
Raw sensor data decodes into a dense 3D point cloud with sub-pixel refinement. Noise filtering and outlier rejection produce a clean mesh.
CAD Alignment
Point cloud registers to CAD nominal via best-fit or datum-referenced alignment. Datum priority follows ASME Y14.5-2018 rules.
GD&T Evaluation
Every drawing callout evaluates against the aligned cloud. Feature extraction pulls axes, planes, cylinders, and profile curves.
Verdict & SPC Write
Pass, rework, or scrap verdict routes to the PLC. Numeric callout data writes to SPC, updating Cp, Cpk, and control charts live.
The CAD-to-SPC Loop That Makes Drift Visible in Real Time
Vision without context is just measurement. Inline 3D metrology works because every scan anchors to three reference frames: CAD (target), MES (part identity), and SPC (drift over time). When those tie together, the process engineer stops chasing rejects and starts correcting drift before rejects happen.
CAD as the Golden Master
The CAD model with embedded PMI is the single source of truth. The vision system imports STEP or native CAD with the full GD&T scheme and datum reference frame. Every result is a delta from CAD nominal.
MES-Anchored Traceability
Every scan inherits the MES order, part number, revision, operator, machine, tool number, and cycle count. When a callout drifts, the trend filters by any variable. First-pass yield and scrap write back in real time.
Live SPC and Cpk on Every Callout
Numeric measurements feed an SPC engine with X-bar-R, IMR, and Cpk charts per controlled dimension. Western Electric alarms trigger before parts go out of tolerance. Talk to a specialist about wiring CAD, MES, and SPC together before scoping the vision layer.
What Changes When Every Part is Measured
Plants that move from sample-based CMM to inline 3D metrology see impact in four places: dimensional PPM drops because drift is caught during the shift, Cpk visibility improves with full distribution data, metrology throughput lifts, and first-time-right rises. Here is the typical before-and-after on a Tier 1 line.
The 10-Week Fixed-Price Pilot
You do not commit to a plant-wide rollout on a slide deck. The pilot is one line, one part family, one fixed price, ten weeks from kickoff to go-live. Here is how it breaks down.
Part & Callout Study
Engineers walk the line, pull the drawings, and index GD&T callouts by frequency and defect cost. Capture technology is scoped to part geometry.
CAD Ingest & Model Config
STEP or native CAD imports with PMI. Datum frames validate. Alignment and tolerance thresholds tune against your CMM correlation data.
Cell Install & MES Wire-Up
Scanner, lighting, and GPU appliance install during scheduled downtime. MES, PLC, and SPC integrations light up. No unplanned downtime.
Shadow Run & Correlation
System runs in shadow mode. Scans cross-check against CMM until agreement exceeds 99% per callout. Thresholds and datums lock in.
Go Live with SPC Feedback
Pass, rework, and scrap routing goes live to the PLC. Cpk dashboards open to quality and process engineers. First drift alarm proves it out.
A Metrology Manager's Take on Inline 3D Vision
We ran the CMM three times a shift and hoped nothing drifted between checks. It did, and we found out at the customer. Now every part gets scanned, every callout gets a number, and I see the boss height climbing on the control chart hours before we would have hit the tolerance. My CMM still runs, but now it verifies the vision system on golden samples instead of chasing every alarm. Scrap dropped, PPM dropped, and my team stopped working weekends.
— Metrology Manager, Tier 1 precision machining supplier, Midwest US
reduction in customer-detected dimensional PPM within 120 days of go-live
correlation between inline 3D scan and reference CMM on the same part
fixed-price pilot from line study to live GD&T verification with SPC feedback
Frequently Asked Questions
Does inline 3D vision replace our CMM, or work alongside it?
It works alongside. Inline vision does not replace the CMM for traceable sub-10-micron reference measurement, PPAP submissions, or calibration artifacts. What it replaces is the sample-based role the CMM plays on the production line. The CMM stays in the lab as the reference standard, verifying the vision system on periodic golden samples, while vision handles 100% inline inspection. Book a scoping call to map the split for your line.
How does the system handle datum reference frames from Y14.5-2018 drawings?
The system imports CAD with embedded Product Manufacturing Information, including datum features and their priority order per feature control frame. When a scan is aligned, primary datum is simulated first, then secondary, then tertiary, exactly as a physical inspection fixture would. This ensures tolerance evaluation matches proper GD&T principles, and audit reports demonstrate datum-simulation compliance for customer or regulatory review.
What accuracy can we actually expect on our parts, not benchmark artifacts?
Accuracy depends on capture technology, part size, and surface characteristics. Blue-light structured light routinely delivers 5–20 micron accuracy on parts up to around 500mm. Laser triangulation lands in the 10–50 micron band and handles reflective or dark surfaces better. Multi-view photogrammetry covers larger parts at 20–100 microns. During scoping, iFactory runs a gauge R&R study against your CMM so you get a hard number before committing.
Can the system handle multi-SKU lines where different parts run back-to-back?
Yes. Every scan begins with a part identification step tied to the MES production order or a readable identifier on the part. The corresponding CAD, GD&T scheme, and scan recipe load automatically without operator involvement. Mixed-flow lines with left/right variants, multiple engineering revisions, or customer-specific variants of the same base part are all handled seamlessly. Changeover is measured in seconds, not minutes.
What happens to the point-cloud data and how long is it retained?
Every scan and measurement record is retained on the on-prem storage appliance for a configurable window, typically 12–24 months, so you can reconstruct any part's dimensional record for warranty, customer 8D, or field-failure analysis. Point clouds store in a compressed native format with the CAD reference and PLC tags. Nothing leaves the plant unless you export it. Talk to a specialist about retention architecture for your compliance regime.
The Bottom Line on Inline GD&T Verification
Sample-based CMM inspection was built for an era when measurement was slow and expensive. Both constraints are gone. Structured light and laser triangulation now deliver reference-class accuracy inline at cycle times shorter than the part takes to leave the fixture. Plants that close the CAD-to-SPC loop stop finding drift at the customer and start correcting it during the shift that produced it. That is the difference between a metrology function that reports scrap and one that prevents it.
See a Scan on Your Own Part Against Your Own CAD
Book a 30-minute scoping call. Share a sample part and CAD file. iFactory demonstrates a full 3D scan, CAD-referenced GD&T evaluation, and color-map deviation on your geometry, and builds a fixed-price 10-week pilot proposal with an ROI worksheet tailored to your PPM and scrap cost.