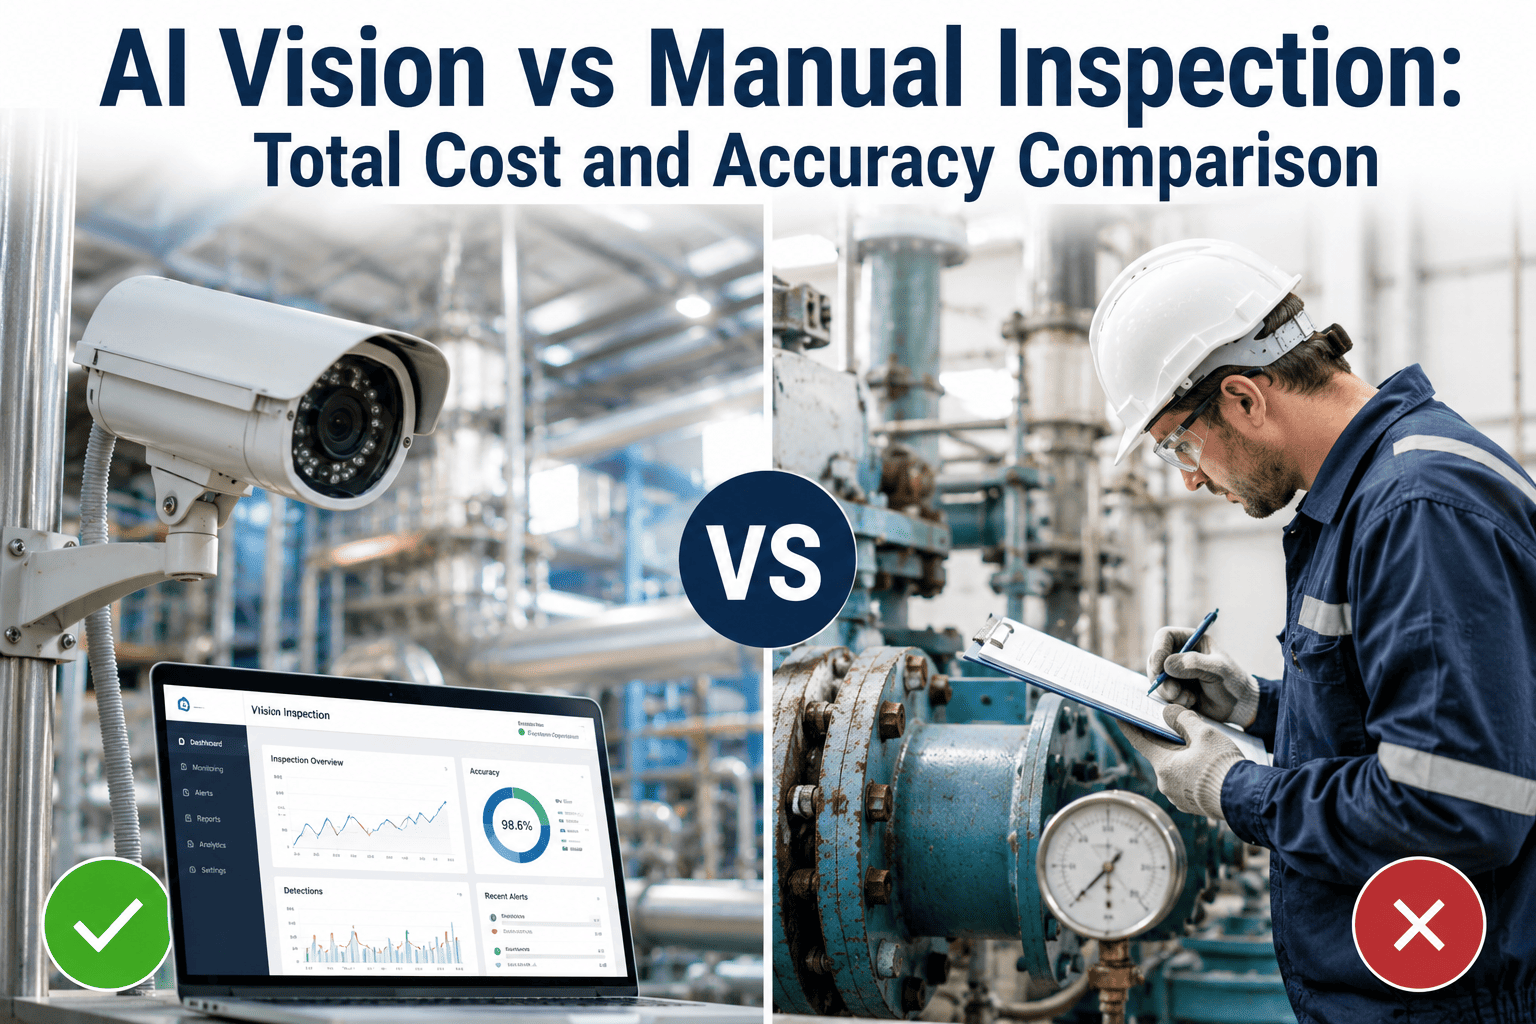
AI Vision vs Manual Inspection: Total Cost and Accuracy Comparison
By Johnson on July 14, 2026
Manual inspection has quietly been the bottleneck under every quality program for a century. Decades of Sandia National Labs and industry research consistently pin human inspector accuracy at 70-80% under real production conditions — a number that drops further as the shift wears on, the line speeds up, and defects shrink below half a millimeter. AI vision inspection sits in a different regime entirely, holding 97-99.5% accuracy across every shift, every unit, every hour. This is a full-cost comparison across accuracy, labor, throughput, and escape costs — the four numbers that decide whether a plant's inspection budget is protecting margin or quietly leaking it. To see the numbers modeled on your own line, book a 30-minute cost walkthrough.
Buyer's Comparison
AI Vision vs Manual Inspection — Total Cost and Accuracy, Side by Side
The honest head-to-head every quality leader eventually runs, with the numbers most cost analyses leave out — inter-inspector variance, fatigue-driven accuracy decay, escape cascade multipliers, and the true fully-loaded labor cost per inspection station.
Every AI-vs-manual analysis stalls until four numbers are on the table together — accuracy, coverage, consistency across shifts, and true cost per inspection point. Below are the industry-benchmarked figures, drawn from published research on visual inspection reliability and vendor deployment data.
Accuracy
Manual
70-80%
AI Vision
97-99.5%
Peak human performance vs consistent AI baseline
Coverage
Manual
Sample
AI Vision
100%
Statistical AQL sampling vs every-unit inspection
Consistency
Manual
55-70%
AI Vision
100%
Inter-inspector agreement vs deterministic AI decision
False Positives
Manual
15-25%
AI Vision
Under 3%
Wasted rework driven by inspector overcaution
Why Human Accuracy Caps at 80% — The Fatigue Curve
Human inspection is not defeated by lack of skill; it is defeated by biology. Sustained visual attention on repetitive tasks degrades within 20-30 minutes and continues to decline through the shift. The chart below shows the accuracy trajectory published across visual inspection reliability research — the exact hours where escapes cluster in every plant that runs manual QC.
Inspector Accuracy Across a Shift — Research Benchmarks
Inspector accuracy peaks in the first 30 minutes, degrades 25-40% by hour 2, and continues declining through end-of-shift. AI vision holds the top line flat regardless of duration, shift, or inspector rotation.
The True Cost of Manual Inspection — Four Layers Buyers Rarely Total
Manual inspection looks cheap on a payroll spreadsheet. The real number lives across four layers that finance teams almost never consolidate onto one line. Modeled honestly, a US plant running three shifts with four inspectors per shift is spending well over half a million dollars a year just to catch 70-80% of defects.
01
Direct Labor
Fully-loaded US and EU inspector cost runs $30-45/hr — roughly $187K per year for two 8-hour shifts, five days a week. A three-shift line with four inspectors per shift ($45K fully burdened each) crosses $540K annually before overtime or escalation.
02
Defect Escapes
The 20-30% miss rate translates directly into rework, warranty claims, and field failures. Industry data ties $3.4 billion in annual manufacturing loss to defects that slipped past human inspectors — a cost quality never sees on its own budget line.
03
Throughput Ceiling
Manual inspection needs 2-5 minutes per complex part. Lines producing 100+ parts per minute either bypass inspection entirely or take a throughput hit to preserve it. Neither answer is cheap on the P&L.
04
Consistency and Audit
55-70% inter-inspector agreement means the same defect gets a different call across shifts. There is no visual audit trail. Regulated industries pay for this in failed audits, customer complaints, and slow root-cause investigation.
Model Your Own Manual-Inspection Cost
See what four-layer cost your line is actually carrying today, and what the AI vision payback looks like modeled on your production volume, defect profile, and shift structure.
Twelve dimensions, side by side. This is the table quality engineers rebuild every time they open a manual-vs-AI business case. Consolidated here for reference against your own numbers.
Dimension
Manual Inspection
AI Vision Inspection
Defect detection accuracy
70-80% peak, degrades over shift
97-99.5% consistent
Coverage
Statistical sample (AQL)
100% of units
False positive rate
15-25%
Under 3%
Inter-shift consistency
55-70% agreement
Deterministic
Sub-millimeter defect capture
Poor below 0.5mm
Sub-mm at line speed
Throughput per inspector or station
2-5 minutes per complex part
Line-speed inspection
Fully loaded cost per year per line
$187K-$540K+ (US/EU)
$50K-$150K one-time
Audit trail per inspection
None to sparse notes
Image, timestamp, defect metadata
Scalability to new SKUs
Retraining and hiring
Retrain model on samples
Novel defect discovery
Strong on unexpected patterns
Improving with anomaly models
Payback period
Never — ongoing cost
6-18 months typical
CMMS work order integration
Manual escalation
Auto-raised on recurring patterns
The Escape Cost Cascade — Why Missed Defects Cost 10,000x
The single most under-modeled number in every manual-vs-AI business case is the cost of a defect that gets past the inspection station. It scales geometrically the further it travels — a rule quality engineers have known for decades and finance teams routinely leave off the spreadsheet.
At Inspection
$1
Defect caught on the line — scrap or rework the single unit
Manual inspection accepts a 20-30% miss rate as baseline. Every missed defect is a lottery ticket on the cascade above — one that a plant loses on a schedule set by escape rate, not by luck.
When AI Wins — and When Manual Still Fits
AI vision is not automatically the right answer for every line. There are specific production profiles where manual inspection still makes financial sense. Being honest about the crossover point is how quality leaders build credible AI business cases and avoid deploying vision on a line that will never earn payback.
AI Vision Wins
High-volume, standardized production above 400-600 parts per day
Sub-millimeter defects that human eyes miss at line speed
Regulated industries requiring 100% inspection and audit trail
Multi-shift operations where consistency across shifts matters
Recurring defect patterns worth feeding into maintenance
Manual Still Fits
Low-volume production under 200 parts per day
Highly variable, low-repetition assembly work
Novel defect discovery on prototype and pilot runs
Complex human judgment on subjective quality attributes
Regions where fully-loaded labor sits below $10/hr
The ROI Timeline — What Payback Actually Looks Like
The industry-published benchmark for AI vision inspection payback is 6-18 months, with a Forrester study reporting 374% three-year ROI and 7-8 month typical payback. The timeline below shows how the numbers accumulate for a representative single-line deployment.
Month 0-1
Pilot deployment on one line. Model training on plant defect samples. Baseline accuracy validated against known defective and good units before go-live sign-off.
Month 2-4
Full production runtime on the pilot line. Escape rate drops from 20-30% to under 3%. Rework cost falls immediately as defects get caught at the station.
Month 5-8
Cumulative labor and escape savings cross the initial deployment cost. Payback achieved on schedule. Business case validated for scale-out to adjacent lines.
Month 9-36
Compound returns — recurring defect patterns feed CMMS work orders, throughput lifts 30-35%, and warranty claims fall. Three-year ROI lands in the 300-400% range.
Frequently Asked Questions
Is human inspector accuracy really only 70-80%?
Yes, and the number is remarkably consistent across research going back decades. Sandia National Labs and multiple peer-reviewed studies place peak human inspector accuracy at 70-85% under real production conditions — not because inspectors lack skill, but because sustained visual attention on repetitive tasks is a biological constraint. Two inspectors working in tandem lift the combined catch rate to around 96%, but the labor cost roughly doubles. To see the accuracy delta modeled on your defect profile, book a walkthrough.
What is the true annual cost of manual inspection per line?
In the US or EU, a single fully-loaded inspector at $30-45/hour across two 8-hour shifts costs roughly $187K per year. A three-shift line running four inspectors per shift at $45K fully burdened crosses $540K annually before overtime. In low-cost labor regions the direct number drops to around $37K per station per year, but the escape-cost layer — 20-30% of defects reaching the customer — hits every operation the same way. A modeled cost breakdown on your line is available if you talk to a specialist.
How quickly does an AI vision inspection deployment pay back?
Industry benchmarks put payback at 6-18 months for most single-line deployments, with a Forrester study reporting a 7-8 month typical payback and 374% three-year ROI. Deployment cost usually lands in the $50K-$150K range per station, offset against annual labor savings ($187K+ in the US and EU) plus reduced scrap, warranty claims, and throughput gains of 30-35%. A cost-modeled forecast on your line takes about 30 minutes — book a demo to walk through it.
Where does AI vision genuinely underperform manual inspection?
Two places. First, on very low-volume production under about 200 parts per day, the AI capex cannot recover from the limited unit count and manual wins on ROI. Second, on novel defect discovery — humans remain excellent at spotting unexpected, never-before-seen patterns that AI has not been trained on, which is why prototype and pilot runs still benefit from human eyes. On high-volume standardized production above 400-600 parts per day, AI wins on every financial metric. A fit assessment for your line is available if you reach out to a specialist.
Do we have to eliminate the inspection team to deploy AI vision?
No, and most successful deployments do not. The common pattern is a hybrid model where AI handles primary screening at line speed, catches the sub-millimeter defects, and holds accuracy across shifts — while inspectors move to higher-value work: managing exceptions the AI flags, tuning quality thresholds, running root-cause investigation on recurring patterns, and handling complex subjective judgments. Manual workload typically drops 70-80% while the team gets redeployed onto engineering-adjacent quality work. To scope the right hybrid model, book a demo.
See the Numbers on Your Own Line
Model AI Vision vs Manual Inspection — With Your Volume, Your Defects, Your Labor Cost
Bring the escape rate you accept today, the labor budget you carry, and the throughput target you cannot afford to miss. In 30 minutes a vision engineer will walk through the four-layer cost model, the accuracy delta on your defect classes, and the payback timeline for your specific line — no generic case studies, just numbers modeled on your operation.