Every manufacturer knows scrap costs money. What most quality leaders underestimate is how much everything else costs — the rework labor, the extra inspection hours, the warranty accruals, the returned shipments, the goodwill spent smoothing over a customer who received a bad batch. Cost of Poor Quality sums all of that into a single number, and for a typical manufacturer that number lands somewhere between fifteen and twenty percent of revenue. AI vision earns its capital back by pulling defects out of the process at the point where correction is cheapest, before they compound through downstream operations into full assemblies, painted panels, boxed shipments, and eventually field failures — iFactory's deployment team walks quality leaders through the exact COPQ math for their own defect mix.
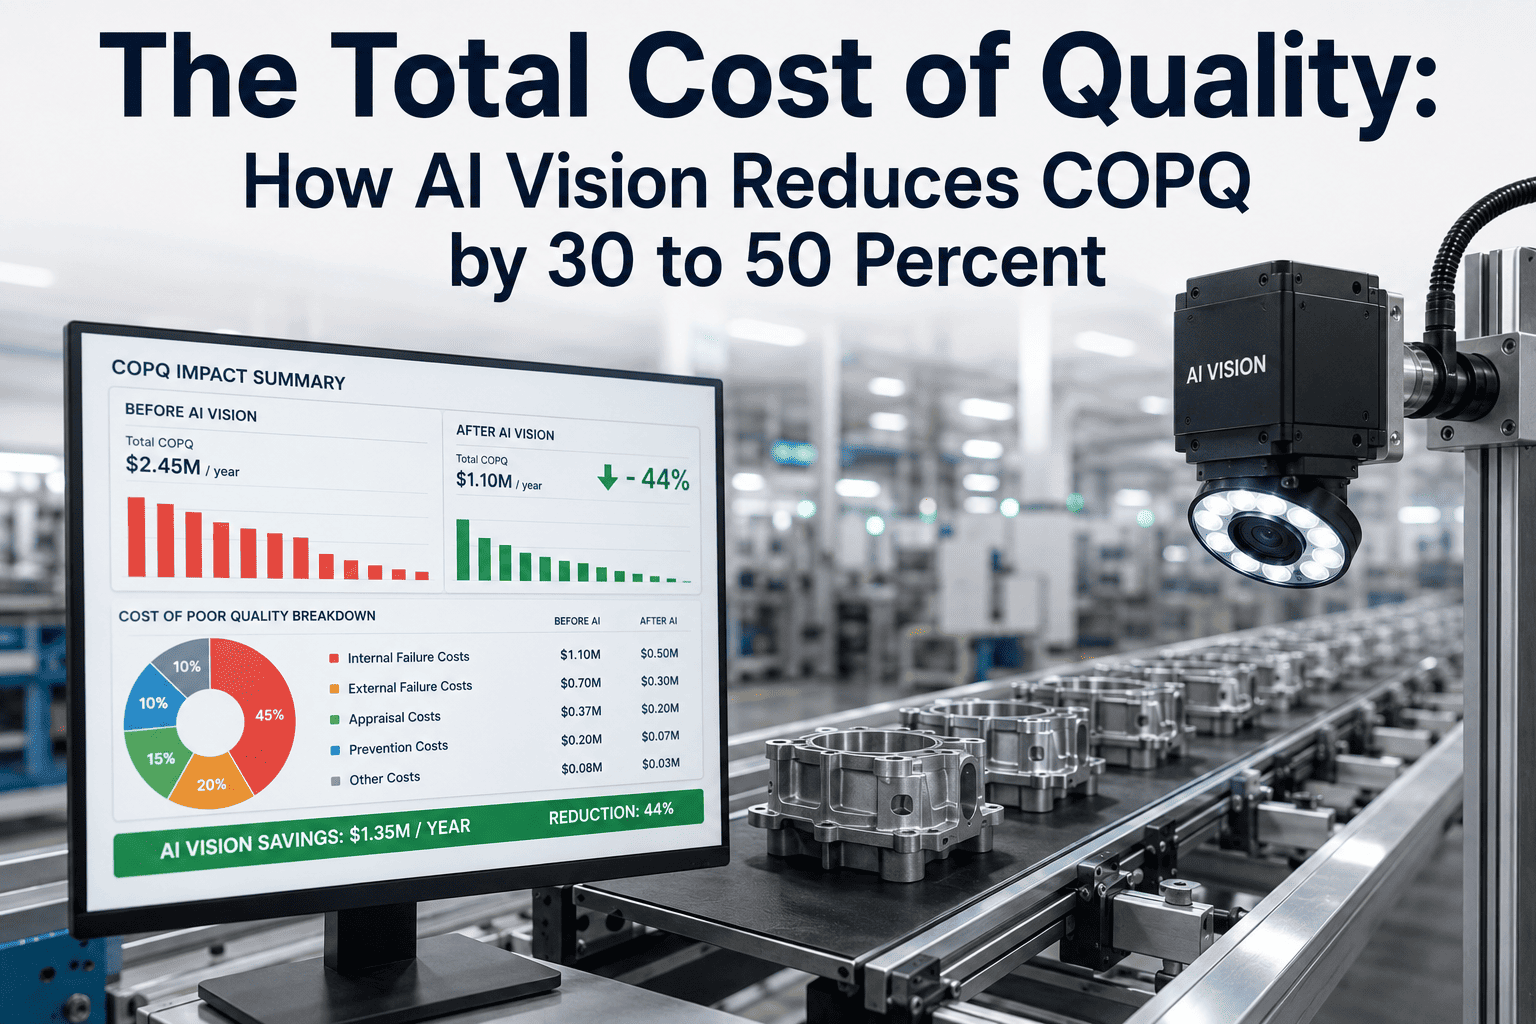
The Total Cost of Quality: How AI Vision Reduces COPQ by 30 to 50 Percent
Scrap is the visible cost. Rework, warranty, returns, and reputation are the ones that quietly consume margin. AI vision reduces total Cost of Poor Quality by catching defects at the earliest station on the line — where a defect costs cents, not the hundreds or thousands it costs after it has traveled downstream.
What You See vs What COPQ Actually Costs
The scrap bin is the number every plant tracks and the number every plant underestimates COPQ by. Scrap sits above the waterline where it is easy to count, easy to report, and easy to build a monthly review around. Every other component of Cost of Poor Quality sits below the waterline, distributed across payroll categories, warranty accruals, customer service headcount, and lost future orders that no one ever gets to invoice.
Every one of those below-the-waterline categories is a real cost that lands on the P&L somewhere, but it lands scattered across departments that don't roll up into a single COPQ number. Rework labor sits in production payroll. Warranty accruals sit in finance. Customer service overhead sits in service. Lost repeat business sits nowhere — it never appears as a line item because it's revenue that never existed to be lost. Adding these up honestly is the exercise that turns quality from a departmental metric into a company-level P&L conversation, and it's usually the exercise that reveals COPQ is three to five times what the scrap number alone suggests.
Why the Same Defect Costs 100x More Downstream
There is a well-established pattern in quality economics known as the 1-10-100 rule: the cost to prevent or correct a defect grows by an order of magnitude at each stage it is allowed to advance. A defect caught at the workstation where it was created costs one unit to correct. The same defect caught later in the plant, after downstream operations have added value on top of it, costs roughly ten times as much. The same defect that escapes the plant entirely and is discovered by the customer costs roughly a hundred times as much once warranty, returns, and reputation costs are counted honestly.
The critical property of this ratio is that it changes what "quality investment" actually means. Spending on inspection technology that catches defects at Stage 1 is not a cost — it is the substitution of dollar-scale spending for hundred-dollar-scale spending. Every defect caught at the source instead of at the customer represents a hundredfold cost reduction on that specific unit, which is why AI vision deployed at early workstations delivers COPQ math that no downstream inspection strategy can match. Downstream inspection catches escaping defects late; source inspection prevents them from becoming expensive in the first place.
The Four Cost Categories That Make Up Total COPQ
Quality cost accounting groups every dollar of COPQ into four categories, and understanding which category a specific cost belongs to determines which quality investment will actually reduce it. Adding inspection headcount attacks appraisal cost, and does nothing about prevention. Adding prevention capability reduces internal and external failure costs, but not by moving the appraisal number. Categorizing before spending is what makes quality investments produce measurable returns instead of just moving costs from one column to another.
The strategic pattern that reduces total COPQ is consistent across every mature quality program: shift spending from the failure categories into the prevention category, use appraisal as verification rather than as a primary defect-catching mechanism, and measure the reduction in total COPQ rather than the reduction in any single line item. AI vision at the source is a prevention-and-appraisal hybrid — it inspects every part while feeding process feedback that prevents the next defect from occurring — which is why it disproportionately reduces the two costliest categories, internal and external failure.
See the COPQ Reduction Model Built on Your Own Defect Mix
iFactory's deployment team works with quality leaders to build a defect-by-defect COPQ model — where costs actually land today, which stations create them, and what the projected reduction looks like when AI vision is deployed at the source rather than at the exit gate.
How AI Vision Actually Cuts COPQ by 30 to 50 Percent
Headline reduction figures only mean something if the mechanism producing them is clear. AI vision reduces COPQ through a small number of specific effects, and understanding which effect is doing the work in each category makes the projected number defensible instead of aspirational. Every one of the mechanisms below has been measured across multiple deployments, and the composite effect on total COPQ is what produces the 30 to 50 percent range that the headline reflects — not any single mechanism operating in isolation.
The other reason to unpack the mechanisms individually is that different plants gain from different ones. A plant with high warranty exposure gains disproportionately from source-level catching. A plant with variable inspection quality across shifts gains disproportionately from consistent inspection standards. A plant with slow root cause resolution gains disproportionately from the image-linked defect log. Matching the mechanism to the plant's specific COPQ profile is how a target reduction number stops being a marketing figure and starts being a defensible finance projection.
The COPQ Shift a Typical Deployment Actually Produces
Averaged across the deployments where COPQ was measured honestly before and after AI vision was introduced, the shift lands in a consistent pattern. The scrap number moves less than most quality leaders expect. The rework, warranty, and returns numbers move more than most quality leaders expect. Total COPQ moves in the 30 to 50 percent reduction range, and the specific position within that range depends almost entirely on how bad the external failure cost was before deployment.
| COPQ Component | Before AI Vision | After AI Vision | Typical Change |
|---|---|---|---|
| Scrap | Baseline | Slightly reduced | 10 to 20% lower |
| Rework Labor | Baseline | Meaningfully reduced | 30 to 45% lower |
| Warranty Claims | Baseline | Substantially reduced | 40 to 60% lower |
| Returns & Restocking | Baseline | Substantially reduced | 40 to 55% lower |
| Excess Inspection Hours | Baseline | Redeployed to root cause | 20 to 35% redirected |
| Line Downtime | Baseline | Reduced via trend detection | 15 to 30% lower |
| Customer Service Overhead | Baseline | Reduced with fewer complaints | 25 to 40% lower |
| Total COPQ | 15 to 20% of revenue | 8 to 12% of revenue | 30 to 50% overall reduction |
The row worth staring at is warranty claims and returns. Those are external failure costs, and they respond disproportionately to source-level defect catching because every defect prevented from escaping is a warranty claim that never happens. Plants with high warranty costs before deployment see the largest total COPQ reduction; plants that were already spending heavily on end-of-line inspection see a smaller reduction because they had already suppressed some of the external failure cost at higher appraisal expense.
How AI Vision Pays Back Against COPQ Reduction
Capital investment reviews always come back to payback period, and AI vision's payback is driven almost entirely by the pre-deployment COPQ number. Plants with high COPQ pay the investment back fast because there is more waste to eliminate; plants with already-low COPQ pay back more slowly because there is less to reduce. The pattern below is representative rather than universal, but it illustrates why COPQ measurement should always precede a capital decision on inspection technology. A payback quote generated without a defensible baseline is a guess dressed up as a projection, and finance teams learn to spot the difference quickly.
The other variable that shifts payback timing is deployment scope. A single-station pilot targeting the plant's worst defect category tends to pay back faster than a whole-line rollout because the pilot is concentrated where COPQ was already highest. A whole-line deployment produces larger absolute savings but spreads the investment across categories with mixed pre-deployment cost profiles. Most plants use the pilot to establish the mechanism and payback rate, then scope the broader rollout against the demonstrated result rather than the projected one.
The COPQ conversation I have with most plants starts the same way. They tell me their quality costs are running around three or four percent of revenue, I ask them how they arrived at that number, and it turns out they've counted scrap and nothing else. Once we sit down and build the actual COPQ model — rework labor by station, warranty accruals from finance, returns from logistics, excess inspection hours from the quality department, and an honest estimate of lost repeat business from sales — the real number is almost always in the fifteen-to-twenty percent range. That's the moment the AI vision business case stops being a technology conversation and becomes a P&L conversation, because now the payback isn't measured against a rounding error in the scrap budget, it's measured against a share of revenue that's larger than most plants realize they're losing. The reduction we see in practice lands consistently in the thirty to fifty percent range on total COPQ, and the piece that surprises quality leaders most isn't the scrap number moving — it's how much the warranty and returns numbers move once source-level defect catching is actually in place.
Frequently Asked Questions
See What a 30 to 50 Percent COPQ Reduction Looks Like on Your P&L
Every plant already spends the money that COPQ measures — it's just spread across scrap, rework, warranty, returns, and customer service where it's hard to see and easy to underestimate. iFactory's AI vision platform pulls those costs back to the source where prevention is cheapest and lets you show finance a defensible reduction against a defensible baseline.