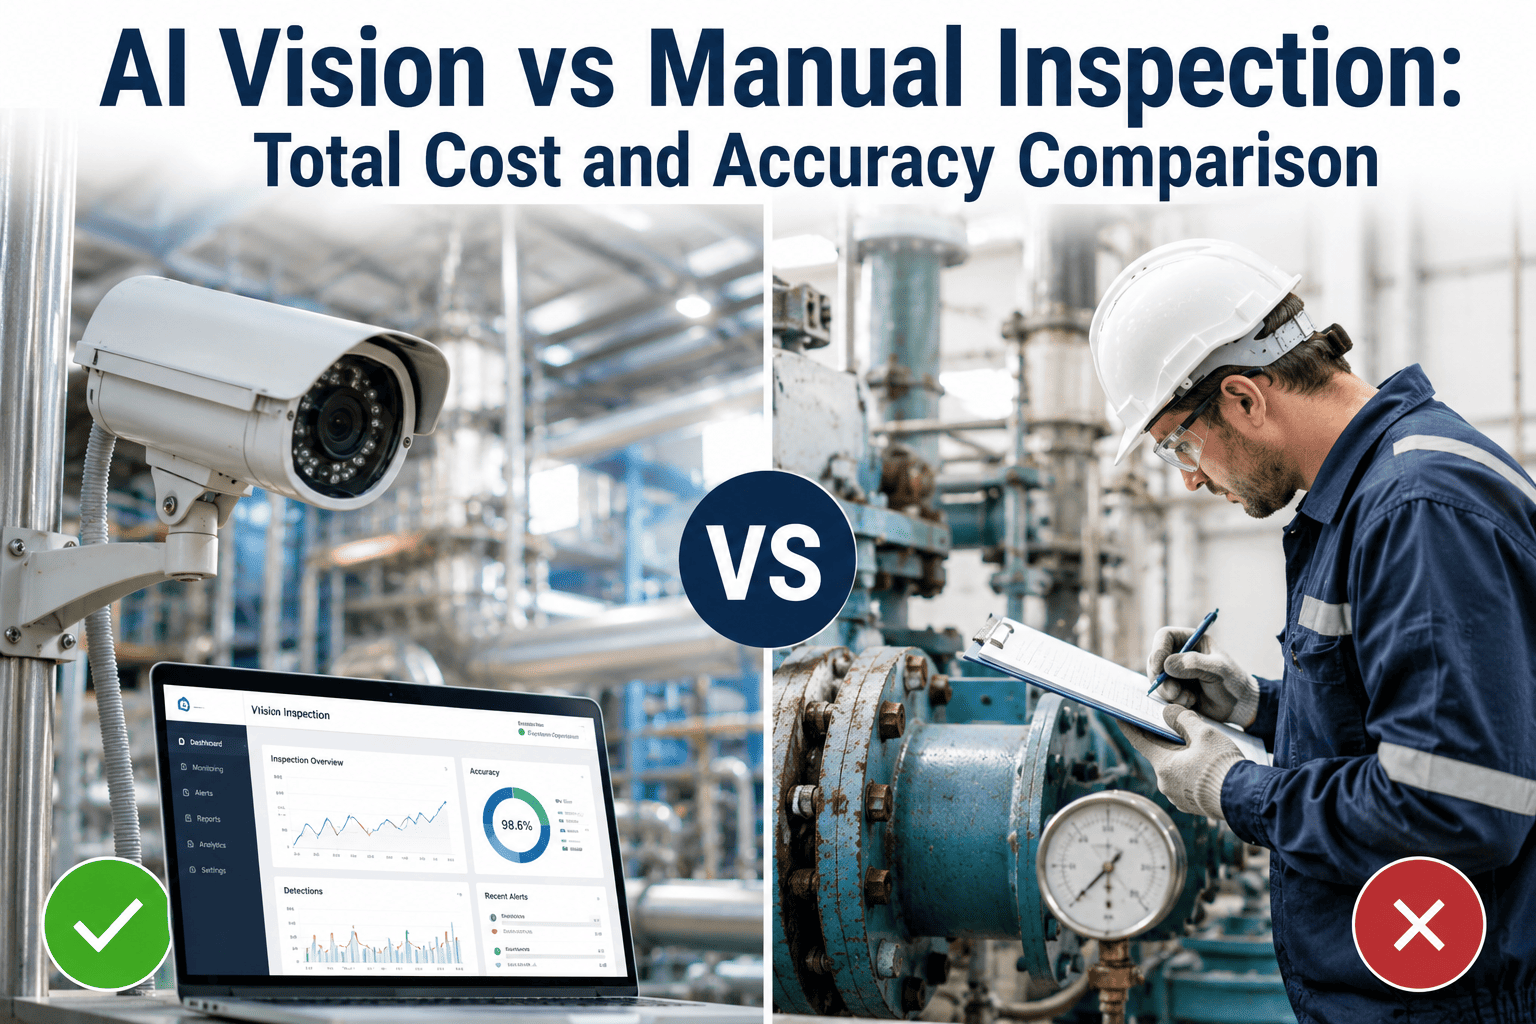
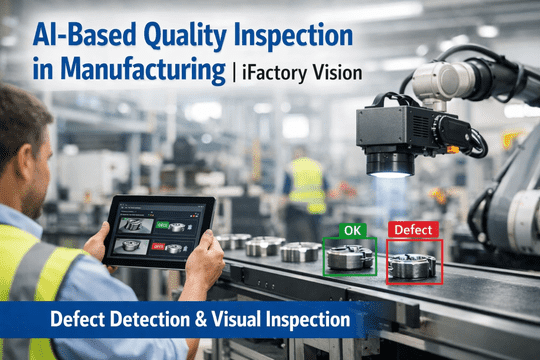
Manual inspection has been the default quality gate in manufacturing for over a century — and its true cost has stayed largely hidden inside the labor line item where nobody scrutinizes it. Every dollar of visible inspector salary sits on top of a much larger stack of invisible costs: escaped defects, warranty claims, brand damage, training churn, coverage gaps, and the shift-to-shift accuracy drift that no manager ever quantifies. This article puts real numbers against every layer, then explains how AI vision eliminates most of them at a fraction of the fully-loaded cost. To see how the math works on your specific line volume and defect mix, book a cost teardown with an iFactory advisor.
The Inspector on Your Line Costs 3× What Their Paycheck Shows
Fully-loaded labor, missed-defect escapes, warranty exposure, and shift-to-shift accuracy drift add up to a hidden bill most plants have never itemized. Here is what it actually costs — and what changes when AI catches what humans miss.
Five Hidden Costs That Never Make It Onto the Budget
The salary line is what CFOs see. Below it sits a much larger stack of costs that are real, recurring, and directly caused by human-only inspection. Most plants have never quantified any of them because they are absorbed into other budget categories — warranty, scrap, HR, and the catch-all "cost of quality."
Per warranty incident from a defect that reached a customer. Automotive and medical device recalls climb into the tens of millions, and even a single mid-tier chargeback outweighs a year of AI vision spend.
Accuracy points lost between hour one and hour eight of a shift. That drift is systematic, unavoidable, and produces defect batches that pass early in a shift but escape late.
AQL sampling covers only a small fraction of production. Everything not sampled is a coin toss on quality. A statistical shortcut becomes a customer-facing surprise.
Time to bring a new inspector to full accuracy on your specific defect taxonomy. Turnover resets the clock and forces senior inspectors off the line to train replacements.
Time to reconstruct what shipped when a customer complains. Without per-unit inspection records, audits rely on memory and paperwork rather than evidence.
The Fatigue Curve Nobody Puts on the Wall
Even the best inspectors do not hold their peak accuracy through a full shift. Sandia National Labs research shows that even top human inspectors catch about 80% of defects at peak performance — and independent studies show fatigue starts to degrade inspection accuracy within 20 to 30 minutes of repetitive visual work. Here is what the accuracy curve looks like across a real eight-hour shift.
Accuracy points shown are indicative composites from published studies; individual plants vary. The pattern — steady early, declining late — is universal to any repetitive visual task and cannot be trained out.
The Fully-Loaded Cost of One Inspector, Component by Component
Base salary is only the first floor of the cost building. Benefits, overhead, training, turnover replacement, and supervision all pile on top before you get to the true annual cost of keeping one inspector on one line for one year. The BLS reported a median annual wage for quality control inspectors of $47,460 in May 2024; here is what that number becomes when fully loaded.
Multiply by number of inspectors, then by number of shifts. A modest three-inspector, three-shift line easily crosses $800,000 per year in fully-loaded manual inspection cost — before a single warranty claim.
See Your Own Number, Not the Industry Average
Share your line volume, defect rate, and current inspector count. iFactory returns a fully-loaded manual cost, an AI-vision alternative cost, and a payback timeline — in one session, no procurement conversation required.
Head-to-Head: Same Line, Same Shift, Two Approaches
Numbers reflect published performance benchmarks across manufacturing case studies. Individual results vary with product type and defect complexity, but the direction of every metric is consistent.
The Escape Cost Cascade: $50 to $50 Million
A single missed defect rarely stays a single missed defect. Its cost compounds by orders of magnitude as it moves from the plant to the customer to the regulator. Here is the escalation path every defect can take when inspection is imperfect.
The Three-Input ROI Formula Every Plant Should Run
You do not need a spreadsheet to see whether AI vision pays back. Three inputs — line volume, current defect escape rate, and fully-loaded inspector cost — give you a defensible number in five minutes. Here is the working formula.
When Manual Inspection Still Makes Sense
AI vision is not the right answer for every station. Being clear about where human inspection still wins is how a plant decides which lines to convert first and which to leave alone. Three honest cases.
Prototype shops, tool rooms, and one-off custom builds where each part is different. AI needs enough repetition to learn, and true one-offs never provide it.
Perfume nose testing, food taste panels, textile hand-feel evaluation. These involve senses cameras do not capture, so humans stay in the loop by definition.
Certain FDA and aerospace releases still require a named human signature. AI does the 100% inspection and evidence capture; the human owns the final release decision.
The 60-Day Transition Path From Manual to AI Vision
Plants that succeed with AI vision do not switch off manual inspection on day one. They run parallel, prove the delta, and reassign inspectors to higher-value work. Sixty days is the practical timeline for the whole path.
AI vision deployed alongside existing inspectors. Both systems verdict every unit. Gap analysis identifies where each catches what the other misses.
Quality and operations sign off on AI verdicts as the primary source. Inspectors shift from checking every unit to reviewing AI flags only.
Inspectors move to defect investigation, root-cause work, and cross-line auditing. Manual coverage on-line drops to spot verification only.
Frequently Asked Questions
Are the 80% peak accuracy and 60% end-of-shift numbers universal, or just certain industries?
The direction is universal to any repetitive visual task, but the exact numbers vary by defect complexity, part speed, and inspector training. Simple pass or fail checks on high-contrast defects hold accuracy longer; subtle cosmetic or micro-scale defects degrade faster and start from a lower peak. The published Sandia benchmark and multiple industry studies converge on 70 to 80 percent as a realistic peak and 25 to 40 percent drop-off across a shift — you can benchmark your own line against those figures in a scoping session.
Do we lay off inspectors after AI vision goes in?
Very few plants do, and the ones that succeed rarely need to. Inspectors move from repetitive per-unit checking to higher-value work: investigating flagged defects, running root-cause analysis, auditing cross-shift consistency, and owning the SPC dashboard. The role becomes an engineer-adjacent quality technician position rather than a headcount cost, and the plants that make this transition well often report inspector engagement and retention improving rather than degrading.
What happens the first time the AI is wrong on a customer-facing unit?
The same thing that happens today when a human inspector is wrong — except now you have per-unit image evidence to investigate exactly what the system saw and why. Weekly model-audit workflows catch false-negative drift before it produces escapes, and every incident feeds back into retraining. Total escape rate under a properly deployed AI system typically runs an order of magnitude below the manual baseline, so the frequency of these events drops sharply from day one.
How do we make the CFO case if we cannot cleanly quantify the escape cost today?
Start with the two costs you can quantify — fully-loaded inspection labor and warranty or chargeback line items pulled from the last twelve months. Even the visible portion of those two numbers alone almost always exceeds the AI vision investment inside a year. Escape cost is the accelerator, not the base case, so the CFO conversation stands on labor and warranty math even if the harder-to-quantify brand and audit exposure is discounted entirely.
Which line should we convert first — the busiest, the most defective, or the most visible?
The line with the highest combined product of unit volume and cost-per-escape. High-volume, low-consequence lines produce good ROI but modest visibility; low-volume, high-consequence lines produce quick executive support but small labor savings. A pilot line that sits at both — regulated product, meaningful volume, quantifiable warranty history — proves the case fastest across every stakeholder group and sets up the rollout to the rest of the plant with less negotiation friction.
The Real Question Is Not Cost — It Is Compounding
Manual inspection does not fail because inspectors are bad at their job. It fails because the underlying task — perfect attention to repetitive visual detail across an eight-hour shift — is not something biology was designed to deliver. Every year a plant waits to make the transition, the escape cost compounds, the traceability gap widens, and the competitive gap versus AI-enabled peers grows a notch harder to close. The cost of AI vision is measurable. The cost of manual inspection is measurable too — most plants have just never done the measuring. Once they do, the direction of the decision is rarely in doubt.
Put a Real Number on Your Manual Inspection Cost
Book a 30-minute cost teardown with iFactory. Share your line volume, defect history, and current inspector count; leave with a fully-loaded manual cost, an AI-vision alternative cost, and a payback timeline aligned to your fiscal year.