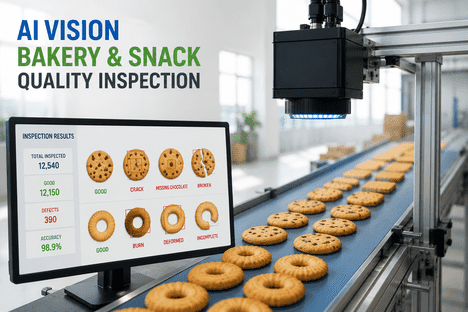
Bakery quality managers know that a customer decides whether a product is good before they ever taste it. Crust color that is too dark, a surface crack that was not there yesterday, a roll that sits two millimeters shorter than its neighbor on the shelf — these are not cosmetic opinions. They are measurable deviations that drive returns, erode brand trust, and accumulate into margin loss that most plants cannot afford to absorb at current commodity input prices. The question is not whether visual inspection matters, but whether relying on human eyes at line speed is still defensible when AI-powered vision inspection can grade every unit against a digital standard.
What Manual Inspection Actually Misses at Line Speed
Human inspectors are remarkably good at spotting gross defects — a completely collapsed loaf, a burned crust, a obviously misshapen pastry. But bakery lines running at 30 to 60 products per minute push visual inspection well past the point where human consistency holds. Research across food manufacturing shows that defect detection accuracy drops from roughly 85 percent in the first 20 minutes of a shift to below 60 percent after an hour of continuous monitoring. The defects that slip through are not dramatic failures — they are the subtle, incremental deviations that a tired eye normalizes but a retailer or end consumer immediately notices.
A loaf that is three L* values darker than the golden standard looks acceptable to an inspector who has been staring at the same crust color for 45 minutes. To a retailer comparing it against the previous delivery, it looks like a different product. This is the single most common source of shelf-level rejection in packaged bread.
Cracks under two millimeters wide are virtually invisible to the naked eye at line speed but propagate during packaging and distribution, turning into visible break points by the time the product reaches retail. Manual inspectors catch cracks larger than two millimeters; AI vision reliably detects fractures below half a millimeter.
Dough temperature drift, proofing humidity variation, and oven zone temperature changes cause products to shrink gradually across a shift. Each individual unit looks close enough to the spec, but by the end of the run the batch average has drifted two to four millimeters below target height — enough to fail a retailer audit.
Checkweighers catch units that fall below the statutory minimum, but they do not flag the trend of a product line drifting three to five grams lighter over several hours. By the time the checkweigher rejects a unit, dozens of marginally underweight products have already passed — each one a potential compliance violation and a raw material cost that was baked in but not sold at weight.
Four Inspection Pillars for Bakery AI Vision Systems
A production-grade bakery vision system does not try to inspect everything at once. It breaks the quality question into four measurable dimensions, each with its own sensor logic, calibration standard, and pass-fail criteria. The four pillars below represent the inspection framework that mature bakery operations deploy, and each one addresses a specific defect category that shows up in return rates and retail audits.
How Crust Color Grading Works in Practice
The Maillard reaction that produces crust browning follows a predictable color progression as temperature and time increase. That progression maps cleanly onto the CIE L*a*b* color space, where L* measures lightness on a scale of 0 (black) to 100 (white), a* measures red-green shift, and b* measures yellow-blue shift. For bakery crust inspection, L* is the primary control metric because it tracks the browning curve directly, while a* and b* serve as secondary indicators that can flag abnormal color shifts — for example, a high a* value might indicate excessive caramelization rather than normal Maillard browning.
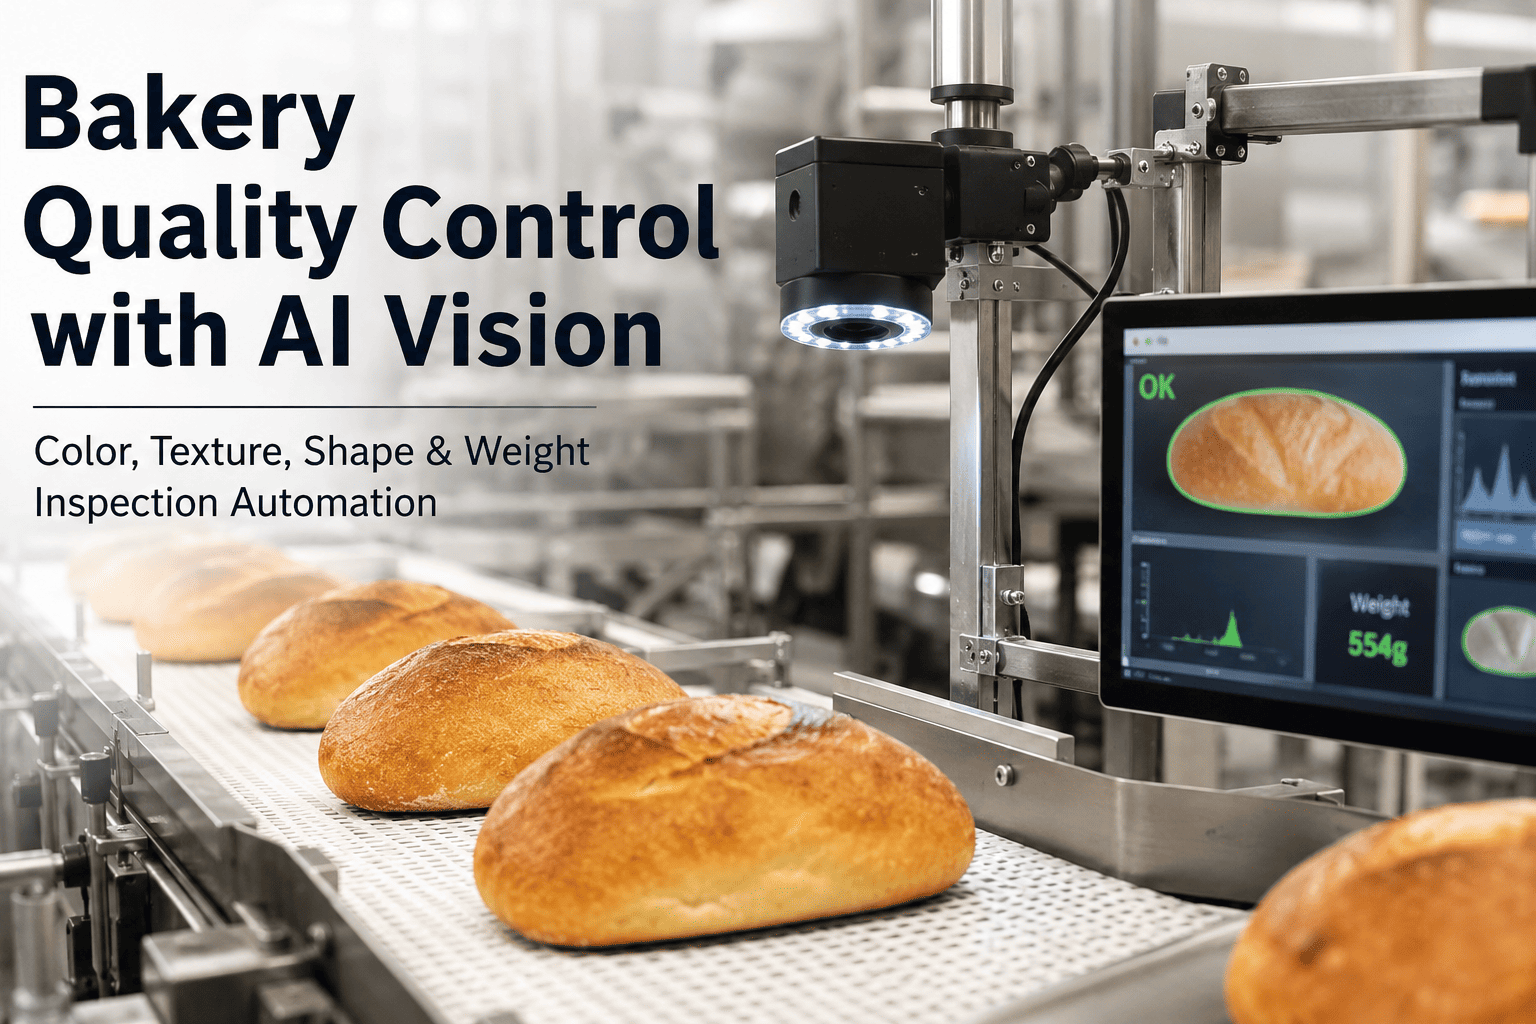
A typical system captures a top-view image of each product as it exits the oven or cooling tunnel, extracts a region of interest covering the crust surface, converts the pixel data from the camera's native RGB to L*a*b*, and compares the mean L* value against the product's target range. If the measured L* falls within the defined tolerance — say L* 48 plus or minus 3 for a premium sandwich loaf — the unit passes. If it falls outside, the system logs the image, triggers a reject actuator, and records the deviation in the quality dashboard. The entire cycle takes 30 to 50 milliseconds per unit, which is fast enough for lines running at 60 PPM or higher.
Manual Sorting vs. AI Vision at 40 Products Per Minute
| Inspection Dimension | Manual Sorting at 40 PPM | AI Vision at 40 PPM |
|---|---|---|
| Color consistency | Varies by shift; inspector fatigue after 30 min | Same L*a*b* standard applied to every unit with zero drift |
| Surface crack detection | Catches cracks wider than 2mm reliably | Detects fractures below 0.5mm with consistent sensitivity |
| Dimensional accuracy | Spot-checked with calipers on 1 to 2 percent of output | 100 percent of units measured against CAD tolerance bands |
| Weight trend monitoring | Checkweigher catches extremes, not gradual drift | Size-to-weight correlation flags drift before statutory failure |
| Record keeping | Paper logs, inconsistent entry, hard to retrieve | Timestamped images and automatic reject logging per unit |
| Standardization | Different operators apply different thresholds daily | One digital standard, zero subjective variation across shifts |
Deployment on a Running Bakery Production Line
Installing vision inspection on a line that cannot afford downtime requires a phased approach that separates physical installation from system calibration. The physical work — camera mounting, lighting fixture installation, and network cabling — is typically completed during a scheduled maintenance window or product changeover. The calibration and validation work happens in parallel with normal production, using the system in shadow mode so that no reject decisions are acted on until the quality team has confirmed that the model agrees with their judgment on a statistically significant sample set.
The stage that determines whether the system earns long-term trust is validation, not installation. Quality managers should insist on a shadow-mode period of at least two weeks where the system runs alongside current inspection, and where every disagreement between the AI and the human inspector is reviewed and resolved. This is also where the false-positive and false-negative rates are established, and where threshold adjustments are made against the plant's actual product variability rather than a generic bakery dataset. Skipping this step to accelerate go-live is the most common reason bakery vision pilots get disabled within six months.
The Margin Impact of Catching Visual Defects Earlier
The financial case for bakery vision inspection is not built on a single dramatic number — it is built on the compounding effect of catching small deviations before they become large costs. A rejected unit at the end of the line has already consumed raw materials, energy, labor, and oven capacity. A unit that passes inspection but gets returned by a retailer has additionally consumed packaging, distribution, and shelf space, plus it has damaged the supplier relationship. The further a defect travels before it is caught, the more expensive it becomes, and the data below shows where those costs accumulate for a typical medium-scale bakery operation.
Consumer research across packaged baked goods consistently shows that crust color is the primary visual cue buyers use to judge freshness and quality — ahead of packaging, brand mark, or even price point. Products within the same delivery that show visible color variation create an immediate perception of inconsistent manufacturing standards, even when the variation is well within the plant's internal tolerance. Retail buyers for private label contracts routinely specify exact L* ranges in their quality agreements, and a single delivery that falls outside those ranges can trigger a formal corrective action request. The cost of that corrective action — documentation, root cause investigation, re-inspection, and the credibility hit with the buyer — typically exceeds the cost of the rejected product by a factor of five to ten. AI vision inspection eliminates color variation as a supplier risk by making every unit conform to the same measurable standard, not a subjective visual impression.