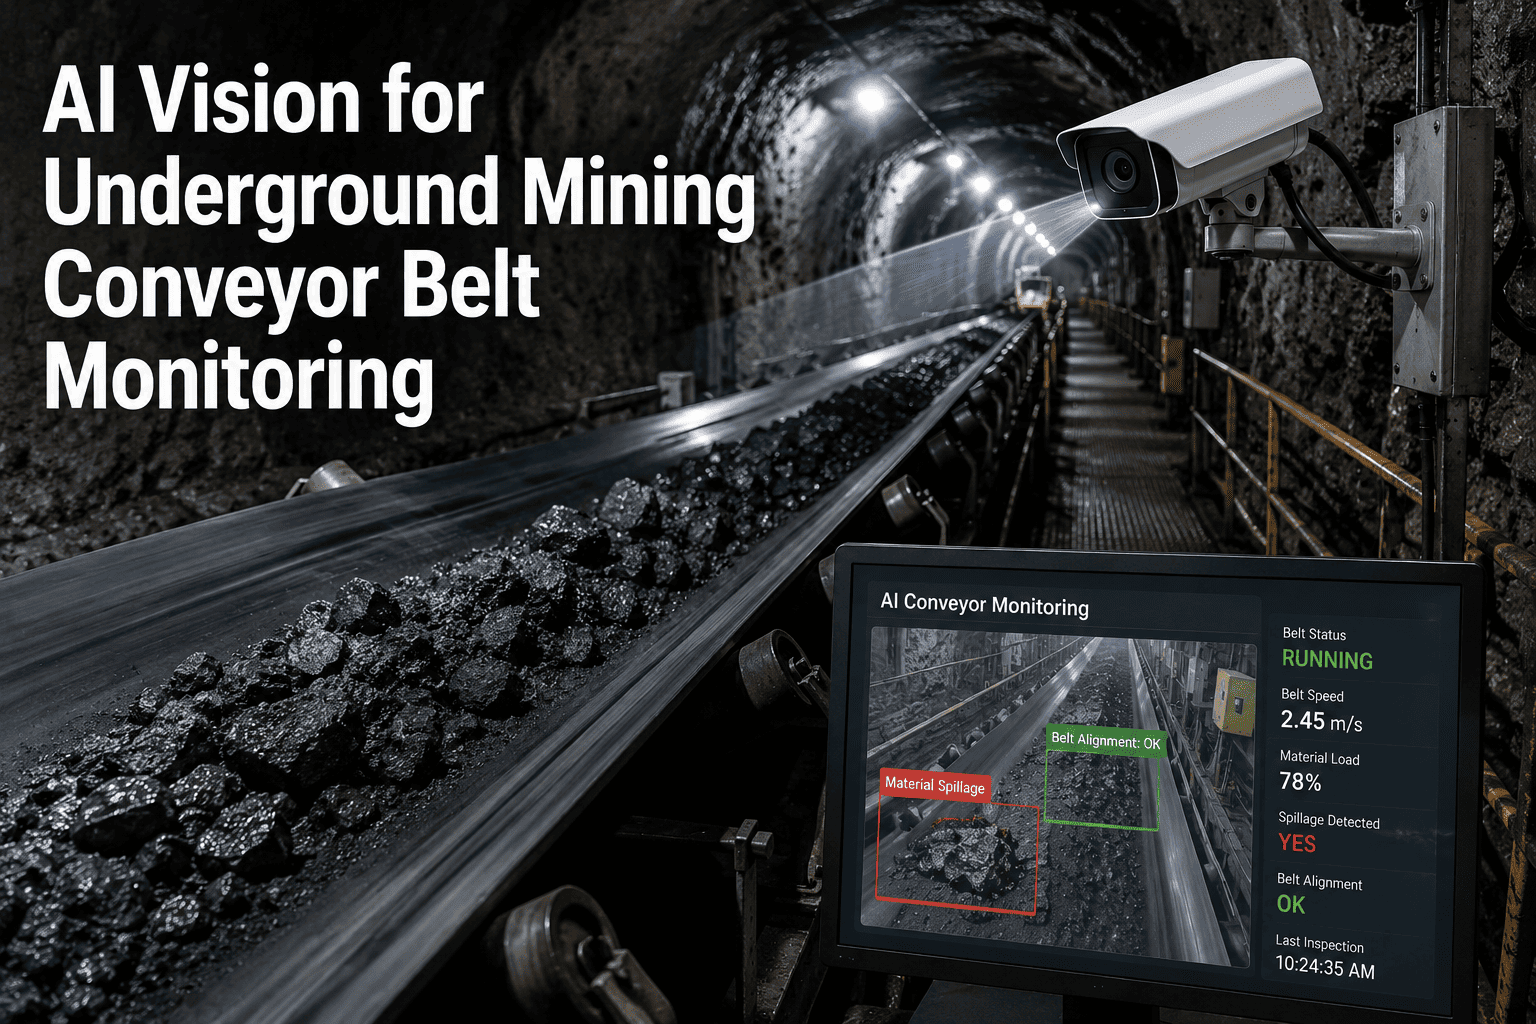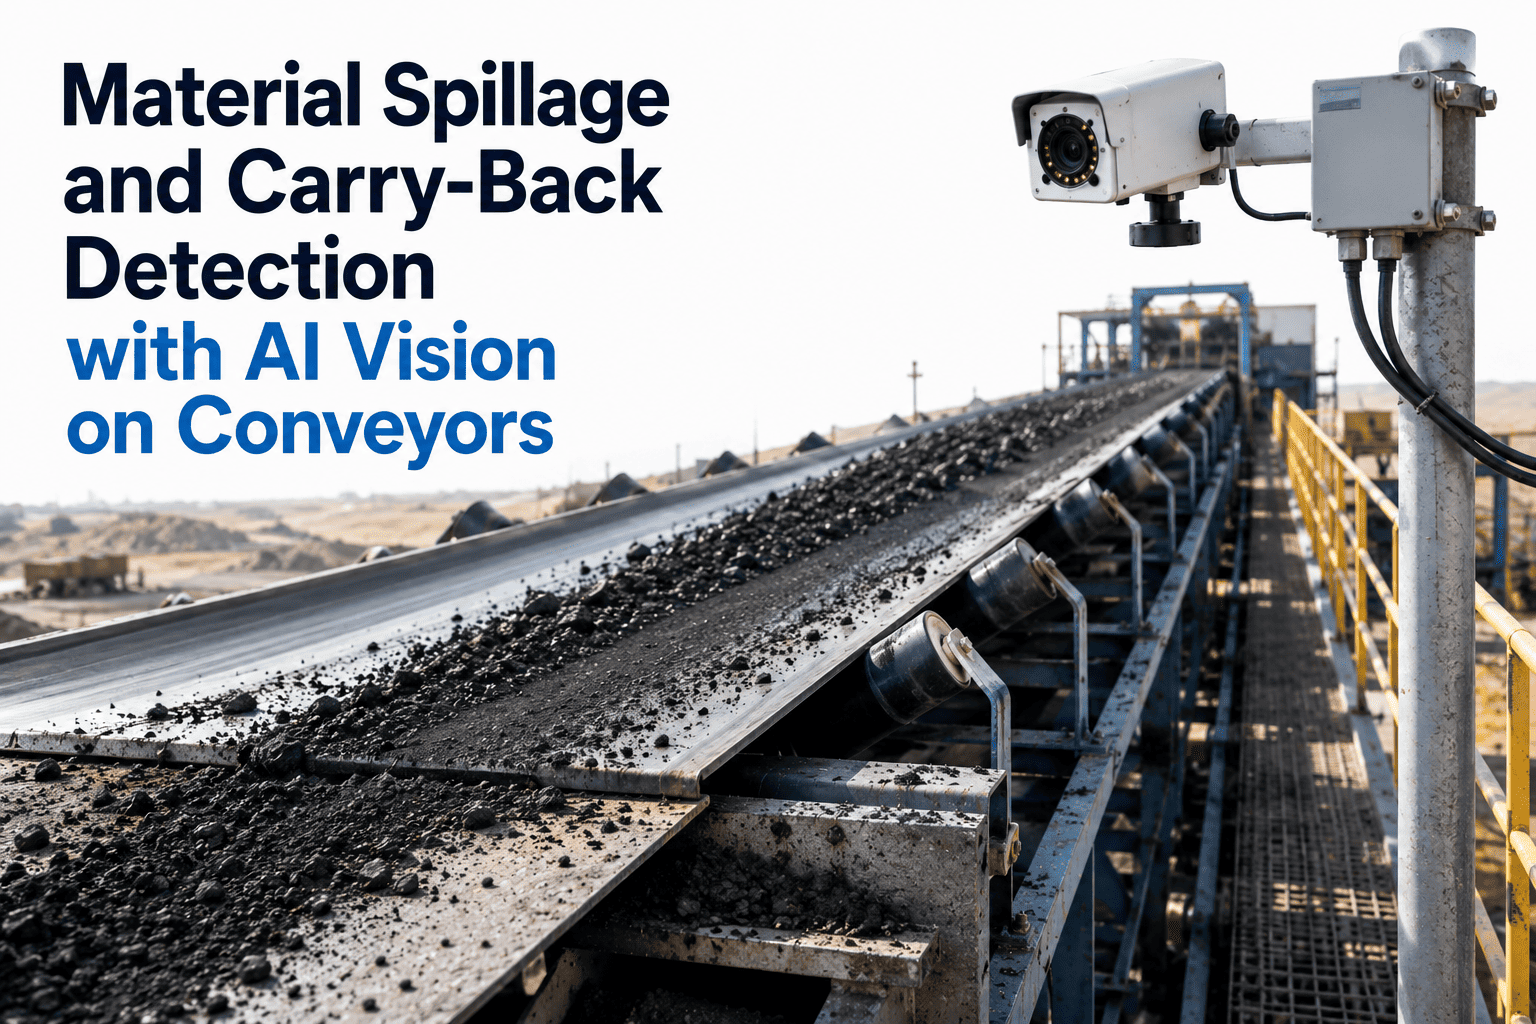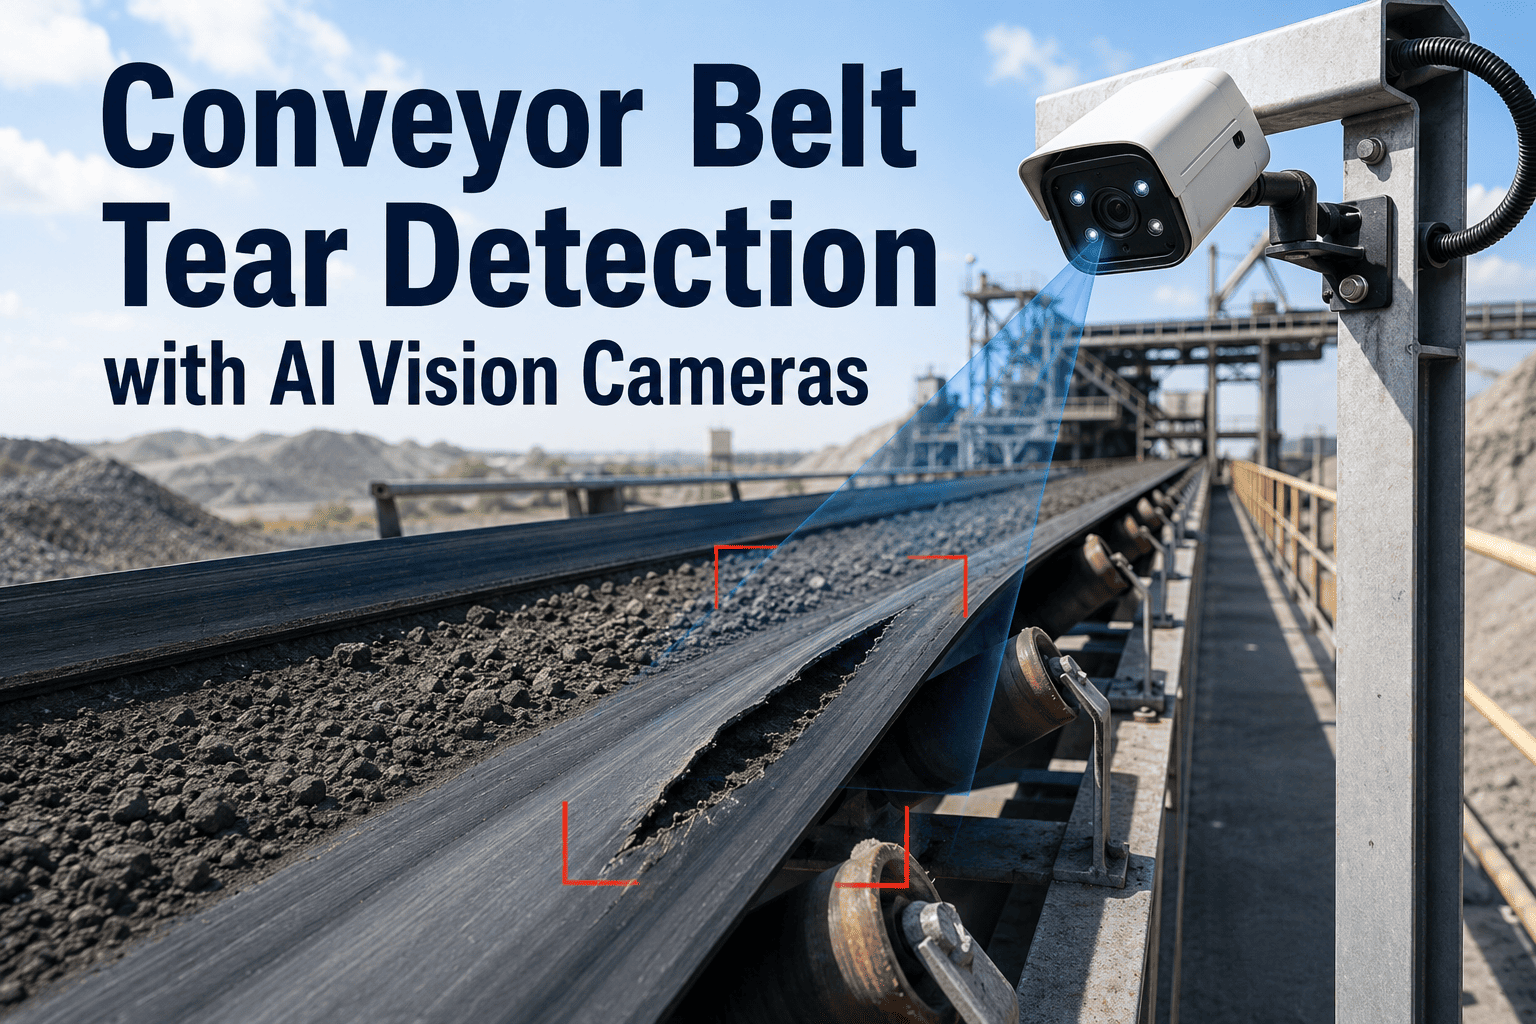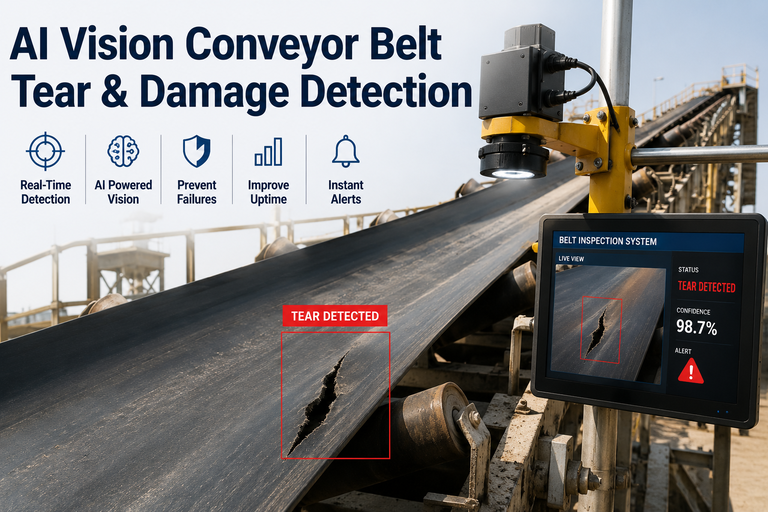
Every conveyor moving bulk material leaks — some visibly, most silently. Coal fines dropping off return idlers, ore fragments sliding past skirtboards, aggregate carrying back on the belt underside, packaged goods slipping off belt edges at transfer points. These losses are so continuous that most plants treat them as fixed operational cost. AI vision on conveyors changes that equation by watching every metre of belt, quantifying what escapes, and triggering cleanup before losses compound into downtime. To see this in your handling environment, Book a Demo with iFactory AI.
Continuous AI Vision for Spillage & Material Loss on Every Conveyor.
iFactory AI deploys vision cameras that quantify spillage volume, detect carry-back events, and monitor belt edge losses in real time — routing every event into your CMMS as a work order.
Why Spillage and Carry-Back Quietly Drain Bulk Handling Operations
Industry benchmarks are consistent and sobering. Without effective belt cleaning, as much as three percent of total cargo can be lost to spillage, dust, and carry-back across a conveyor's operational life. Carry-back alone accounts for roughly eighty-five percent of all conveyor maintenance issues — a small continuous loss that cascades into idler failure and unplanned downtime. When a primary conveyor stops in a mine or cement plant, the loss runs fifty to one hundred thousand dollars per day.
The visibility problem is what makes spillage persistent. A belt scraper losing two percent efficiency may generate over ten thousand tonnes of additional floor material across a forty-conveyor plant in a year — invisible until cleanup labour spikes or a bearing fails. AI vision closes the gap by making spillage visible as it happens, quantifying it in volume and location.
Cargo Lost Annually
Total cargo lost to spillage, dust, and carry-back on conveyors without effective belt cleaning and monitoring.
Of Maintenance Issues
Conveyor maintenance problems traceable to carry-back accumulation on idlers, return rollers, and belt underside surfaces.
Per Day Downtime
Upper-range production loss when a primary bulk handling conveyor goes offline in mining, cement, or power generation.
Idler Replacements
Return idler replacements at a major lignite mining operation traced directly to carry-back material wear on rolling components.
What AI Vision Actually Sees on a Conveyor Belt
A vision camera trained on conveyor conditions does not just record footage. It analyses the belt, the material, and the space around them frame by frame at industrial belt speeds — classifying specific loss events with precision human walkdowns cannot match. The four categories below are the highest-value events iFactory AI's vision models identify and route into corrective workflows.
Transfer Point Spillage
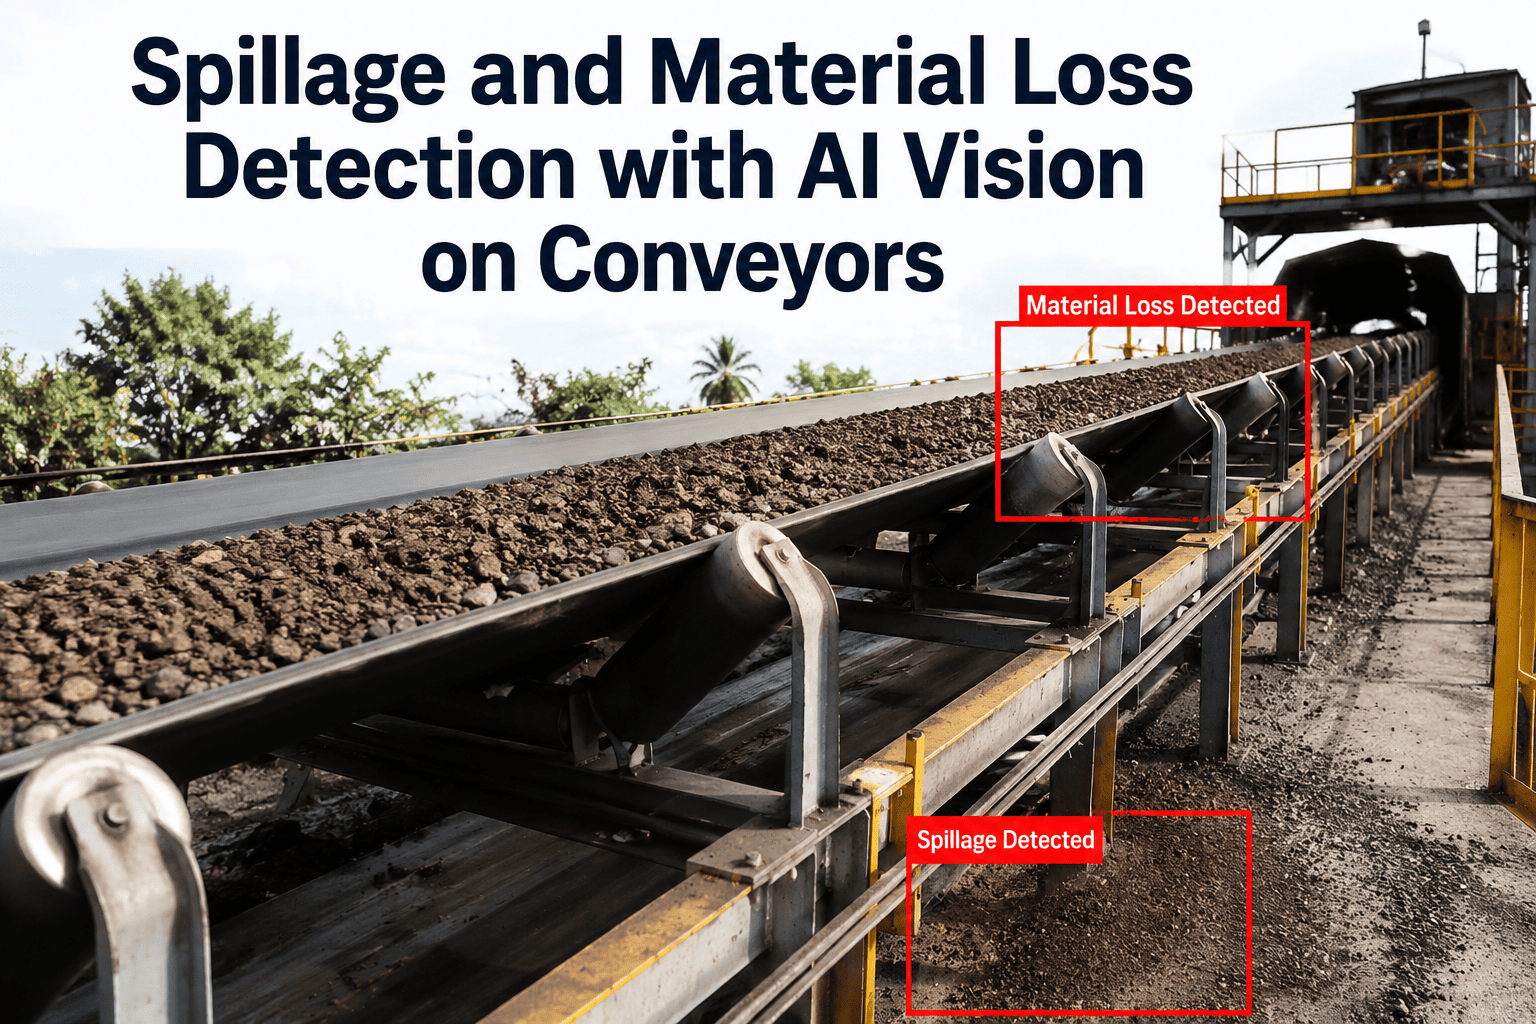
The load zone is where most gravity spillage occurs — material bouncing off the belt after chute impact, or overflowing skirtboards during overload. AI vision measures accumulated volume beneath transfer points, converting the visual signature into a quantified spillage rate in kilograms per hour with location precision.
Load Zone MonitoringCarry-Back Detection on Return Belt
Material that fails to discharge at the head pulley clings to the belt underside and falls off along the return path. Vision cameras detect the thickness of adhered material, classify severity, and correlate to scraper condition — allowing teams to service scrapers before idler damage occurs.
Return-Side AnalysisBelt Edge Loss & Mistracking Overflow
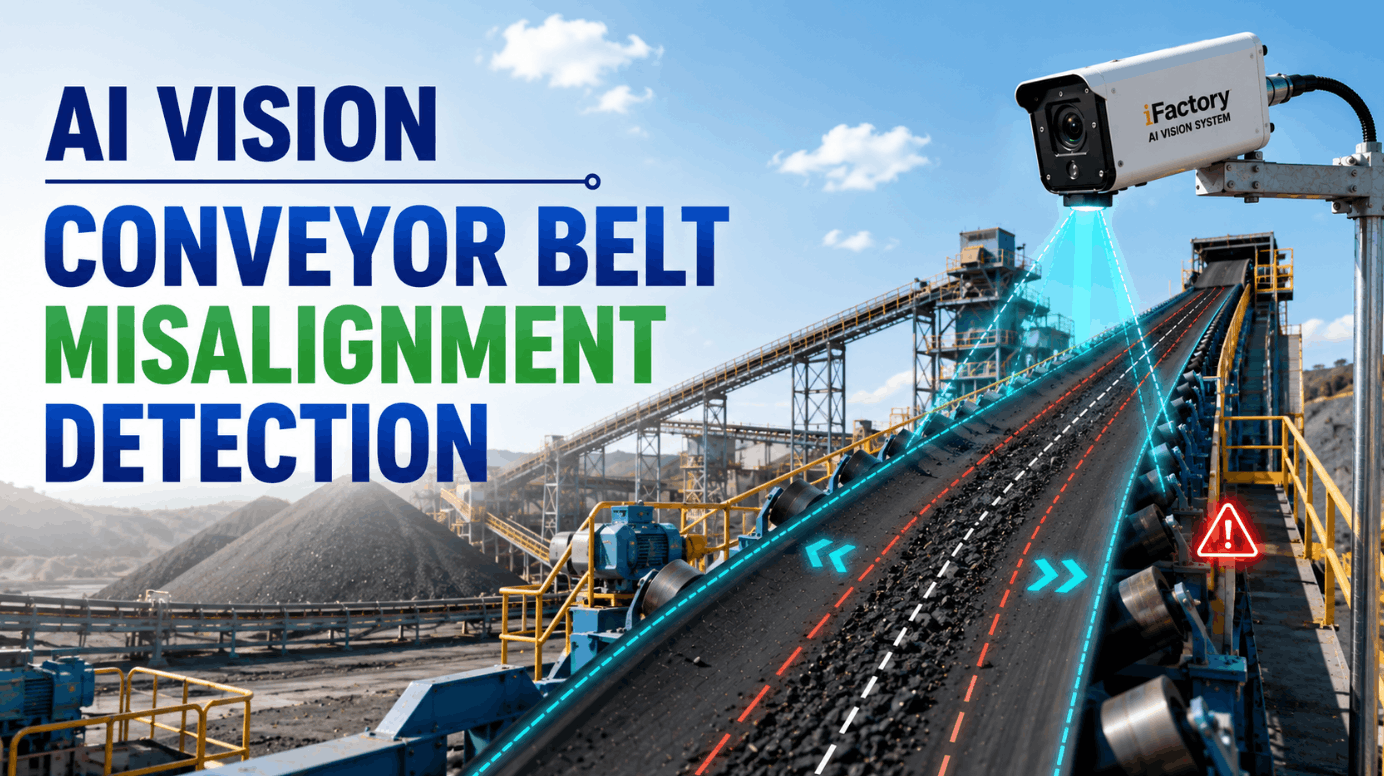
When the belt drifts off centreline, material spills over the edge into the space between belt and frame. AI vision tracks centreline position pixel-by-pixel against the frame reference, detects lateral deviation the moment it exceeds tolerance, and flags the associated edge loss.
Edge ContainmentVolumetric Loss Quantification
Beyond detection, AI vision quantifies the material at loss. By analysing accumulation depth and area across monitored zones, the platform produces daily and shift-level loss volume estimates — closing the gap between loaded tonnage and delivered tonnage in throughput reconciliation.
Loss AccountingHow the AI Vision Detection Pipeline Works From Camera to Work Order
The value of AI vision on a conveyor is not the detection alone — it is the closed loop from a pixel-level event on the belt to a documented maintenance action. The pipeline below describes how iFactory AI structures this loop across four stages, each measurable, auditable, and integrated with plant control systems.
Edge Camera Capture
Ruggedised industrial cameras mounted at load zones, transfer points, and return-side locations capture continuous video at industrial frame rates. Specialised optics handle dust, low light, and vibration typical of mining and cement environments.
Deep Learning Classification
Edge processors run vision models trained on thousands of hours of conveyor footage across diverse materials and lighting. Each frame is classified for spillage type, severity, and volume — with results streamed back to the central platform.
Alert & Quantification
Detection events are severity-scored, timestamped, and location-tagged. Real-time alerts push to operations dashboards while cumulative loss volumes are aggregated for shift, daily, and monthly loss reporting.
Automated Work Order
Where an event exceeds the threshold, the integration layer generates a structured CMMS work order with photo evidence, location, and severity attached — closing the loop between detection and corrective cleanup or belt realignment.
Quantify What You Are Losing Today Before You Decide What to Deploy.
iFactory AI's team runs a structured loss assessment on your conveyor network — camera-based spillage sampling, carry-back scoring, and a projected ROI for continuous vision deployment.
What Operations Teams Are Measuring After AI Vision Deployment
The outcomes below reflect what mining, cement, and power operators have documented after deploying continuous AI vision on material handling conveyors. The metrics span material recovery, labour reallocation, and asset life extension — the three cost centres where spillage historically consumes the most operational budget.
Reduction in manual cleanup hours per week after vision-triggered cleanup replaces fixed-interval walkdown routines.
Fewer premature return idler replacements when carry-back is scored continuously and scrapers serviced on evidence.
Cargo recovered when spillage sources are quantified and eliminated at transfer points and scraper interfaces.
Typical time to full payback when material recovery, labour savings, and idler-life extension are combined.
Manual Walkdowns vs. Load-Cell Reconciliation vs. AI Vision Monitoring
Bulk handling operations have historically relied on manual belt walkdowns or throughput reconciliation across weighbridges to detect material loss. Both methods have persistent gaps that AI vision closes. The table below captures the practical differences plant teams experience when moving to continuous vision-based monitoring.
| Detection Dimension | Manual Walkdowns | Load-Cell Reconciliation | AI Vision Monitoring |
|---|---|---|---|
| Detection latency | Hours to shifts | Daily comparison | Seconds to minutes |
| Location precision | Rough zone | Cannot localise loss | Camera-frame accuracy |
| Volume quantification | Visual estimation | Aggregate mass difference | Per-event volume scoring |
| Belt path coverage | Sampled points only | Whole system average | Continuous across zones |
| Root cause visibility | Inferred after the fact | Not available | Direct visual evidence |
| Work order integration | Manual reporting | Not connected | Auto-generated with evidence |
| Unmanned shift coverage | Absent | Blind to source | Full continuous coverage |
How Plants Deploy Conveyor Vision Without Disrupting Production
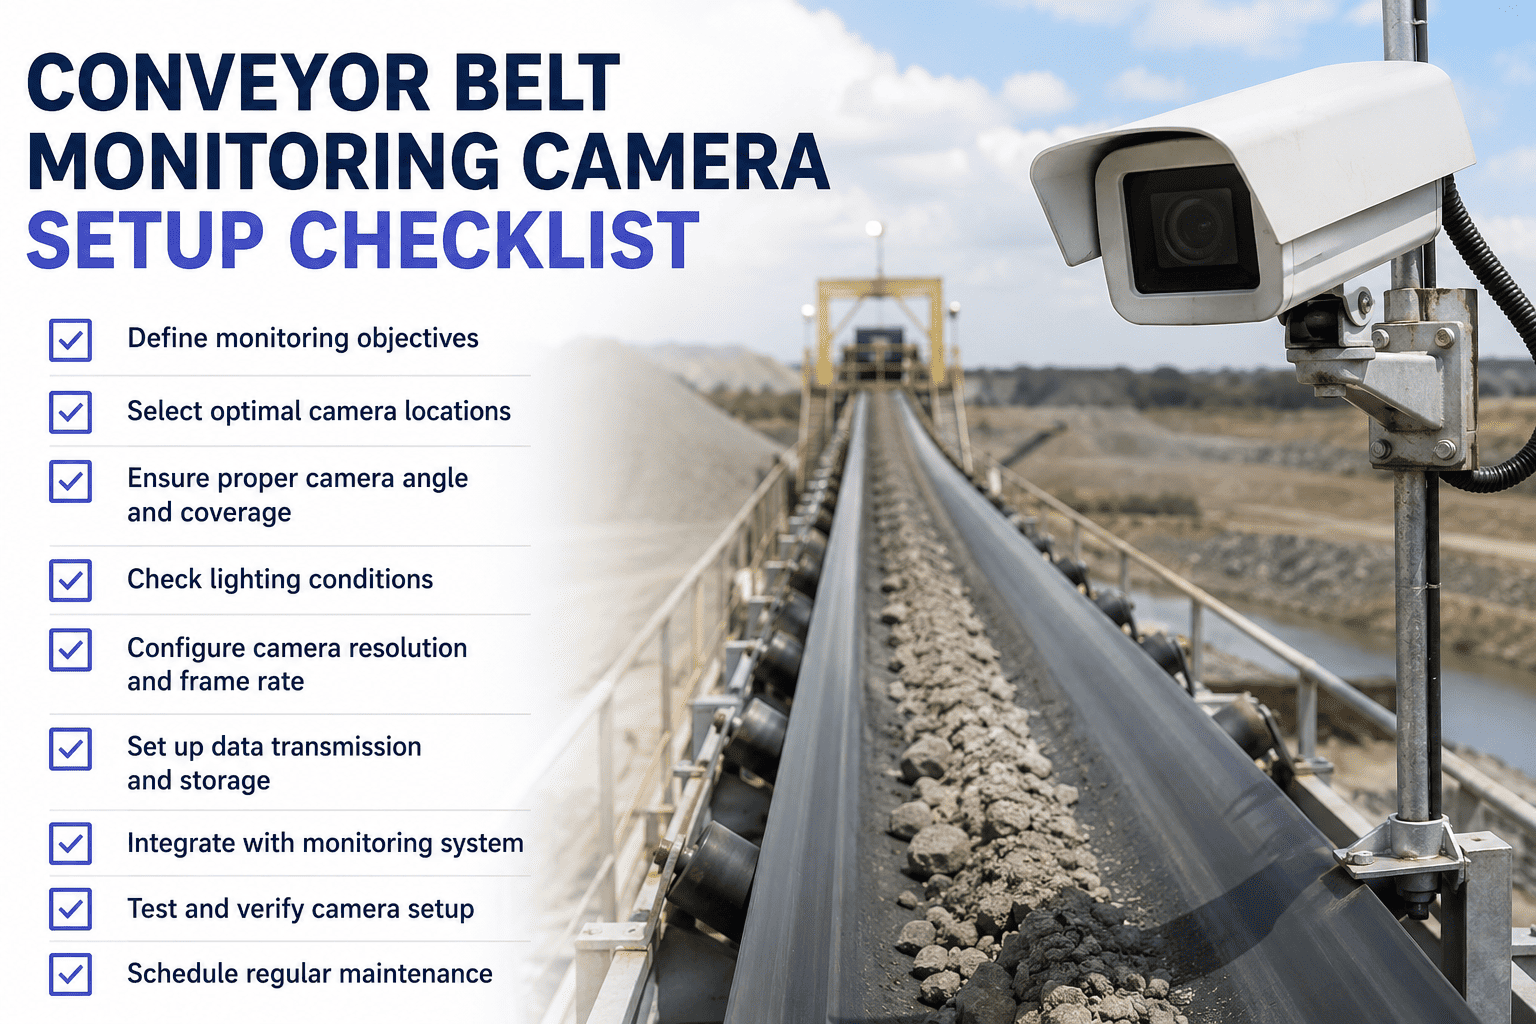
The deployment sequence follows a proven phased approach that lets a plant validate detection accuracy and ROI on a single high-value asset before scaling across the network. Every phase completes with an operational handover, so the plant is never stuck in a proof-of-concept environment that has to be rebuilt for production.
Site Survey & Camera Placement
Engineers walk the target conveyor network with plant leads to identify highest-value monitoring points — transfer points, load zones, and mistracking-prone runs. Camera specs, mounting locations, and network path are finalised.
Timeline: 1–2 Weeks · DiscoveryCamera Install & Model Calibration
Ruggedised cameras and edge processors are installed at survey locations. The vision model is calibrated against the plant's specific material, belt colour, and lighting using labelled footage from the first two weeks of live operation.
Timeline: 3–5 Weeks · SetupCMMS Integration & Alerts
The vision detection layer connects to the plant CMMS through REST or OPC-UA. Alert thresholds are configured per conveyor zone and severity level. Work order templates route every event to the correct maintenance team.
Timeline: 6–8 Weeks · ActivationNetwork Rollout & Loss Reporting
Once the pilot conveyor demonstrates reliable detection and loss reduction, deployment expands across the wider network. Daily, weekly, and monthly loss reports are established for operations leadership and reliability teams.
Timeline: 9–16 Weeks · ScaleWhere AI Vision Spillage Detection Delivers the Highest Value
The economic case is strongest where material value is high, spillage compounds into safety hazard, or downtime cost per hour is extreme. The sector snapshots below illustrate where iFactory AI's spillage detection platform is delivering measurable returns in 2026 deployments.
Overland & Underground Belt Networks
Copper, iron ore, and coal operations run overland conveyors where manual inspection intervals are hours apart. Vision cameras deliver continuous coverage across kilometres of belt connecting stockpiles to processing plants.
Clinker, Raw Meal & Dispatch
Cement plants manage kilometres of internal belt from quarry feed through kiln discharge to dispatch. Spillage of clinker and cement fines creates material loss and combustible dust hazard — vision addresses both.
Coal Yards & Fuel Handling
Coal-fired stations handle millions of tonnes through belts where fugitive dust triggers regulatory action. Vision detection produces the audit trail MSHA and environmental regulators increasingly expect.
Ship Loaders & Stockyard Belts
Terminals handle diverse cargoes with different spillage signatures — grain, iron ore, alumina, fertiliser. Vision detection adapts across material types and provides reconciliation data for cargo accounting.
Grain, Sugar & Ingredient Handling
Food-grade conveyors face zero-tolerance for material loss because spillage represents both product loss and contamination risk. Vision provides continuous documentation food safety audits require.
Sinter Plants & Raw Material Yards
Integrated steel plants operate extensive belt networks handling iron ore, coke, and sinter at high temperature. Vision reduces fugitive material at transfer points and prevents belt fires from hot spillage.
From Continuous Loss to Continuous Recovery on Every Conveyor
The move from reactive spillage management to continuous vision monitoring changes the economics of bulk handling. What was a fixed cost — the labour, the loss, the accelerated wear — becomes a variable cost that is measured, targeted, and reduced through evidence. Plants deploying continuous vision on high-throughput conveyors report cleanup labour reductions above sixty percent, idler consumption reductions in the same range, and belt life pushing from twelve months toward eighteen on heavily loaded assets.
The path from first camera to plant-wide coverage typically completes within a single fiscal year and delivers measurable savings from the first month. iFactory AI structures every deployment around this economic reality — starting with the highest-value conveyor, proving the recovery, then scaling across the network with a documented case behind every new camera.
AI Vision Spillage & Material Loss Detection — FAQs
How does AI vision quantify actual spillage volume, not just detect it?
The vision model analyses accumulation depth and covered area across each camera-monitored zone, then converts those measurements into estimated tonnage using calibrated reference geometry for that specific conveyor and material. Volume estimates are reconciled against actual cleanup collection data during commissioning, producing a per-zone loss rate that operations teams can use for throughput accounting. To see calibrated volume outputs on your material, Book a Demo with the iFactory AI team.
Can the cameras operate reliably in dusty, low-light mining and cement environments?
Yes — iFactory AI uses ruggedised industrial cameras with sealed enclosures, integrated illumination, and specialised optics engineered for dust-laden and vibration-heavy conditions typical of mining, cement, and coal handling. The vision model is trained on footage from equivalent operating environments so it maintains detection accuracy through dust plumes and lighting variability that consumer cameras would not tolerate.
Does the system integrate with our existing CMMS and control platforms?
Yes — the platform exposes detection events through OPC-UA and REST APIs, allowing direct integration with PLC and SCADA control systems as well as CMMS platforms including OxMaint, SAP PM, and Maximo. Detection events can either trigger automated control actions such as belt speed reduction or generate structured CMMS work orders with evidence attached. Our integration team handles the connectivity work — Contact our expert to review your specific stack.
How many cameras does a typical conveyor network need?
Camera density is driven by the number of transfer points, load zones, and mistracking-prone belt sections rather than raw belt length. A typical mid-size cement plant deploys eight to fifteen cameras for full coverage of the critical raw material and clinker conveyors; larger overland mining belts often start with three to five cameras positioned at the highest-value monitoring points and expand from there based on documented recovery.
What is the realistic payback period for AI vision spillage deployment?
Most bulk handling operations reach full payback within four to eight months when material recovery, cleanup labour savings, and extended idler and belt life are combined. Payback is fastest in high-throughput coal, cement, and iron ore operations where even a one-percent reduction in material loss represents significant recovered value across a single quarter of continuous operation and reporting.
Turn Spillage From a Fixed Cost Into a Measured, Recovered Value.
Book a working session with iFactory AI's conveyor vision team. We will map your highest-loss belt sections, quantify projected recovery, and outline a deployment roadmap sized for your operation.