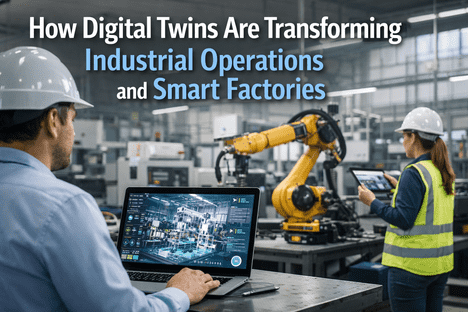
How Digital Twins Are Transforming Industrial Operations and Smart Factories
By Josh Brook on April 13, 2026
A consumer goods manufacturer running 160 plants worldwide had the same problem every plant manager knows: machines broke at unpredictable times, production schedules slipped, waste accumulated, and nobody could see the full picture across sites. They built a digital twin of their entire global manufacturing supply chain — a living virtual replica fed by real-time sensor data from every production line. The twin became a virtual operating room: operators could see machine health, simulate changeover sequences before executing them, and predict failures days in advance. The results within the first year — 65% less unplanned downtime, 20% energy reduction, and 15% less scrap — saved $52 million annually. The most revealing part was not what the twin found, but what it revealed they had been unable to see: thousands of micro-inefficiencies hiding across 160 plants that no spreadsheet, no walk-through, and no monthly report had ever surfaced. That is the power of a digital twin.
iFactory Digital Twin Intelligence
How Digital Twins Are Transforming Industrial Operations and Smart Factories
From static models to living replicas — how virtual factories that breathe real-time data are rewriting the rules of industrial performance
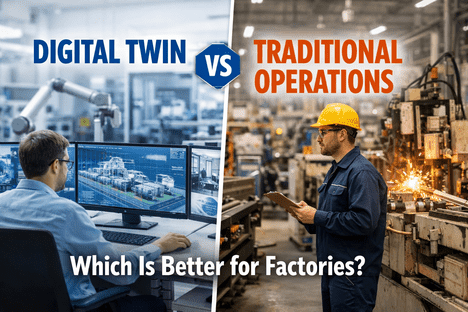
What a Digital Twin Actually Is — And What It Is Not
A digital twin is not a 3D model. It is not a dashboard. It is not a CAD drawing rendered in a browser. A digital twin is a living, data-driven virtual replica of a physical asset, process, or entire factory that mirrors real-time conditions, learns from historical data, predicts future behaviour, and enables simulation of changes before they are made in the physical world.
The distinction matters because most of the confusion — and most of the failed implementations — come from treating digital twins as visualisation tools. A true digital twin receives continuous sensor data from its physical counterpart, runs physics-based and AI models against that data, and provides actionable predictions. It is not a picture of your factory. It is a working model that behaves like your factory.
The Digital Twin Maturity Spectrum
Level 1
3D Visualisation
Static 3D model of the asset or plant. Looks impressive but contains no live data. Cannot predict, simulate, or optimise anything.
Not a digital twin
Level 2
Connected Mirror
3D model with live sensor data overlaid. Shows current state but cannot predict future behaviour or simulate changes.
Data-enriched model
Level 3
Predictive Twin
Live data + ML models that detect anomalies, predict failures, and forecast performance. Answers the question: "what will happen next?"
True digital twin
Level 4
Prescriptive Twin
Predicts, simulates alternatives, and recommends optimal actions. Answers: "what should we do?" Tests changes virtually before physical execution.
Advanced digital twin
Level 5
Autonomous Twin
Predicts, decides, and acts — closed-loop control. Adjusts machine parameters, rebalances lines, and optimises energy autonomously in real time.
Digital twins operate at three distinct scales — each solving different problems, delivering different ROI, and requiring different implementation approaches. Understanding these scales is essential for choosing the right starting point.
Asset Twin
Machine Level
Virtual replica of a single machine — CNC mill, compressor, turbine, motor. Integrates vibration, thermal, current, and operational data to predict failures and optimise performance.
200–500%
First-year ROI from downtime avoidance
88–97%
Remaining Useful Life prediction accuracy
Fastest ROI — start here
Process Twin
Production Line Level
Virtual replica of a production line or process flow. Maps material movement between machines, identifies bottlenecks through utilisation analysis, and simulates throughput under varying conditions.
10–15%
Throughput increase from bottleneck elimination
30–50%
Commissioning time reduction via virtual testing
Highest throughput impact
Plant Twin
Factory Level
Comprehensive model of the entire facility — all lines, utilities, logistics, workforce, and energy systems. Optimises production scheduling, capacity planning, and factory-wide energy management.
5–8%
Total cost reduction from integrated optimisation
$37.9B
Annual value if fully adopted across U.S. manufacturing
Full ecosystem optimisation
Six Ways Digital Twins Transform Factory Operations
Digital twins deliver value through six distinct streams — each independently justifiable, but compounding when deployed together. Here is where the documented, measurable impact lies.
01
Predictive Maintenance & Failure Prevention
Digital twin models integrate vibration, thermal, and electrical sensor data with physics-based degradation models to predict Remaining Useful Life with 88–97% accuracy. Maintenance happens during planned windows. Failures are prevented, not repaired.
65% reduction in unplanned downtime
02
Virtual Commissioning & Process Simulation
Test new production layouts, equipment additions, and process changes in the virtual environment before physical execution. Identify bottlenecks, validate cycle times, and optimise material flow — eliminating costly on-floor trial-and-error.
Up to 50% faster development cycles
03
Real-Time Quality Optimisation
Process parameter drift is detected in real time by comparing live conditions against the twin's optimal model. The twin identifies when temperature, pressure, speed, or torque is trending toward a defect-producing range — triggering corrections before scrap is created.
15–20% scrap and rework reduction
04
Energy & Sustainability Management
The twin models energy consumption across every machine, HVAC zone, and utility system — revealing waste patterns invisible to monthly bills. AI optimises power usage in real time, automatically adjusting non-critical loads during peak pricing and identifying equipment running inefficiently.
Up to 20% energy cost reduction
05
Capacity Planning & What-If Analysis
Before committing capital, simulate the impact: What happens if we add a third shift? A new product line? A 20% volume increase? The twin stress-tests scenarios with real production data — validating CapEx decisions before a single dollar is spent.
Simulation-validated CapEx decisions
06
Supply Chain & Logistics Optimisation
Digital twins extend beyond the factory walls — modelling inventory flows, supplier lead times, and distribution networks. The twin tests disruption scenarios and optimises reorder points, improving fulfilment while reducing safety stock.
30% better forecast accuracy, 50–80% fewer delays
The ROI Case — What Digital Twins Actually Deliver
The financial returns from digital twin deployments are documented across hundreds of implementations globally. Whether you start with a single asset or a full factory twin, the ROI patterns are consistent and measurable.
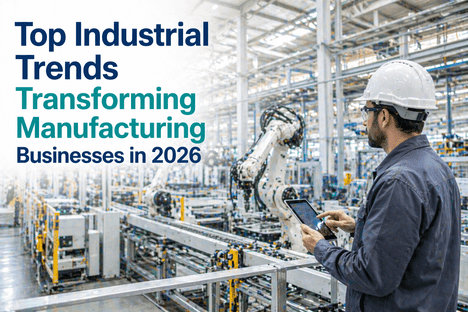
Industry Adoption — Who Is Using Digital Twins Today
Digital twin adoption is highest in industries where asset criticality, regulatory requirements, and downtime costs make the ROI case undeniable. Here is where adoption stands in 2026.
Aerospace & Defence
70%+ adoption
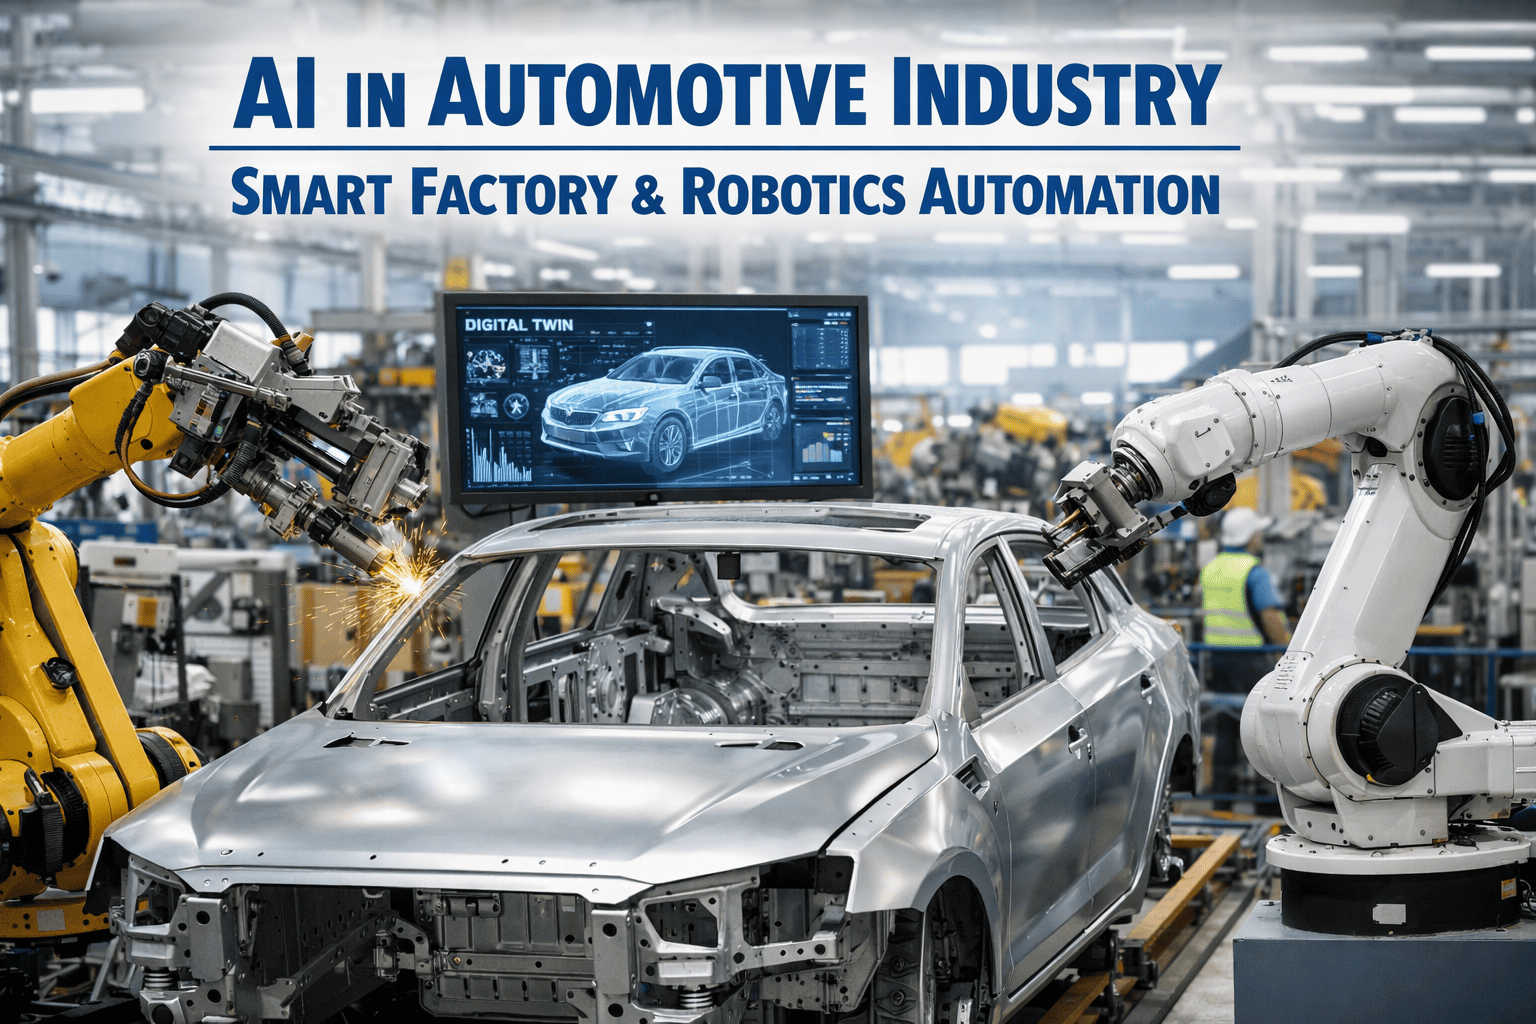
Automotive & EV
70%+ adoption
Electronics Manufacturing
70%+ adoption
Energy & Utilities
70%+ adoption
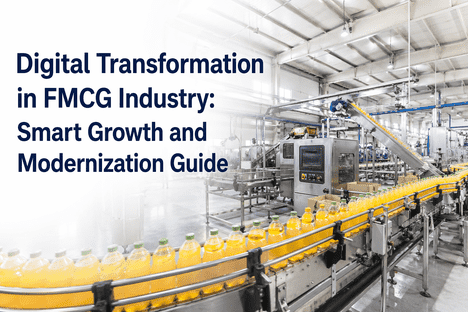
Food, Beverage & Pharma
30–50% adoption
Chemicals & Process
30–50% adoption
Textiles & Light Manufacturing
Under 30%
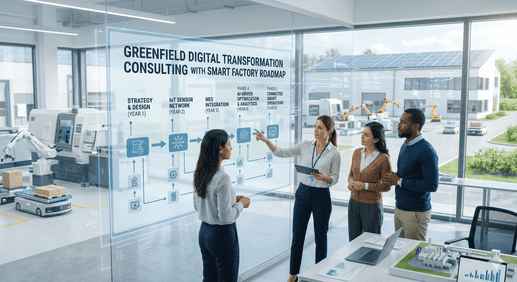
Getting Started — The Practical Implementation Path
75% of organisations that implemented digital twins reported difficulty scaling beyond initial pilots. The technology works — the challenge is implementation strategy. Here is the approach that delivers results consistently.
Phase 1
Start With One Critical Asset
Pick the machine with the highest downtime cost, failure frequency, or safety risk. Deploy sensors, connect to an edge gateway, and build a single asset twin. Prove ROI on this one machine before anything else.
Week 1–6
Phase 2
Expand to Production Line Twin
Once asset-level visibility is proven, map material flow between machines using MES data. Identify bottleneck machines through utilisation analysis. Model the production line as a connected system.
Week 6–16
Phase 3
Build the Plant-Level Twin
Integrate ERP demand forecasts with shop floor capacity models. Add energy systems, utility routing, and workforce data. The plant twin becomes the single source of truth for operational decisions.
Week 14–26
Phase 4
Scale, Optimise & Automate
Extend the twin across multiple sites. Enable closed-loop automation — the twin recommends and executes optimisations autonomously. Continuously retrain models as production conditions evolve.
Month 6+ (ongoing)
Frequently Asked Questions
How is a digital twin different from a simulation or a 3D model?
A simulation runs a one-time scenario with assumed inputs. A 3D model is a static visual representation. A digital twin is a living model that continuously receives real-time sensor data from its physical counterpart, learns from historical patterns, predicts future behaviour, and enables what-if testing. It evolves as the physical asset evolves — unlike a simulation that is frozen in the moment it was created.
Can digital twins work with legacy or older equipment?
Yes. Non-invasive sensors (vibration, temperature, current, acoustic) retrofit onto virtually any machine regardless of age. Edge gateways connect to legacy PLCs via protocols like Modbus and OPC UA to extract operational data. Pre-built models for common industrial equipment reduce the cold-start problem from months to weeks. Some of the highest ROI comes from twinning aging, failure-prone assets.
What does a digital twin implementation cost?
Pilot projects on a single critical asset can start under $50,000 with subscription-based pricing of $2K–$10K per month. Facility-wide implementations typically range from $200K–$800K and generate $1–3.5 million in annual operational improvements. Payback is typically achieved within 14–24 months. Cloud-based platforms and modular architectures have made digital twins accessible to SMEs for the first time.
How long does it take to see results?
Asset-level twins deliver measurable results within 4–8 weeks after sensor deployment — typically by identifying previously unknown failure patterns or performance losses. Production line twins show throughput improvements within 3–4 months. Full plant-level twins optimise over 6–12 months as models mature and integration deepens.
Is this technology only for large enterprises?
No. Cloud-based platforms, pay-per-asset pricing, and pre-built equipment models have dramatically lowered the barrier. SMEs can launch pilots on a single machine and scale as benefits materialise. The ROI is often more impactful for smaller operations that need to optimise limited resources — 65% of maintenance teams plan to use AI by end of 2026, and cloud platforms are making it accessible to plants of every size.
Ready to Build Your Factory's Digital Twin?
Every Machine in Your Plant Has a Story to Tell. A Digital Twin Lets You Read It.
iFactory deploys digital twin technology across your production assets — creating virtual replicas that simulate, predict, and optimise operations. Start with one machine, prove ROI, and scale to a complete factory twin.