How SPC Reduces Process Variability in Food Production
By Josh Brook on May 29, 2026
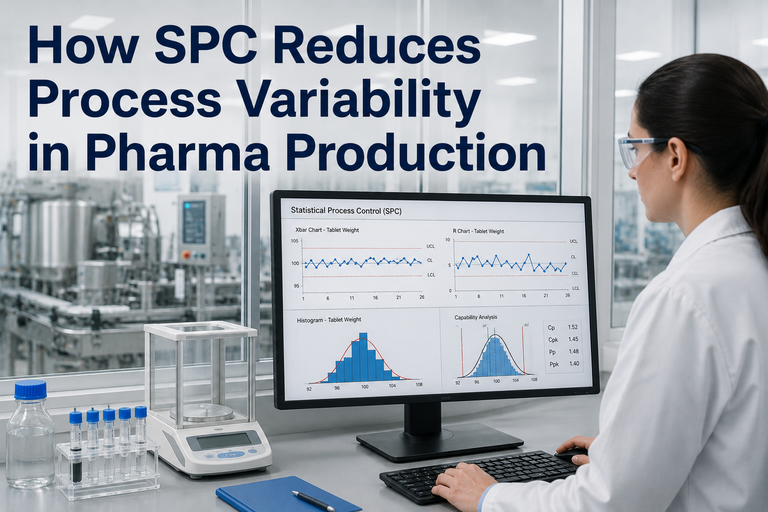
Every food quality complaint and every dollar of product given away for free traces back to the same root cause: variation. A fill head that drifts half a gram heavy ships free product on every package, all shift, all year. A cooking step that swings a few degrees produces a batch that tastes different from the last one. An inspector at the end of the line can sort the good from the bad — but by then the variation has already done its damage, and you have paid to make product you now have to scrap. Statistical process control flips that. Instead of catching defects after they exist, it watches the process itself and narrows the spread before a single out-of-spec unit is made. A well-run SPC monitoring system turns dosing, cooking, filling, and packaging from sources of waste into stable, predictable steps.
iFactory Quality Intelligence
How SPC Reduces Process Variability in Food Production
Narrow variation in dosing, cooking, filling, and packaging — cut giveaway, kill quality complaints, and turn an unstable line into a capable, predictable one.
Every process has variation; where there is variation, there is waste. The breakthrough insight of SPC is that not all variation is the same. Common-cause variation is the natural, inherent noise of a stable process. Special-cause variation comes from something specific that changed — a worn valve, a new ingredient lot, a temperature swing. You manage these two completely differently, and confusing them is the most expensive mistake in process control.
Common Cause
The Process Talking
Natural, always-present variation inherent to a stable process. You reduce it by improving the process itself — better equipment, tighter targets, less inherent spread. Reacting to it as if it were a problem (over-adjusting) actually makes variation worse.
Special Cause
Something Changed
A specific, identifiable disturbance — valve wear, a bad lot, a setting drift. It shows up as a point outside the limits or a non-random pattern. You react to it immediately, find the root cause, and remove it.
How SPC Narrows the Spread
The whole game is reducing the width of the distribution and centering it on target. A wide, off-center spread spills over the specification limits — those overflows are your complaints and your giveaway. As SPC tightens the process, the same specification suddenly has room to spare. This is the picture every operations team should have in their head.
Before and After: Tightening the Distribution
Wide spread — tails cross the spec limits, creating defects and giveaway
Narrow, centered — the whole distribution fits well inside spec, Cpk above 1.33
Where Variation Hides on a Food Line
Food production is really four variation-prone stages in sequence, each with its own failure modes. SPC adds the most value where variation has direct financial consequences. Here is where to point it first, and what it catches in each stage.
Dosing
Worn augers, drifting loss-in-weight feeders, gearbox wear cause dose-to-dose swings
SPC on feeder rate and downstream checkweigher back-calculation catches drift between calibrations, before recipe ratios go off.
Cooking
Temperature swings and time variation change taste, texture, and pathogen kill
Control charts on cook temperature and dwell time hold the band tight — protecting both consistency and HACCP critical limits.
Filling
Valve wear and head-to-head variation drive overfill and giveaway
Fill-weight SPC monitors mean drift and variance per head; CUSUM charts flag a 0.8% low-drift before it ever exits the tolerance band.
Packaging
Seal jaw wear and temperature drift narrow seal width and risk seal failure
X-bar charts on seal width catch the gradual narrowing that precedes a seal-integrity failure, before a burst-pressure miss.
Want to see which of your four stages is leaking the most giveaway right now? Book a 30-minute SPC walkthrough and we'll run live charts on your line data.
The Giveaway Math Nobody Likes to See
Overfilling is the quietest cost in food manufacturing. Plants run heavy on purpose to avoid the legal and regulatory risk of underweight packages — but every gram above the minimum is product handed to the customer for free. SPC lets you safely re-target closer to the limit, because a tighter, well-understood distribution needs less of a safety margin.
1
Wide spread, fearful target
Uncertain variation forces a high target to keep the low tail above minimum weight — large giveaway every package.
2
SPC tightens the spread
Control charts shrink variance and reveal the true, stable distribution head by head.
3
Re-target safely lower
A narrow distribution sits closer to minimum without crossing it — 1.5 to 2.4% giveaway recovered straight to margin.
From Capable to Provable: Cp and Cpk
Once a process is stable, capability indices tell you whether it can actually hold the specification — and give you the audit-ready proof regulators and customers want. Cp measures the potential; Cpk accounts for whether the process is actually centered. Both above 1.33 is the mark of a capable food process.
Cp
Process potential — how well the spread fits inside the spec range, ignoring centering. The "voice of the customer" over the "voice of the process."
Cpk
Real-world capability — accounts for how off-center the mean sits. Reported as the worse of the two sides, since the nearer limit carries the higher risk.
>1.33 Target
The threshold for a reliably capable process — strong evidence of consistent quality even when slight variation occurs.
Compliance Proof
Cp and Cpk statistically validate process controls for FDA, HACCP, and GFSI — turning "we think it's fine" into documented evidence.
Inspection Catches; SPC Prevents
The reason SPC beats end-of-line inspection is structural, and it follows what Deming called the reaction chain: reduce variation, and fewer defects, less rework, lower cost, and more capacity all follow. Inspection only tells you good-or-bad after the money is spent. SPC tells you the process is drifting while you can still steer it.
The SPC Variation-Reduction Loop
1
Measure
Live Data
Checkweighers, inline gauges, and sensors feed charts in real time
2
Chart
Spot Signals
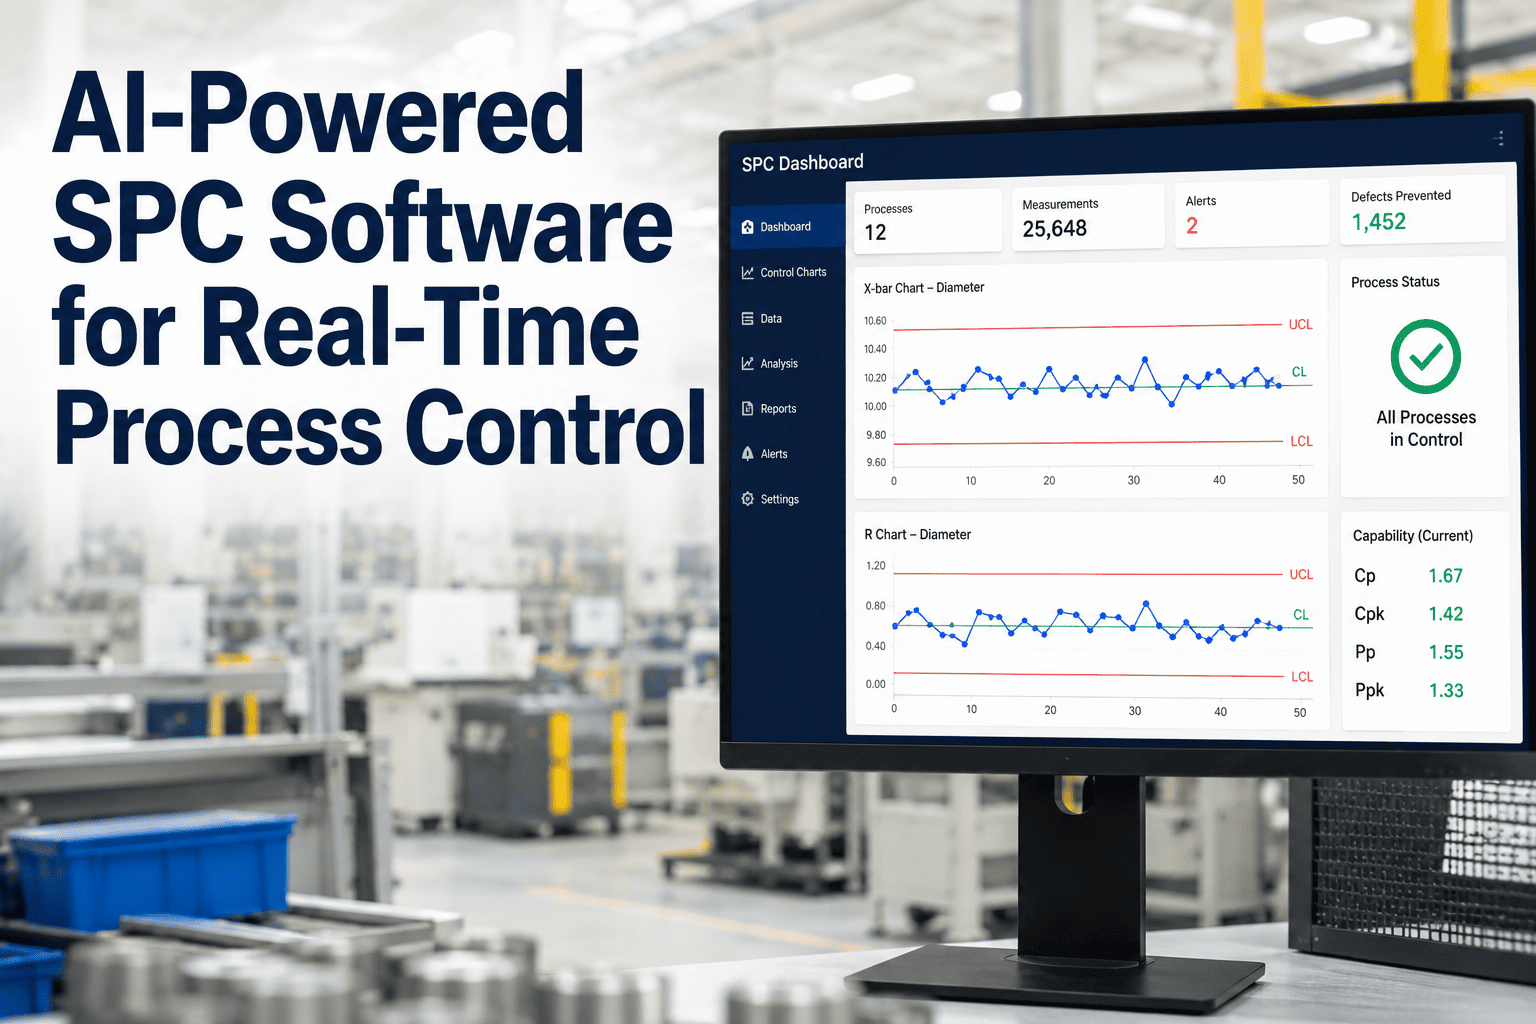
X-bar, R, and CUSUM charts separate common from special cause
3
Act
Correct Early
Operators fix the special cause before a single bad unit ships
4
Improve
Re-target
Tighter distribution lets you safely re-center and cut giveaway
What Reducing Variation Delivers
Narrowing variation is not an abstract quality goal — it converts to recovered margin, fewer complaints, and provable compliance. These figures come from SPC and process-capability field data across food and FMCG manufacturing.
1.5-2.4%
Giveaway recovered
on AI-monitored fill lines vs checkweigher control alone
0.8%
Drift caught early
CUSUM flags valve-wear drift before it exits tolerance
>1.33
Cpk achievable
stable, centered processes that hold spec reliably
Fewer
Defects & rework
the Deming reaction chain from less variation
Every gain starts with charting the process instead of inspecting the output. Want the giveaway and capability analysis run on your lines? Talk to our quality engineers.
Frequently Asked Questions
How is SPC different from the inspection we already do?
Inspection sorts finished product into good and bad after it's made — it tells you nothing about why, and the cost is already sunk. SPC watches the process variable itself in real time, so it catches drift before defects exist. Inspection is the lowest rung of food quality control; SPC moves the control point upstream to where you can still prevent the loss.
If a point is within spec, why would SPC still flag it?
Because control limits and specification limits are different things. Spec limits are the customer's requirement; control limits (set around ±3 standard deviations) describe the process's own natural voice. A point inside spec but outside the control limits — or a non-random pattern — signals a special cause that's changing the process, a warning you'd miss if you only checked against spec.
Won't adjusting the line every time a reading moves reduce variation?
No — that's the most common and costly SPC mistake. Reacting to normal common-cause variation as if it were a problem (over-adjusting, or "tampering") actually increases variation. SPC's value is precisely in telling you when not to touch the process versus when a genuine special cause demands action.
How does tighter variation actually save money on giveaway?
Plants overfill to keep the low tail of the weight distribution above the legal minimum. The wider and less understood that distribution, the bigger the safety margin they build in — all of it free product. Once SPC shrinks the spread and proves it's stable, you can re-target closer to the minimum without risking underweights, recovering 1.5 to 2.4% straight to margin.
What does a Cpk above 1.33 actually mean for us?
It means your process spread fits comfortably inside the specification with the mean well-centered — strong evidence you'll consistently meet quality standards even with slight variation. Beyond the operational benefit, Cp and Cpk statistically validate your controls for FDA, HACCP, and GFSI audits, turning a subjective "it's under control" into documented proof.
Stop Inspecting Waste. Start Preventing It.
See SPC Narrow Your Variation — on Your Own Line Data, in 30 Minutes
Bring a process you suspect is running wide — a fill head, a cook step, a doser. We'll build live control charts, separate common from special cause, calculate Cp and Cpk, and show exactly where you can re-target to cut giveaway. Your numbers, on a real SPC platform.