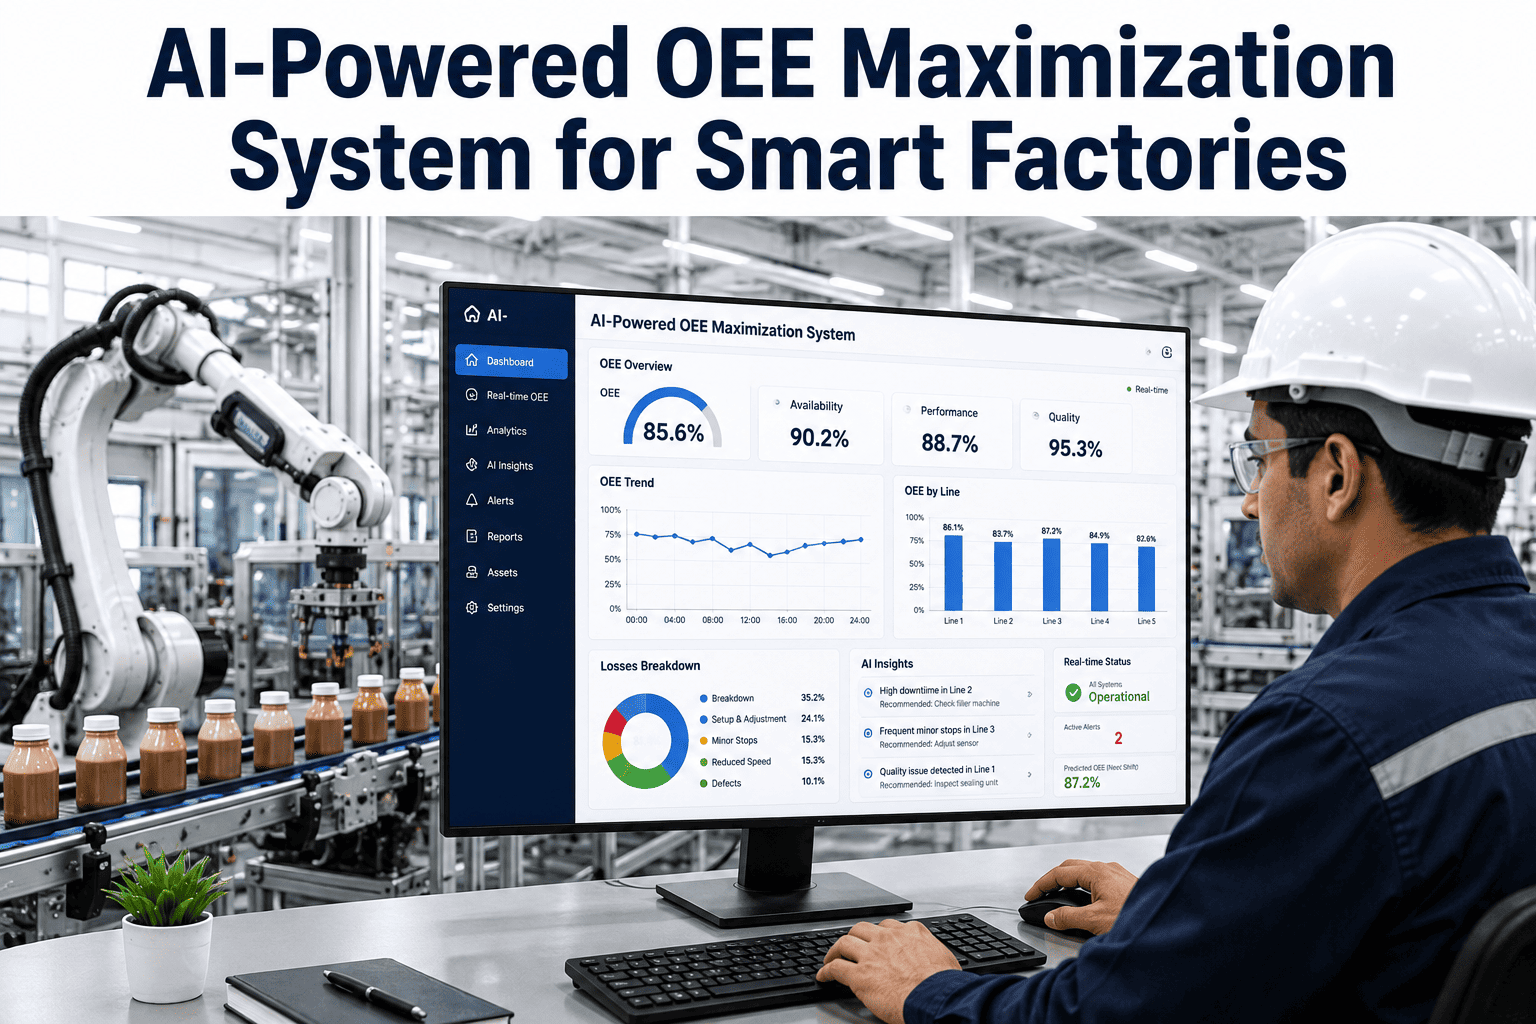
Overall Equipment Effectiveness sounds like a single number, but the plants that actually move it tend to treat it as three separate problems instead: availability lost to downtime, performance lost to running slower than the ideal cycle time, and quality lost to scrap and rework. Most operations still collect that data through manual downtime logs and shift-end paperwork, which means the numbers used to make improvement decisions are often a rough approximation written from memory hours after the actual loss occurred. An AI-powered OEE system replaces that guesswork with automated data collection straight from the equipment, live dashboards the floor can see in real time, and loss categorization detailed enough to actually act on. A short walkthrough with our team shows what that shift looks like against your current OEE tracking process.
Smart Factory Platform · OEE Optimization
AI-Powered OEE Maximization System for Smart Factories
Automated data collection, real-time dashboards, detailed loss categorization, and Best Run Shift benchmarking that turn OEE from a lagging monthly report into a live number the floor can act on today.
Live
OEE visibility instead of end-of-shift math
3
core components tracked and broken out separately
Automated
downtime and reason-code capture
The Manual Logging Problem
A Number Built From Memory Is Only as Good as the Memory
Manual OEE tracking usually looks like an operator noting downtime start and stop times on a paper log or a shared spreadsheet, then assigning a reason code from memory once the line is running again. Short stops under a few minutes often don't get logged at all, even though they're frequently the single largest source of availability loss on a well-running line, because nobody has time to write down and categorize forty small interruptions across a shift. The reason codes that do get recorded skew toward whatever was easiest to remember or easiest to write down, which means the loss categories that look biggest on a monthly report often reflect logging habits more than actual root cause. Improvement teams then spend real effort chasing the categories the data points to, only to find the underlying issue was something the manual log never captured accurately in the first place. This creates a frustrating cycle for continuous improvement teams: they act in good faith on the data available to them, invest real time and capital chasing the wrong lever, and then have to explain why the OEE number didn't move the way the project business case predicted it would.
The Three Components
Availability, Performance, and Quality Each Tell a Different Story
A single OEE percentage hides which of the three underlying components is actually driving the loss, and each one points toward a completely different fix. Breaking the number apart is what turns OEE from a scorecard into a diagnostic tool.
Availability
Time lost to unplanned stops, changeovers, and breakdowns against total scheduled production time.
Performance
Speed lost when the line runs below its ideal cycle time, even while technically running without stopping.
Quality
Output lost to scrap, rework, and parts that don't meet specification on the first pass.
See Your Real Loss Breakdown, Not the Logged Version
Most plants have never seen an automated loss breakdown next to their manually logged version side by side. A short session shows the gap for your own line.
Applied Example
How a Hidden Pattern of Micro-Stops Gets Found and Fixed
Consider a packaging line where the manual downtime log shows a handful of longer stoppages each shift, mostly tied to changeovers, with availability loss attributed almost entirely to those events. Automated data collection pulling directly from the line controller tells a different story: dozens of stops under ninety seconds each, scattered throughout the shift, none of them significant enough on their own for an operator to stop and log, but collectively responsible for more lost availability than every changeover combined. The dashboard groups these micro-stops by the specific station where they cluster, revealing a single infeed sensor that's misaligned just enough to cause an intermittent jam roughly once every fifteen minutes. Maintenance realigns the sensor during the next changeover, and availability at that line improves by a margin the manual log had never been able to reveal, because it had never been capturing the actual pattern in the first place.
Best Run Shift Benchmarking
What the Line Is Actually Capable of on Its Best Day
A theoretical maximum OEE calculated from equipment specifications rarely matches what a line can realistically achieve under real operating conditions, which makes it a poor improvement target. A more useful benchmark comes from the line's own best documented shift, the highest OEE it has actually achieved under real conditions with real operators, real materials, and real changeovers. Comparing every other shift against that proven, achievable number turns the improvement conversation from an abstract target into a concrete question: what was different about the best shift, and how much of that difference can be made the standard instead of the exception.
What's Actually at Stake
Where Inaccurate OEE Data Actually Costs a Plant
The direct cost of poor OEE visibility is misallocated improvement effort, spending capital and engineering time chasing the loss category the manual data points to instead of the one actually driving the biggest gap. There's a compounding cost in capacity planning too: a plant that believes its lines are running at a certain OEE will plan production schedules and customer commitments around that number, and a gap between reported and actual performance eventually surfaces as a missed delivery or a scramble to add unplanned overtime. Quality loss carries its own hidden cost beyond the scrapped material itself, since every defective unit still consumed machine time, labor, and often raw material that a first-pass-correct unit would have used more efficiently, meaning a quality problem quietly erodes both the quality and the effective capacity components of OEE at the same time. Labor cost follows the same pattern in a less visible way, since operators, technicians, and supervisors all spend time compensating for gaps in the data itself, manually reconstructing what happened on a shift instead of spending that time on the improvement work the data was supposed to support.
OEE has been around for decades, and most plants I've worked with already track it in some form, but tracking it and trusting it are different things. I've seen improvement teams spend months chasing a downtime category that looked biggest on paper, only to find the real issue was buried in the noise of dozens of short stops nobody ever wrote down. Automated data collection doesn't change what OEE measures, it changes whether the number you're looking at is actually true.
Priyash Devendran
Continuous Improvement Manager · 15 years in discrete manufacturing
Getting Started Guidance
What to Confirm Before Automating OEE Tracking on a Line
A short readiness check up front shows how quickly a pilot line can move from manual logs to automated, real-time OEE.
| Question | Why It Matters |
|---|
| What data does the line controller or PLC already expose? | Determines how much of the data pull can happen immediately |
| How is downtime currently logged and reason-coded on this line? | Sets the baseline the automated version gets compared against |
| What's the ideal cycle time used for performance calculations? | Confirms the benchmark used to measure performance loss accurately |
| Who reviews OEE data today and how often is it discussed? | Defines who the live dashboard should be built for first |
Common Questions
AI-Powered OEE Maximization — Frequently Asked
These are the questions plant managers and continuous improvement teams tend to ask first before automating OEE tracking.
Does this replace our operators logging downtime manually?
Automated data collection captures start and stop times directly from the equipment, removing the need for operators to manually log every stoppage, though operator input can still add helpful context to a reason code the system flags automatically. This tends to free up operator attention for actually running the line rather than tracking paperwork alongside it.
Book a demo to see how automated capture and operator input work together.
How does the system assign reason codes to downtime automatically?
Reason codes are assigned based on patterns in the equipment data itself, such as which station triggered a stop and what fault or sensor state was active at the time, cross-referenced against a library of known downtime causes built from historical data. Unrecognized patterns get flagged for a quick manual review rather than being force-fit into an inaccurate category.
Contact support to review how reason code libraries are built for your equipment.
Can this integrate with our existing MES or historian system?
Yes, the platform is built to pull from existing data sources like a plant historian, MES, or PLC network rather than requiring a separate parallel data collection system, which keeps a single source of truth for production data across the facility. Where no existing data source is available, lightweight sensors can be added to capture the needed signals directly.
Book a session to review your current systems and integration path.
What is a Best Run Shift benchmark and how is it calculated?
A Best Run Shift benchmark uses the highest OEE the line has actually achieved under normal operating conditions as the improvement target, rather than a theoretical maximum based on equipment specifications alone. Because it's a proven, achievable number, it gives improvement teams a realistic target and a concrete comparison point for what was different about that shift.
Ask our team about how Best Run Shift benchmarking is configured for your lines.
How quickly can a line move from manual to automated OEE tracking?
Timeline depends mainly on what data is already accessible from the equipment and how much new instrumentation is needed to fill any gaps, with lines that already have PLC connectivity typically moving faster than lines needing new sensors installed. Most pilots start on one or two priority lines to validate the setup before expanding facility-wide.
Book a call to get a realistic timeline for your specific lines.
Stop Improving Against Numbers That Aren't True
iFactory automates OEE data collection, breaks loss into availability, performance, and quality, and benchmarks every shift against your line's own proven best, turning OEE from a monthly report into a live tool the floor can actually use.