Modern manufacturing floors generate failure signals constantly — a machine stops, a quality defect appears, a line falls behind pace — but the difference between a plant that recovers in four minutes and one that recovers in forty is not the frequency of those events. It is the speed and precision with which the right person receives the right signal, and takes the right action. The Andon system is the industrial mechanism that closes that gap. Originally a physical cord-pull system introduced in Toyota's production lines in the 1960s, the Andon concept has evolved into one of the most analytically sophisticated real-time alert architectures in modern lean manufacturing — combining digital stack lights, mobile push notifications, MES-integrated dashboards, and escalation logic into a production intelligence layer that sits above every workstation, every line, and every shift. In 2026, manufacturers deploying iFactory's digital Andon platform report average response-to-resolution times reduced by 58% and unplanned downtime reduced by 34% within the first operating quarter. The difference is not hardware — it is the analytics architecture behind the alert.
What a Modern Andon System Actually Does — Beyond the Stack Light
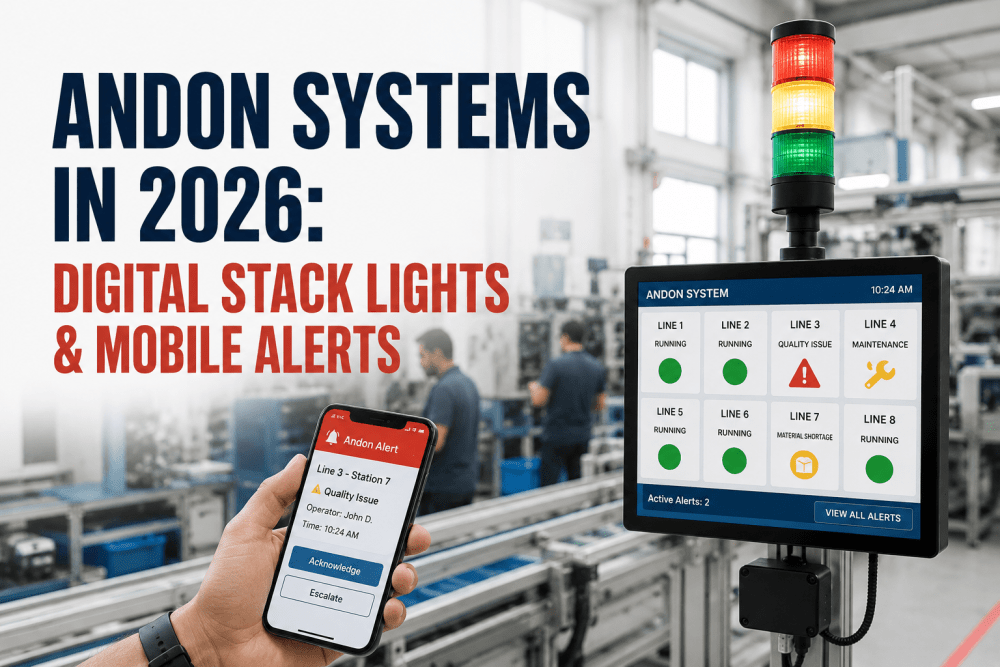
The physical stack light — red, yellow, green — remains the most visible symbol of the Andon concept, but in a 2026 smart factory deployment it represents less than 15% of the system's functional value. The core of a modern Andon architecture is the signal routing and escalation engine: the logic that determines which alert type maps to which condition, which personnel receive which notification through which channel, how long the system waits for acknowledgment before escalating, and how all of that data integrates into the OEE and shift reporting layer that makes recurring patterns visible to engineering and management.
A line stoppage in a traditional Andon deployment triggers a visual signal and waits for someone to notice. A line stoppage in a digital Andon deployment simultaneously illuminates the stack light, sends a push notification to the assigned team leader's mobile device, posts an alert to the Andon board display visible from the aisle, logs the stoppage event with timestamp and station ID in the MES, and starts a response-time clock that escalates to the supervisor if acknowledgment is not received within the configured window. The difference in mean time to respond is not incremental — it is structural.
The Four-Layer Architecture of a Digital Andon System
A production-grade Andon deployment in 2026 is not a single device or application — it is four integrated layers that each serve a distinct function in the signal-to-resolution cycle. Understanding the separation between layers is essential to configuring a system that performs at manufacturing speed rather than at IT implementation speed.
Signal Detection Layer — Inputs and Trigger Sources
The signal detection layer defines the conditions that activate an Andon alert. In a digital Andon system these inputs range from manual cord pulls and push buttons at operator workstations to automated PLC signals (machine fault codes, cycle time overruns, sensor thresholds), MES production rate deviations (actual vs. takt time), and quality gate failures from inspection stations. The configuration decision at this layer — what signals trigger what alert priority — determines the noise-to-signal ratio of the entire system. An over-configured detection layer that fires Level 1 alerts for minor pace deviations creates alert fatigue faster than it creates accountability. The correct configuration separates automated condition monitoring (machine faults, OEE deviations) from manual operator calls, assigns each category to a distinct alert tier, and filters nuisance signals with minimum-duration thresholds before escalation.
Signal Routing Layer — Escalation Logic and Notification Engine
The routing layer is where modern digital Andon systems create the most measurable operational improvement over traditional implementations. Routing logic defines the response matrix: which alert type notifies which role, through which channel (stack light, mobile push, Andon board, SMS, paging system), with what escalation timeline if the first acknowledgment is not received. A well-configured routing layer in a 50-station assembly plant typically includes three escalation tiers — operator acknowledgment within 90 seconds, team leader response within 3 minutes if unacknowledged, supervisor notification at 7 minutes — with each tier adding both recipients and urgency rather than simply repeating the original alert. The routing configuration is also where shift and role-based logic is applied: weekend shifts with reduced supervision levels require different escalation thresholds and recipient lists than weekday peak production windows.
Display and Notification Layer — Stack Lights, Boards, and Mobile
The display layer is the physical and digital interface through which the alert reaches the production floor. In a 2026 deployment this layer typically includes: digital stack lights addressable by color and pattern (not just static red/yellow/green but flash sequences and color combinations that encode additional information without additional hardware), plant-floor Andon boards that display real-time line status, station-level condition codes, and cumulative stoppage time for the current shift, and mobile applications that push station-specific alerts with context to the responsible personnel's phone or wearable. The display layer configuration determines the floor's ambient awareness of production health — the degree to which any team member walking the aisle can immediately read the status of any zone without checking a system. High-visibility Andon board placement and consistent color-code standards are as important as the software configuration in achieving sub-90-second response times.
Analytics and Integration Layer — MES, OEE, and Continuous Improvement
The analytics layer is what separates an Andon system that reduces downtime in real time from one that also reduces its frequency over time. Every alert event — trigger source, station, time, duration, assigned responder, resolution code, and response time — is logged to the MES and aggregated into the OEE reporting structure. This data accumulation enables the pattern recognition that drives continuous improvement: identifying the three stations that account for 60% of all Level 1 stoppages, discovering that a specific machine's alert frequency triples in the second hour after shift start due to thermal warm-up conditions, or quantifying the cost of a maintenance backlog item that has been generating $4,200 per week in Andon-logged downtime. Without the analytics layer, the Andon system responds to failures. With it, the system prevents them.
Continuous Improvement Feedback Loop — From Event Data to Preventive Action
The fifth element — which many implementations treat as a future-phase feature rather than a deployment requirement — is the structured feedback loop from Andon event data to engineering work orders and preventive maintenance schedules. A station that generates 12 Andon calls in a month for the same fault code is not an Andon problem — it is a maintenance or process problem that the Andon data has made measurable. Closing the loop means configuring the system to automatically generate engineering review tickets when any station exceeds a threshold alert frequency, and ensuring that the Andon event data is reviewed as a standard input in weekly production and maintenance planning meetings. Operations that close this loop reduce their total Andon event volume by 25 to 40% within two operating quarters as preventive actions address the root causes that the alert data has made visible.
Andon Alert Types and Configuration: Matching Signal Priority to Response Protocol
One of the most common configuration errors in Andon deployments is treating all alert types as equivalent. A machine fault that stops production, a quality hold that requires inspection, a material replenishment call, and a safety event each require different response speeds, different responders, and different resolution workflows. Configuring distinct alert tiers with distinct visual codes, routing rules, and escalation logic is the difference between an Andon system that the floor team trusts and uses versus one they work around.
Red Alert — Production Line Stop
A Red Andon alert indicates a condition that has stopped or will imminently stop production output at a station or line segment. Triggers include machine fault codes from PLC outputs, cycle time overrun beyond 150% of takt time sustained for two or more cycles, operator cord pull for any safety or equipment issue, and automated OEE availability loss events. Red alerts require immediate response: the routing configuration should notify the assigned team leader within 30 seconds via mobile push and stack light, with escalation to the shift supervisor at 3 minutes if not acknowledged. Every Red alert must generate a logged event record including station ID, trigger source, duration, responder, and resolution code — this is the primary data feed for downtime analysis and recurring failure identification.
Yellow Alert — Caution / Pace Warning
Yellow Andon alerts indicate a developing condition that has not yet stopped production but requires team leader attention before it does. Common triggers include cycle time trending above 120% of takt for three consecutive cycles, machine parameter approaching alarm threshold (temperature, pressure, vibration), operator assistance required without full stop, and production count falling below scheduled pace by more than 8% at the mid-shift checkpoint. Yellow alerts use a different routing profile than Red: they notify the team leader through the Andon board and mobile alert but do not require immediate response acknowledgment — they require a status update within 5 minutes and resolution logging within 15 minutes. Yellow alert volume trending upward at a station over two or more shifts is a leading indicator of an impending Red alert event, and the analytics layer should flag this pattern automatically for engineering review.
| Trigger Condition | Threshold | Response Window | Escalation Rule |
|---|---|---|---|
| Cycle time vs. takt | >120% for 3 cycles | 5 minutes | Red at 130% sustained 5 cycles |
| Pace vs. schedule | >8% behind at midshift | 10 minutes | Supervisor alert at 15% behind |
| Machine parameter | 80% of alarm threshold | 7 minutes | Red on threshold breach |
| Operator assist request | Manual yellow call | 3 minutes | Red at 7 min if unacknowledged |
| Preventive maintenance due | Within next 2 hours | Next break period | Work order auto-generated |
Blue Alert — Material Replenishment Call
Blue Andon alerts are material system calls — they signal that a workstation or line segment is approaching a component, consumable, or raw material shortage that will cause a stoppage if not replenished before the current stock is consumed. The key configuration discipline for Blue alerts is lead time calibration: the alert should fire at the point where there is sufficient remaining material to allow a material handler to complete a standard replenishment cycle before the station runs dry — typically 15 to 25 minutes of remaining supply depending on consumption rate and material handler travel distance. Blue alerts route to the material handling team rather than production supervision, and their resolution time target is set to the material handler's standard replenishment cycle time. A Blue alert that converts to a Red alert because material was not replenished before depletion is a routing or threshold configuration failure, not a floor execution failure.
White Alert — Quality Hold
White Andon alerts signal a quality condition — a defect detected at an in-line inspection point, a first-article check failure, a specification deviation flagged by an operator, or an automated vision system reject that requires quality engineering review before production continues. White alerts have a fundamentally different workflow from production stoppage alerts: they do not necessarily stop the line (production can often continue into a hold buffer while the quality review is in progress), they route to quality engineering rather than production supervision, and their resolution workflow involves a disposition decision (accept, rework, scrap, or contain) that must be logged with the responsible quality engineer's name and timestamp. White alert data integrated with the quality management system provides the traceability record for customer and regulatory audit requirements.
Andon System vs. Traditional Production Monitoring: A Functional Comparison
The business case for upgrading from a traditional stack-light Andon or paper-based stoppage logging system to a digital Andon platform is most clearly made through a side-by-side functional comparison of what each architecture can and cannot deliver across the dimensions that matter most in a lean manufacturing environment.
| Capability | Traditional Stack Light | Basic Digital Andon | iFactory Digital Andon + MES |
|---|---|---|---|
| Alert visibility range | Line of sight only | Floor board + local display | Floor board + mobile + remote dashboard |
| Notification delivery | Visual/audible only | Display + basic mobile | Push, SMS, paging, escalation tiers |
| Escalation logic | None | Single-tier fixed | Multi-tier, role-based, shift-aware |
| Event logging | Manual paper log | Basic timestamp log | Full MES integration with fault codes |
| OEE impact calculation | Manual calculation | Basic availability tracking | Real-time OEE with Andon contribution breakdown |
| Root cause tracking | None | Manual code entry | Structured resolution codes + trend analytics |
| Recurring failure detection | Manual review required | Limited export capability | Automated frequency alerting + engineering tickets |
| Shift performance reporting | Supervisor manual summary | Basic shift log | Automated shift report with Andon event breakdown |
| Remote access for management | None | Web dashboard (limited) | Full real-time dashboard on any device |
MES Integration: Why Andon Data Alone Is Not Enough
An Andon system that operates as a standalone alert tool — disconnected from the MES, production scheduling, and quality management systems — captures response-time data but misses the operational intelligence value that makes modern Andon deployments transformative. MES integration is the coupling that converts alert event data into production cost visibility, maintenance priority intelligence, and continuous improvement evidence.
The practical integration architecture connects the Andon event stream to four MES data domains: the production order record (which shift, which product, which line segment was affected), the equipment asset record (which asset generated the fault, what its maintenance history shows), the quality record (for White alerts, which lots or serials are in the hold status), and the labor record (which team leader acknowledged, what resolution code was entered, how long the response took). With these four data connections active, the Andon system becomes a production intelligence tool rather than a notification device — and the shift report that management reviews each morning contains not just "we had 14 stoppages" but "we had 14 stoppages costing $47,200 in production output, 9 of which were from three repeat failure modes that have active engineering tickets."
Expert Review: What High-Performing U.S. Plants Do Differently with Andon
Plants achieving top-quartile OEE performance in U.S. discrete manufacturing — above 82% overall, with availability consistently above 90% — share three Andon system practices that distinguish them from median performers. First, they treat Andon response time as a managed KPI, not a system feature. Mean time to acknowledge is reported daily, trended weekly, and reviewed in every team leader performance conversation. When response time degrades — often the first indicator of floor team engagement problems — it is addressed directly rather than attributed to system issues. Second, their Andon systems are configured to distinguish between first-event alerts and repeat-event alerts. A station generating its third Red alert for the same fault code in a single shift does not just notify the team leader — it notifies the maintenance supervisor and automatically logs an engineering review ticket. The distinction between a novel failure and a recurring failure requires a different response level, and the highest-performing plants have automated that distinction so it never depends on someone remembering to escalate. Third, they review their Andon configuration quarterly. Alert thresholds, routing rules, and escalation logic set at deployment gradually drift from operational reality as products, line configurations, and staffing levels change. Quarterly configuration reviews — comparing alert volume, response times, and false positive rates against deployment baselines — are the maintenance practice for the Andon system itself.
— Industry Benchmark Review, U.S. Discrete Manufacturing Andon Deployments, iFactory Analytics Reference 2026Conclusion
The Andon system in 2026 is not a floor notification tool that happens to produce some data. It is the real-time operational intelligence layer of the lean factory floor — the mechanism through which every production deviation, every equipment fault, and every material shortage becomes a managed event with a measured response time, a documented resolution, and a data record that feeds the continuous improvement programs that prevent the same event from recurring next week.
The operational gap between a plant running at 74% OEE and one running at 86% is rarely a technology gap. It is a signal-to-action gap: how consistently and how quickly the conditions that reduce output are detected, communicated, resolved, and prevented. A properly deployed digital Andon system — with structured alert tiers, mobile escalation, MES integration, and a closed-loop improvement protocol — closes that gap systematically. The plants that have deployed these systems at AIST and SME best-practice standards do not just have faster response times. They have fewer things to respond to.
Frequently Asked Questions
A traditional Andon cord-pull system uses a physical cord or button at the workstation to trigger a local stack light and audible alert, with no automated notification routing, event logging, or data integration. The alert reaches only those physically within visual or audible range of the signal. A digital Andon system replaces or supplements the physical trigger with a multi-channel notification architecture: the same operator call simultaneously activates the stack light, pushes a mobile notification to the specific responder on duty, posts to the floor Andon board, and logs a timestamped event record in the MES. The primary operational difference is not the trigger mechanism — it is the routing precision (the right person receives the alert regardless of their physical location on the floor), the escalation logic (the system follows up if acknowledgment is not received within the configured window), and the data output (every alert event contributes to OEE calculations, shift reports, and continuous improvement analytics). A digital system does not replace the physical display layer — it extends it with the mobile and data integration layers that the original cord-pull concept could not provide.
The most effective threshold configuration practice is the minimum-duration filter: rather than firing an alert the instant a condition is detected, the system waits for the condition to persist for a configured minimum duration before escalating. For cycle time overrun alerts, the standard practice is to require the overrun condition to be present for two or three consecutive cycles before triggering a Yellow alert — this filters out single-cycle variation from operator assist, material adjustment, or minor setup issues that self-resolve without intervention. For machine parameter alerts (temperature, pressure, vibration), a 30 to 90-second sustain threshold at the configured level eliminates the transient spikes that are normal in dynamic production environments. False positive rates above 15% of total alert volume are a strong indicator of threshold misconfiguration — they erode floor team trust in the system and are the primary driver of Andon bypass behavior where operators stop calling alerts because they expect them to resolve before anyone responds. Quarterly threshold reviews comparing false positive rates against baseline are the standard maintenance practice for well-managed Andon deployments.
A production-grade Andon-MES integration requires four data exchange connections. First, the production order integration: the Andon event log must be linked to the active production order and shift record so that stoppage time is attributed to the correct product, line, and shift in the OEE calculation. Second, the equipment asset integration: Red alert events should write to the asset's maintenance event history in the CMMS, linking fault codes to the equipment record for maintenance frequency trending and work order generation. Third, the scheduling impact integration: stoppage duration should be reflected in real-time production count vs. schedule tracking so that the schedule recovery requirement (overtime, pace increase, or schedule revision) is visible to production planning during the shift rather than discovered at shift end. Fourth, the quality management integration: White alert quality hold events should create holds in the quality record linked to the lot or serial numbers of parts in the affected buffer. The integration depth required varies by operation size — a 20-station assembly line may require only the first and third connections to achieve significant ROI, while a multi-product machining center serving regulated industries needs all four for full compliance and cost visibility.
Andon response time is measured as the elapsed time between alert trigger (the moment the Andon event is initiated, whether by operator call or automated condition) and first acknowledgment (the moment the assigned responder accepts the alert in the mobile application or enters a response at the Andon board kiosk). This is distinct from resolution time, which is measured from trigger to the moment the alert is closed with a resolution code. The industry benchmark for first-acknowledgment response time in a well-configured digital Andon deployment with mobile routing is under 90 seconds for Red alerts and under 5 minutes for Yellow alerts. Operations achieving these benchmarks consistently report 4 to 6 minute mean stoppage durations for Red alerts — compared to 18 to 30 minutes in operations without structured mobile escalation. The practical path to achieving these benchmarks is: configure mobile routing before deployment (not as a post-launch addition), establish acknowledgment time as a tracked KPI in the first week of operation, review daily until the team develops the response habit, and use the 30-day response time trend to identify structural gaps (insufficient supervisor coverage during specific shifts, routing misconfiguration for specific zones) rather than treating slow response as a people problem.
For a mid-size U.S. discrete manufacturer with 30 to 100 monitored stations across one or two production lines, iFactory's digital Andon platform deployment runs $45,000 to $120,000 in total platform and implementation cost over a 4 to 6 week deployment timeline — including hardware (stack lights, push buttons, network infrastructure if not already present), software licensing, MES integration, and operator and team leader training. The fastest ROI typically comes from three value streams in the first operating quarter. Response time improvement alone — reducing mean Red alert response from 22 minutes to under 4 minutes — typically saves 15 to 35 hours of unplanned downtime per month at a production cost of $12,000 to $18,000 per hour, generating $180,000 to $630,000 per month in recovered production capacity. Recurring failure identification — where the Andon event data surfaces the three to five fault codes that account for 60% of all stoppages — typically drives engineering corrective actions worth $80,000 to $250,000 per year in downtime reduction. Combined, these two value streams consistently produce full platform cost recovery within the first operating quarter for operations with more than 5 significant unplanned stoppages per month before deployment.