Autonomous SPC for glass laminating enables quality leaders to reduce cycle time by 10–20% without compromising product quality by replacing manual control chart interpretation with self-tuning AI that continuously monitors process behavior, applies Western Electric rules automatically, and optimizes control limits in real time. Traditional SPC demands that quality engineers manually review charts, interpret run rules, and recalculate limits — consuming hours each shift that could be spent on process improvement. Autonomous SPC eliminates this latency by embedding statistical process control directly into the manufacturing workflow, detecting special-cause variation the moment it occurs and triggering corrective action without human intervention. For quality leaders managing multiple laminating lines, this means faster production cycles, fewer quality hold-ups, and consistent process capability across every shift. Quality managers evaluating autonomous quality platforms Book a Demo to see autonomous SPC deployed in glass laminating environments.
How Manual SPC Creates Hidden Cycle Time Waste in Glass Laminating
Quality leaders know that manual SPC processes introduce systemic delays that extend laminating cycle time. Each hour spent reviewing control charts, investigating false alarms, recalculating limits, and documenting findings is an hour that finished product sits in quality hold. The table below maps the hidden waste points in traditional SPC and how autonomous SPC eliminates them. Quality leaders assessing their workflow efficiency Book a Demo to see a cycle time audit of their current SPC operations.
| Waste Point | Impact on Cycle Time | Autonomous SPC Solution |
|---|---|---|
| Manual Chart Review | Quality engineers spend 2–4 hours per shift reviewing X-bar and R charts across multiple laminating lines, delaying release decisions | AI continuously monitors all charts simultaneously, flagging only exceptions requiring human review |
| False Alarm Investigation | 30–40% of flagged out-of-control points are false alarms requiring investigation that stops production flow | Self-tuning limits reduce false alarm rate to 3–5% by distinguishing common-cause from special-cause variation |
| Limit Recalculation | Manual recalculation of control limits after each process parameter change takes 30–60 minutes per line | Limits recalculate automatically every 30 seconds using real-time process data |
| Western Electric Rule Execution | Applying Western Electric run rules manually across multiple parameters is slow, error-prone, and often missed | All eight Western Electric rules executed automatically with instant alert generation |
| Quality Hold Release | Product sits in hold for 4–8 hours awaiting quality engineer review and sign-off | Automated release decisions trigger when autonomous SPC confirms process stability within adaptive limits |
Core Capabilities of Autonomous SPC for Laminating Quality Leaders
Autonomous SPC platforms deliver four interconnected capabilities that collectively eliminate manual quality workflow bottlenecks. Each capability addresses a specific time-waste point and contributes directly to cycle time reduction. Quality leaders evaluating platform capabilities Book a Demo to see these modules configured for laminating process parameters.
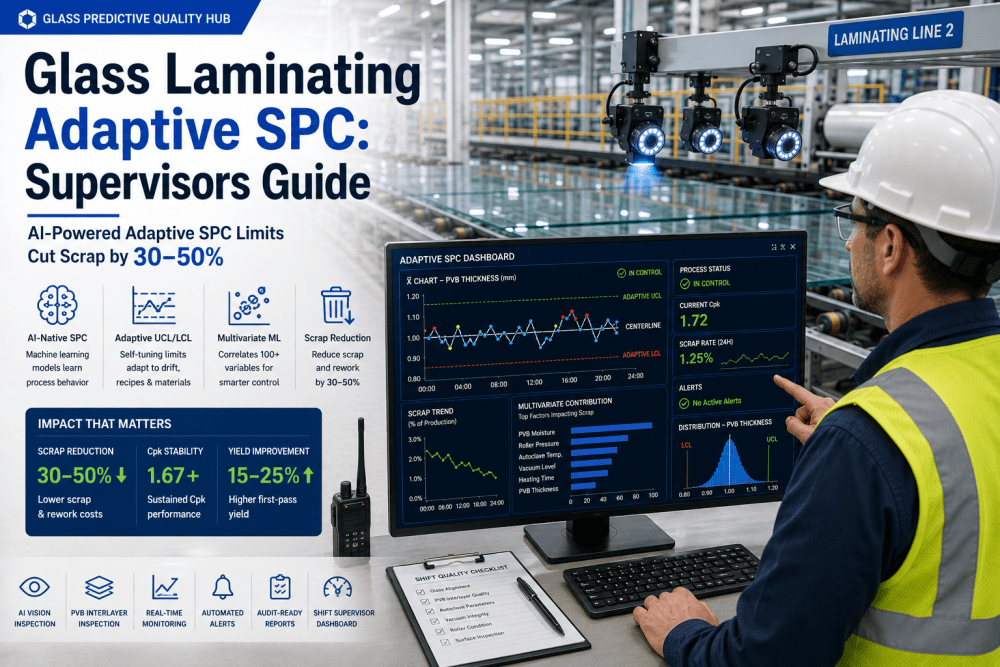
Self-Tuning Control Charts automatically adjust UCL and LCL thresholds based on rolling process data, material lot characteristics, and ambient conditions. The system recalculates limits every 30 seconds using a multivariate model trained on 24 months of laminating production data. When a new PVB interlayer lot enters production, limits adjust to that material's inherent variability profile — eliminating false alarms while maintaining sensitivity to genuine process shifts. This eliminates the manual limit recalculation cycle entirely and ensures control limits always reflect current process reality.
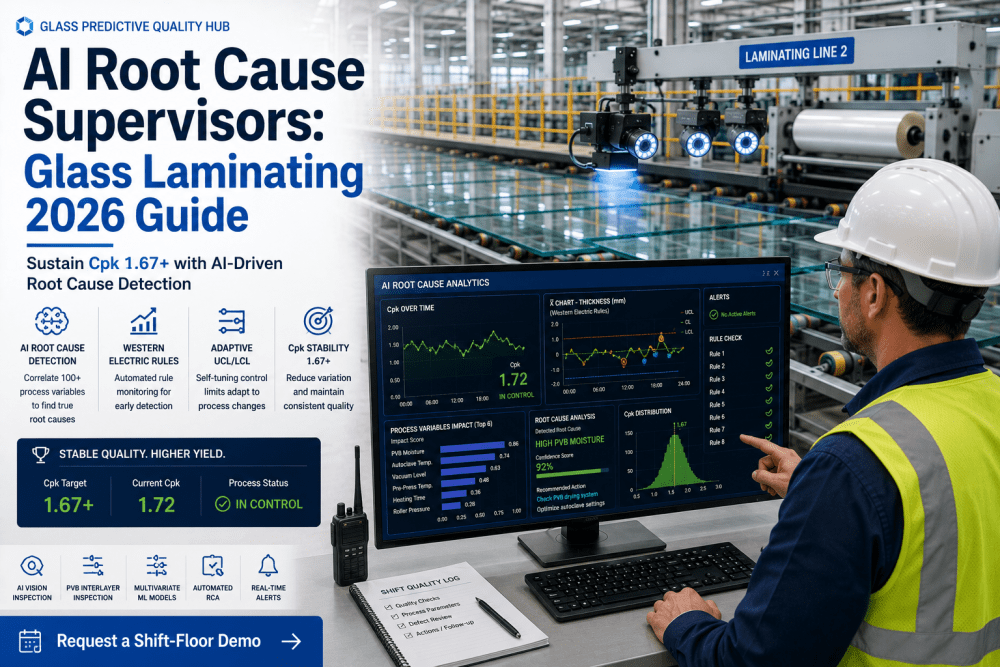
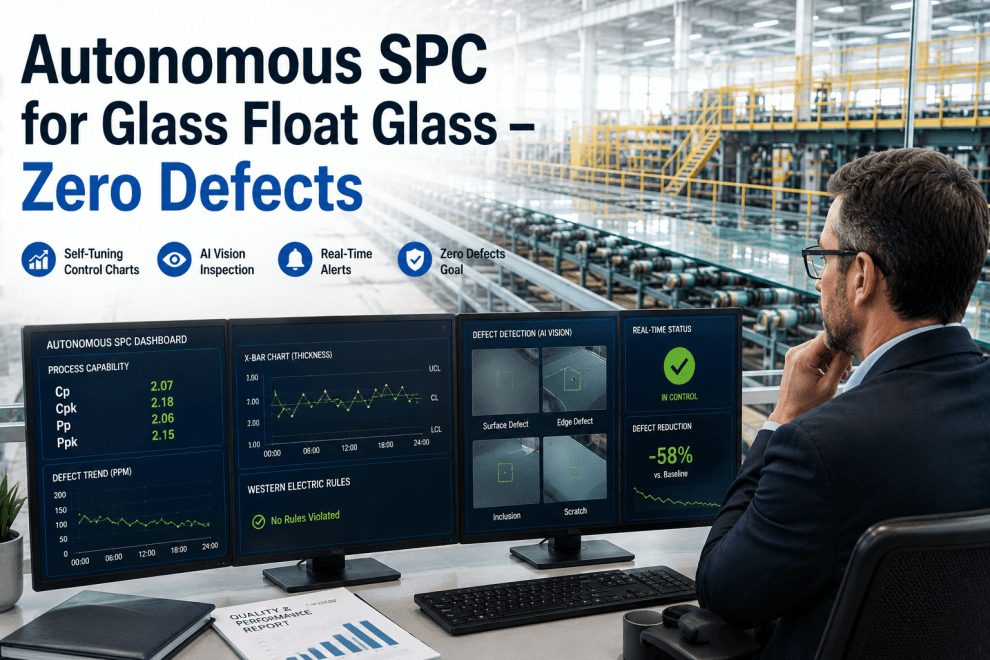
Automated Western Electric Rule Engine executes all eight standard run rules across every monitored parameter in real time. Rules include points beyond control limits, consecutive points on one side of the center line, trends of six or more points, alternating patterns, and zone-based violations. Each rule violation triggers a severity-graded alert with the specific parameter, rule broken, deviation magnitude, and recommended corrective action. No manual chart interpretation required — the autonomous engine processes thousands of data points per minute across every laminating line simultaneously.
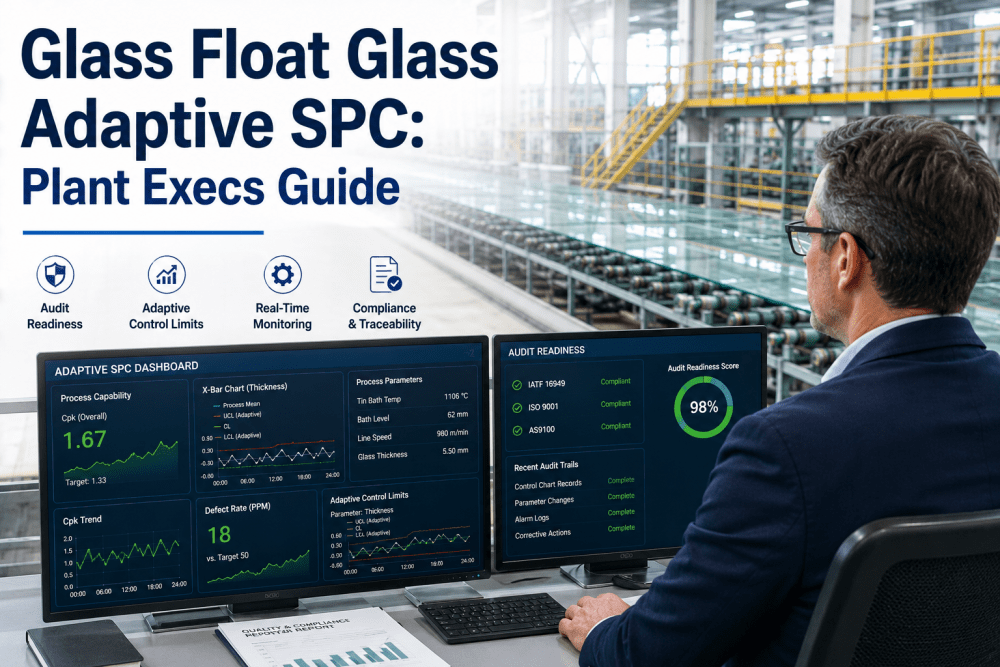
Continuous Cpk Monitoring tracks process capability in real time for every parameter combination. The platform calculates Cpk for pre-press temperature and pressure, autoclave zone gradients, ramp rates, cool-down profiles, and bond quality metrics — updating with each new production cycle. Trends in Cpk are tracked to identify gradual degradation before it produces non-conforming output. Quality leaders receive weekly Cpk reports with parameter-specific trends, recommended limit adjustments, and comparison against target capability thresholds.
Context-Aware Smart Alerts distinguish between common-cause variation requiring no action and special-cause events demanding immediate investigation. Alerts are color-coded by severity and delivered to quality leader dashboards, mobile devices, and CMMS workflows. Each alert includes the breached parameter, current reading versus dynamic limit, relevant run rule, and a root cause hypothesis generated from correlation analysis with material, equipment, and environmental data. Escalation rules ensure the right stakeholder is notified based on alert severity.
Autonomous SPC vs. Traditional SPC — Cycle Time Impact Comparison
The measurable difference between autonomous and traditional SPC extends beyond quality metrics into operations performance. Cycle time reduction is driven by eliminating manual touch points, reducing false alarm investigations, and automating release decisions. Quality leaders planning their automation roadmap will find these comparison points directly applicable to their laminating operations.
| Operations Metric | Traditional SPC | Autonomous SPC |
|---|---|---|
| Avg. Chart Review Time per Shift | 3.2 hours across 4 laminating lines | 0.4 hours — exception-based review only |
| Quality Hold Duration | 5.8 hours average from detection to release | 1.2 hours — automated release on stability confirmation |
| False Alarm Investigation Time | 45 min per false alarm, 3–5 per shift | 10 min per event, automated context provided |
| Limit Recalculation Frequency | Quarterly manual recalculation, 2 hours per session | Continuous — limits updated every 30 seconds autonomously |
| Rule Violation Detection | End-of-shift chart review — 4–8 hour detection lag | Real-time — detected within 30 seconds of occurrence |
| Weekly Quality Meeting Prep | 3 hours compiling charts, limit revisions, Cpk reports | 30 minutes — system generates weekly quality summary |
Deployment Roadmap for Autonomous SPC
Deploying autonomous SPC follows a phased methodology designed to deliver early cycle time wins while building toward full autonomous operation across all laminating lines. Quality leaders manage the deployment timeline and process owners execute each phase with iFactory platform support.
Expert Perspective — Autonomous SPC Impact on Quality Operations
We implemented autonomous SPC across our architectural laminating facility approximately six months ago. The most immediate impact was on our quality hold release cycle — what used to take a full shift of chart review and sign-off now takes under two hours. Our quality engineers stopped spending their days interpreting control charts and started working on process improvement projects that had been backlogged for months. The self-tuning limits eliminated the friction between shifts where different engineers had different interpretations of the same Western Electric rules. For quality leaders considering this transition, autonomous SPC does not replace quality expertise — it removes the administrative burden so your team can focus on the work that actually improves the process.
— Quality Manager, Architectural Glass Laminating — 8-Line Facility, AS9100 and ISO 9001 AccreditedConclusion
Autonomous SPC transforms how quality leaders manage process control in glass laminating by eliminating the manual workflow bottlenecks that extend cycle time. Self-tuning control charts replace static limits with dynamic thresholds that reflect current process conditions. Automated Western Electric rule execution eliminates chart interpretation delays. Continuous Cpk monitoring provides real-time visibility into process capability without manual calculation.
Frequently Asked Questions
Traditional automated SPC software still requires human configuration of control limits, manual rule setup, and periodic recalculation. Autonomous SPC handles all of these functions independently — limits self-tune, rules execute automatically, and thresholds adjust to process changes without quality engineer intervention. The system makes decisions about what constitutes normal variation versus special-cause events using machine learning models trained on facility-specific data.
All critical laminating parameters benefit, but the highest cycle time impact comes from pre-press nip roll temperature and pressure, autoclave temperature gradient across heating zones, pressure ramp rate during autoclave cycles, PVB moisture content at layup, and final bond quality metrics. These parameters have the highest false alarm rates under manual SPC and the greatest potential for autonomous rule execution to accelerate release decisions.
iFactory autonomous SPC connects to existing MES, CMMS, and QMS platforms through REST APIs and database connectors. Control chart data, rule violation records, and Cpk reports are automatically written to the quality system audit trail. No manual data entry or duplicate record keeping is required. The platform generates AS9100 and ISO 9001 compliant documentation for every autonomous SPC event.
Most facilities see measurable cycle time reduction within 4–6 weeks of deployment. Initial gains come from eliminating end-of-shift chart review delays and reducing quality hold duration. Sustained cycle time improvement of 10–20% is typically achieved within 90 days as the autonomous rule engine reaches full coverage across all monitored parameters and the quality team transitions to exception-based review workflows.
Autonomous SPC complements existing quality procedures rather than replacing them. Work instructions are updated to reflect the transition from manual chart review to exception-based monitoring. Quality leaders retain full visibility into control chart data and can override autonomous decisions. The system generates documentation that satisfies audit requirements for statistical process control methodology. iFactory provides procedure templates and change management support during deployment.