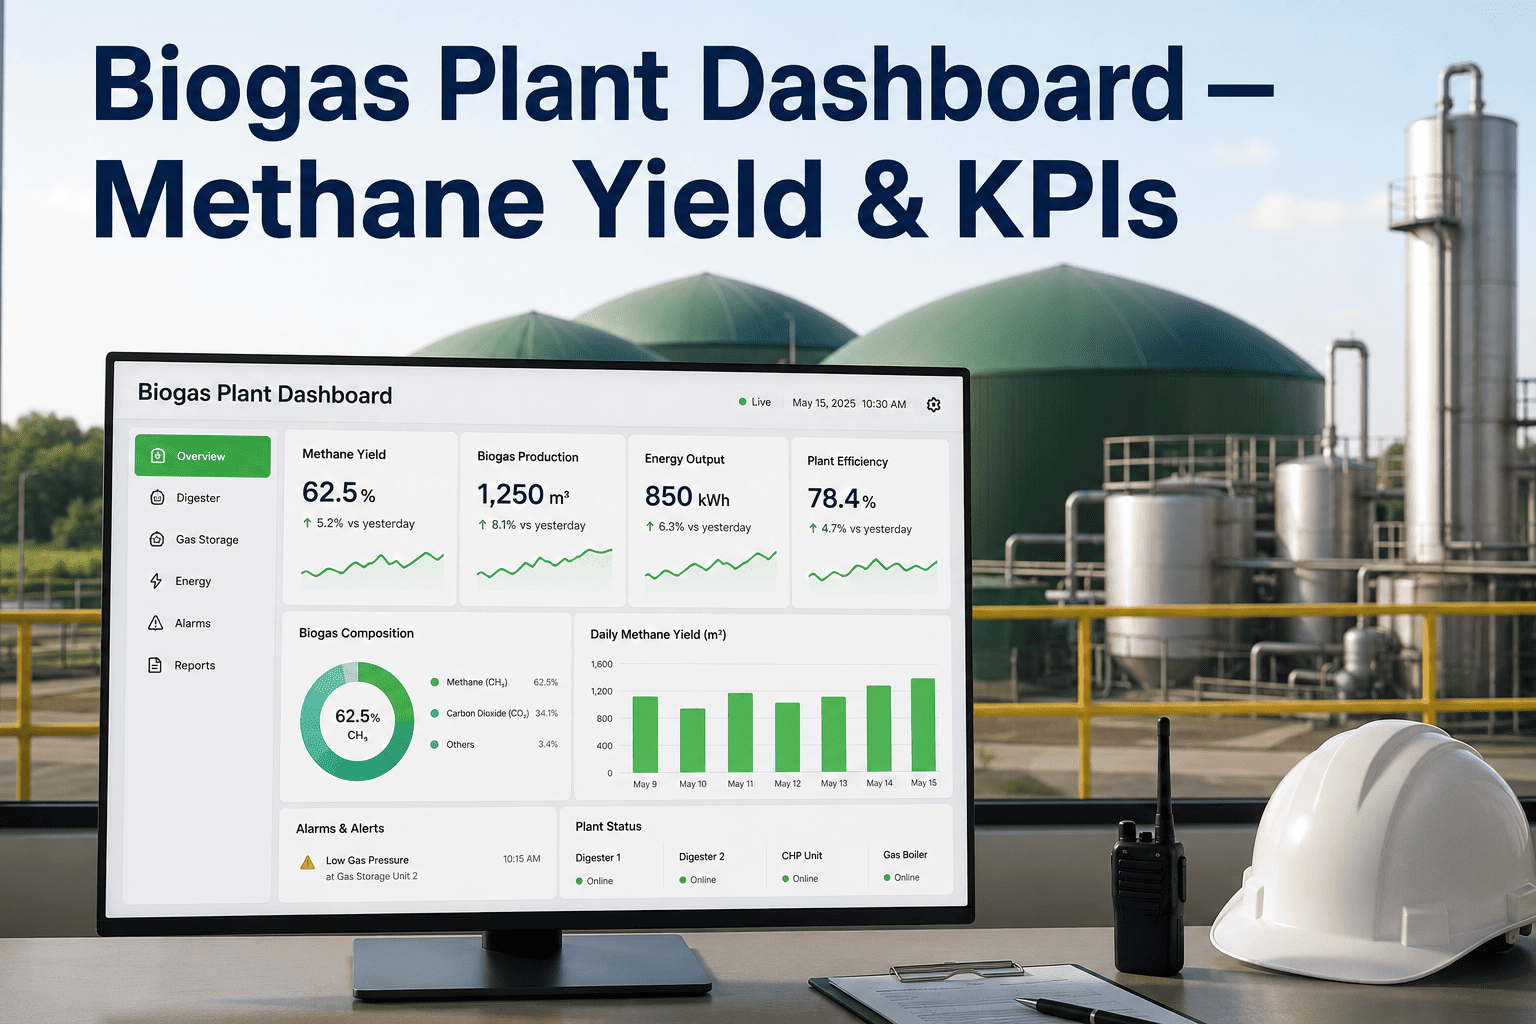
An anaerobic digester runs on biology, and biology does not forgive a missed reading. A pH drift of half a point, a volatile fatty acid spike that goes unnoticed for two days, or an organic loading rate pushed past what the microbial population can process — any one of these can tip a stable digester into a souring process that takes weeks to recover from. Most biogas plants still monitor these parameters through daily grab samples and lab turnaround times measured in hours, which means the operator often finds out about a process upset after it has already started, not before. A real-time biogas performance dashboard changes the timeline entirely, and plant operators can book a demo to see how early warning works on an actual digester profile.
The Digestion Cycle Never Stops — Your Monitoring Shouldn't Either
Anaerobic digestion runs as a continuous biological cycle, but most monitoring programs check in on it as a series of disconnected snapshots. A biogas plant dashboard built around continuous sensing follows the same cycle the digester runs on, closing the gap between what the biology is doing and what the operator can see. The wheel below shows the four stages every digester cycles through and the KPI that matters most at each one.
Organic loading rate and hydraulic retention time set the pace the microbial population can sustain.
VFA production begins here — early spikes are the clearest leading indicator of an approaching upset.
Methane yield and biogas composition (CH4/CO2 ratio) reflect the health of the methane-producing population.
pH and alkalinity trending back to baseline confirm the digester has absorbed the loading without souring.
FOS/TAC: The Ratio That Predicts Trouble Before pH Does
By the time pH visibly drops in a digester, the process is often already in trouble — pH is a lagging indicator because anaerobic systems are naturally buffered against small changes. The FOS/TAC ratio, which compares volatile fatty acids to total alkalinity, moves days ahead of pH and is the single most reliable early warning metric available to biogas operators. AI-based dashboards calculate this ratio continuously from inline sensor data rather than the once- or twice-weekly lab sample most plants rely on today.
| FOS/TAC Ratio | Process Status | Recommended Action | Lead Time vs. pH Drop |
|---|---|---|---|
| 0.2–0.3 | Stable | Continue normal loading | N/A |
| 0.3–0.4 | Watch | Hold loading rate steady | 5–7 days |
| 0.4–0.6 | Elevated | Reduce organic loading rate | 2–4 days |
| 0.6+ | High Risk | Stop feed, add alkalinity buffer | 0–2 days |
Building a KPI Dashboard That Operators Actually Use
A biogas plant efficiency dashboard is only useful if it surfaces the right four or five numbers instead of a hundred data points nobody has time to interpret during a shift. iFactory's approach starts with the metrics that predict problems, not just the ones that report them after the fact. Book a demo to see the dashboard configured around your digester's specific feedstock profile.
Biogas volume per unit of volatile solids fed — the clearest measure of digester efficiency over time.
Even small temperature swings outside the mesophilic or thermophilic band slow microbial activity measurably.
Continuous CH4/CO2 tracking reveals process trends invisible in daily totals alone.
Level trending against feed schedule confirms retention time assumptions are holding in practice.
Organic Loading Rate and Hydraulic Retention Time — Getting the Balance Right
Organic loading rate and hydraulic retention time are two sides of the same balance: push too much feed in too fast relative to retention time, and the microbial population cannot keep pace, leading to VFA accumulation and eventual souring. Pull back too far, and the digester underperforms relative to its capacity, leaving methane yield on the table. Most plants set these parameters once during commissioning and rarely revisit them dynamically, even as feedstock composition changes seasonally. AI-based process monitoring recalculates the safe loading envelope continuously as feedstock and digester health data update, allowing operators to push closer to maximum sustainable throughput without crossing into upset territory.
Frequently Asked Questions: Biogas Plant Monitoring and Process Stability
What is the FOS/TAC ratio and why is it more useful than pH monitoring alone?
FOS/TAC compares volatile fatty acids to total alkalinity and moves days ahead of visible pH change, making it the earliest reliable indicator of an approaching digester upset. Book a demo to see this ratio tracked continuously on a live dashboard.
How much can a real-time dashboard improve methane yield?
Plants that move from periodic lab sampling to continuous monitoring typically see a 15–25% improvement in methane yield, largely from operating closer to maximum sustainable loading rate without triggering process upsets.
Can AI-based monitoring predict a digester upset before it happens?
Yes — by tracking FOS/TAC trend direction, temperature stability and loading rate together, predictive models can flag a developing upset roughly 48 hours before it becomes visible through pH alone, giving operators time to intervene.
What sensors are needed to build a continuous biogas KPI dashboard?
A functional dashboard typically needs inline pH, temperature, gas flow and composition sensors, along with periodic VFA/alkalinity sampling that can be calibrated against continuous proxies. Most existing digesters already have a portion of this instrumentation installed.
How does hydraulic retention time affect organic loading rate decisions?
Retention time determines how long feedstock remains available to the microbial population before it exits the digester, so any increase in loading rate needs a corresponding retention time check to avoid overwhelming the biology. Talk to support to review your digester's current loading and retention profile.