Condition-based maintenance (CBM) is not a philosophy — it is a discipline. In U.S. manufacturing facilities, the shift from calendar-driven maintenance schedules to condition-driven intervention represents the single largest lever available for reducing unplanned downtime, controlling maintenance spend, and extending asset life. The principle is straightforward: maintain equipment when the data says it needs maintenance, not when the calendar says it does. Executing that principle reliably — across dozens of rotating assets, multiple production lines, and 24/7 operations — requires a structured implementation roadmap, the right sensor infrastructure, a condition monitoring platform capable of translating raw signals into maintenance decisions, and a CMMS integration that turns those decisions into scheduled work orders without human interpretation delay. This guide documents that roadmap, stage by stage, for manufacturing maintenance and reliability professionals ready to move beyond reactive and scheduled-interval approaches to a genuine condition-based operating model.
Book a demo to see iFactory's CBM platform in actionWhat Condition-Based Maintenance Actually Means — and What It Does Not
Condition-based maintenance is the practice of performing maintenance actions on an asset based on its measured operational condition rather than on elapsed time or fixed usage intervals. The distinction from preventive maintenance is not semantic — it is structural. A preventive maintenance program says: replace this bearing every 6,000 operating hours. A condition-based maintenance program says: replace this bearing when its vibration spectrum indicates that spalling has initiated and the wear progression curve projects failure within the next 14 to 21 days. The first approach replaces bearings that have 3,000 hours of remaining useful life and misses bearings that fail at hour 4,200 due to a lubrication anomaly. The second approach replaces bearings at the optimal point — late enough to extract maximum useful life, early enough to plan the intervention and avoid emergency costs.
CBM is also frequently conflated with predictive maintenance. The distinction is meaningful. Condition-based maintenance encompasses the full range of data-driven maintenance decisions — from simple threshold-triggered alerts (replace when vibration exceeds X) to advanced AI-driven fault progression models that estimate remaining useful life within a confidence interval. Predictive maintenance is the highest-maturity tier of CBM, where machine learning models interpret multi-variable condition signals to generate probabilistic failure forecasts. The roadmap below covers the full CBM maturity progression, from foundational sensor deployment through AI-driven prediction, so organizations can identify their current position and the specific steps required to advance.
Reactive
No condition monitoring. Maintenance triggered by failure or operator observation. Emergency repair costs dominate the maintenance budget.
Preventive
Scheduled interval maintenance. Reduces catastrophic failures but generates early replacements and misses interval-independent faults.
Threshold-Based CBM
Fixed-threshold sensor alarms. Detects gross anomalies 24–72 hours before failure. Significant false positive rate. Limited fault classification.
Advanced CBM
Multi-variable condition monitoring with baseline trending. 7–14 day detection windows. Fault classification by type. Manual analysis still required for interpretation.
AI Predictive CBM
Machine learning fault progression models. 14–28 day detection windows. Automated fault classification, RUL estimation, and CMMS work order generation. Less than 3% false positive rate.
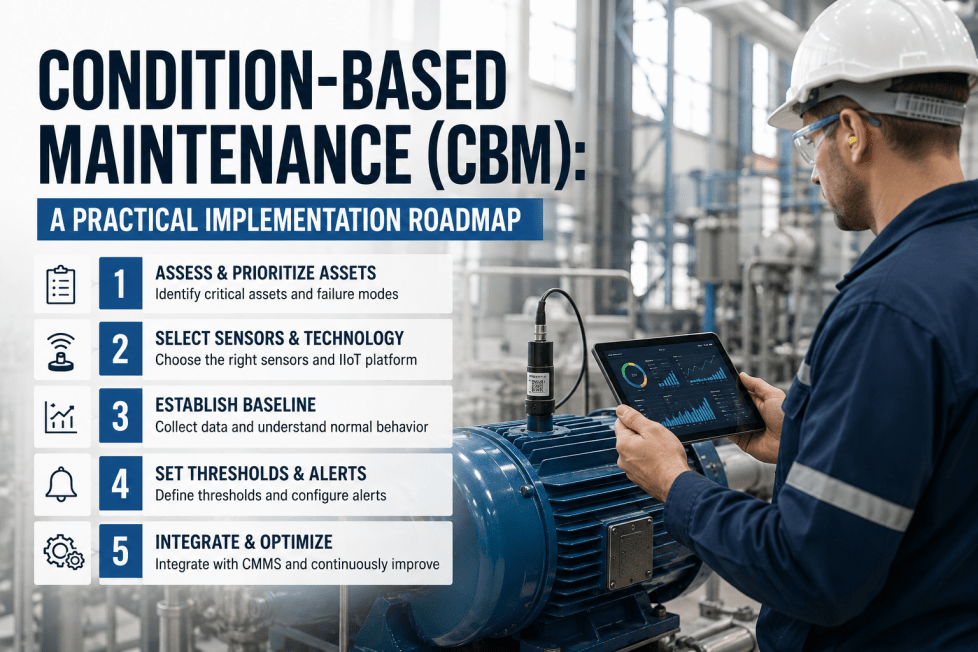
The CBM Implementation Roadmap: Six Stages from Asset Selection to Full Deployment
CBM programs that fail — and a substantial number of industrial CBM initiatives deliver less than 30% of their projected ROI — share a common failure pattern: they deploy sensor hardware before establishing the asset criticality framework, monitoring strategy, and data interpretation infrastructure that gives sensor data meaning. The roadmap below is structured to prevent that failure mode by sequencing implementation correctly: strategy and asset prioritization first, sensor deployment second, monitoring platform third, and continuous improvement last.
Asset Criticality Assessment
Rank all assets by failure consequence (production impact, safety risk, replacement cost, lead time). Prioritize the top 15–20% by criticality score for CBM instrumentation. This step determines ROI from the entire program — monitoring low-criticality assets first generates data without proportional value.
Failure Mode and Sensor Selection
For each priority asset, document the primary failure modes (bearing wear, gear mesh degradation, winding insulation breakdown, imbalance, misalignment) and identify the optimal sensor modality for each failure mode. Vibration for mechanical faults, current signature analysis for electrical and rotor faults, infrared thermal for winding and bearing thermal anomalies, ultrasound for early-stage bearing surface fatigue and lubrication deficiency.
Sensor Deployment and Baseline Establishment
Install sensors per the failure mode map. Commission data acquisition hardware and verify signal quality at each monitoring point. Run a 4–8 week baseline period at normal operating conditions to establish the healthy operating signature for each asset — the condition fingerprint against which anomalies are detected. Baseline quality determines detection accuracy for the entire program life.
Condition Monitoring Platform Integration
Connect sensor data streams to the condition monitoring platform — edge compute for real-time local inference, cloud dashboard for fleet-level visibility. Configure fault detection models, alert thresholds, and escalation rules. Integrate with the plant historian for process context variables (load, speed, feed rate) that condition the AI's fault classification logic.
CMMS Integration and Work Order Automation
Connect the condition monitoring platform to the CMMS (SAP PM, IBM Maximo, or equivalent). Configure automated work order generation rules: fault type → work scope template → required parts → priority level → assigned crew. Eliminate the manual alert-to-work-order translation step that introduces 4–24 hours of delay between fault detection and maintenance scheduling in programs without this integration.
Continuous Improvement and Asset Expansion
Review fault detection outcomes monthly — confirmed detections, false positives, missed detections. Tune model thresholds and add confirmed fault events as training data to improve AI accuracy. Expand CBM instrumentation to the next tier of assets by criticality score. Target: reduce unplanned maintenance share below 10% of total maintenance events within 18 months of program initiation.
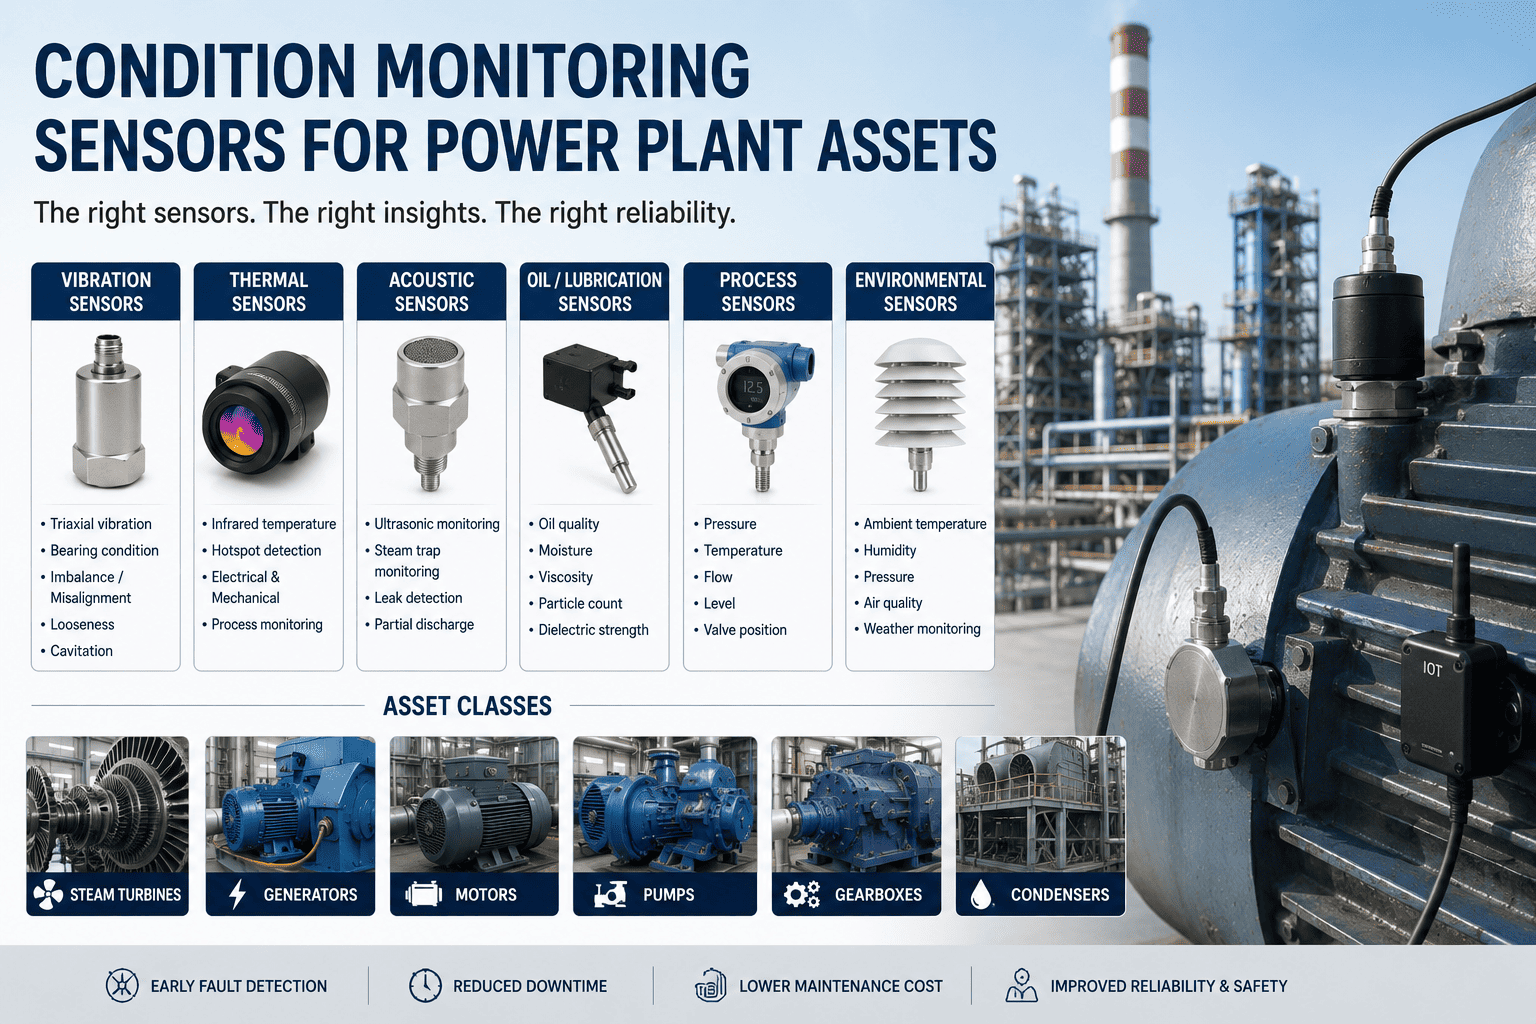
CBM Sensor Technology: Matching Sensor Modality to Failure Mode
The most consequential technical decision in a CBM program is sensor selection — matching the right sensor modality to the specific failure mode it is intended to detect. A vibration accelerometer placed at the wrong location on a bearing housing cannot detect early-stage gear mesh anomalies. A current transformer monitoring a motor cannot detect a developing coupling misalignment that has not yet loaded the motor current asymmetrically. The following table documents the primary sensor modalities used in industrial CBM programs, their optimal application domains, and the fault detection windows achievable at each maturity level.
| Sensor Modality | Primary Fault Modes Detected | Threshold-Based Detection Window | AI CBM Detection Window | Installation Complexity |
|---|---|---|---|---|
| Triaxial Accelerometer (vibration) | Bearing wear, imbalance, misalignment, looseness, gear mesh defects | 24–72 hrs before failure | 7–21 days before failure | Low — surface mount or stud mount on bearing housing |
| Current Transformer (MCSA) | Rotor bar cracking, winding insulation degradation, air gap eccentricity, bearing defects (via current modulation) | 48–96 hrs before failure | 10–21 days before failure | Very Low — clips to existing power leads at MCC, no motor access required |
| RTD / Thermocouple (thermal) | Bearing thermal overload, winding thermal stress, cooling system degradation | 12–48 hrs before failure | 5–14 days before failure | Low — surface mount to bearing housing or embedded in winding |
| Ultrasonic Sensor | Early-stage bearing surface fatigue, lubrication deficiency, seal leakage, cavitation | 72–120 hrs before failure | 14–28 days before failure | Medium — requires precision placement; sensitive to mounting angle |
| Oil Particle Counter (oil analysis) | Gearbox gear mesh wear, bearing wear debris, oil degradation, contamination ingress | Lab analysis: weeks between data points | 21–28 days (inline sensor) | Medium — inline sensor in oil return line; lab sampling program |
| Magnetic Flux Sensor | Stator winding faults, partial discharge, inter-turn short circuit | Hours to days before failure | 7–18 days before failure | Medium — external clamp-on or internal winding-embedded variants |
CBM vs. Preventive Maintenance vs. Predictive Maintenance: The Financial Case
The business case for condition-based maintenance is not built on technology enthusiasm — it is built on the cost differential between planned and unplanned maintenance events, which in heavy industrial manufacturing is consistently a factor of 10 to 15 between the best-case planned intervention cost and the worst-case emergency replacement cost for the same asset. Understanding that differential, and how it maps to detection lead time, is the foundation of every credible CBM ROI calculation.
CMMS Integration: Closing the Loop from Condition Signal to Work Order
The most common failure point in condition-based maintenance programs that have sensor hardware and monitoring software in place is the gap between fault detection and maintenance action. A CBM platform that generates an alert at 3 AM — "Bearing 2NDE on Pump P-114 shows developing BPFI signature, estimated 16-day intervention window" — and routes that alert to an email inbox that is read at 8 AM, interpreted by a reliability engineer, translated into a work request, reviewed by a maintenance planner, and finally converted to a work order by 10 AM has introduced 7 hours of delay into a process that should have zero human latency. At scale, across dozens of monitored assets, that gap represents the difference between a maintenance program that acts on condition and one that merely observes it.
iFactory's CMMS integration layer eliminates this gap. When the edge AI detects a developing fault and classifies it as a confirmed maintenance action (as opposed to an observation or a process-induced transient), the platform automatically generates a structured work order in the connected CMMS — SAP PM, IBM Maximo, or equivalent — with the fault classification, recommended maintenance scope, required parts list (pre-populated from the asset's parts catalog), crew skill requirement, and deadline calculated from the estimated remaining useful life projection. The work order is in the maintenance planner's queue before the day shift arrives. The maintenance supervisor sees the prioritized task list with deadline context, not a raw alarm log requiring expert interpretation. Maintenance planning becomes a scheduling problem, not a diagnostic problem. Schedule a CMMS integration demo to see the alert-to-work-order workflow for your platform.
Fault Detection and Classification
Edge AI detects anomaly in condition data stream. Multi-variable correlation confirms fault type (bearing, gear mesh, winding, imbalance, misalignment). Confidence score above threshold triggers work order generation logic. Low-confidence observations go to watchlist, not to work order queue — preventing false positive saturation that erodes maintenance team trust.
RUL Estimation and Priority Assignment
AI progression model estimates remaining useful life based on current fault severity and wear rate. Priority level assigned: Critical (less than 7 days), High (7–14 days), Medium (14–28 days), Planned (28+ days). Priority drives work order scheduling and crew allocation in the CMMS queue. Medium and Planned priorities can be deferred to the next available maintenance window without production risk.
Automated Work Order Generation
Structured work order created in CMMS with: asset ID, fault classification, recommended scope, required parts with quantities, estimated labor hours, crew skill requirements, and intervention deadline. Work order tagged as CBM-generated for maintenance KPI tracking. No human translation required between fault detection and work order creation.
Execution Feedback and Model Update
When the maintenance crew completes the work order, findings are recorded: fault confirmed or not found, actual component condition at replacement, any additional findings. This feedback is returned to the AI model as a confirmed training event — improving fault classification accuracy and RUL estimation precision with every maintenance event. The program improves continuously as it accumulates plant-specific confirmation data.
CBM Program KPIs: How to Measure Success and Identify Improvement Opportunities
A condition-based maintenance program without a performance measurement framework is a sensor installation project, not a reliability improvement initiative. The following key performance indicators — organized by the three layers of CBM program performance: detection effectiveness, maintenance execution quality, and business impact — provide the measurement infrastructure required to demonstrate program ROI, identify model tuning opportunities, and build the internal data record that justifies program expansion to additional asset classes.
Expert Perspective: What Changes When a Manufacturing Plant Moves to Condition-Based Maintenance
We ran a traditional preventive maintenance program for eleven years. We were proud of our PM compliance rate — it was above 95%. What we did not track was how many of those PM events were unnecessary, and how many bearing failures we still had on assets that were PM-compliant. In one calendar year before deploying CBM, we had seven unplanned motor-driven equipment failures on assets that had been PM-serviced within 90 days of the failure. The failures did not care about our schedule. When we deployed condition monitoring on our twenty highest-criticality assets and integrated the alerts with our Maximo system, the first thing that changed was not the number of failures — it was the information environment. My maintenance planners went from reacting to failures to scheduling interventions based on actual machine condition. In the first twelve months, we had two CBM-detected interventions that would have been catastrophic failures under our previous program. One of them was a gear mesh anomaly on our primary compressor drive that the AI flagged 22 days before we would have heard anything through a manual vibration check. The repair cost $18,000. Our last unplanned compressor failure cost $290,000 and three weeks of reduced production capacity. That one event paid for the entire program twice over.
Frequently Asked Questions: Condition-Based Maintenance Implementation
Condition-based maintenance is the umbrella strategy: maintain equipment based on its measured condition rather than on elapsed time. Predictive maintenance is the highest-maturity execution of that strategy, where machine learning models interpret multi-variable condition signals to forecast failure timing with a confidence interval. CBM includes everything from simple vibration threshold alarms (when amplitude exceeds X, schedule replacement) to AI-driven remaining useful life models that project the wear curve 14 to 28 days ahead of failure. For most manufacturing facilities, the correct sequencing is: implement foundational CBM — sensor deployment, baseline establishment, threshold monitoring — on your highest-criticality assets first. This delivers immediate value and generates the condition data history that AI predictive models require to train effectively. Predictive AI layers on top of mature sensor and data infrastructure; it does not replace the need for that infrastructure. Attempting to deploy AI predictive maintenance without a clean, consistent condition data foundation is a common CBM failure mode that produces poor model accuracy and erodes team confidence in the program.
For a 20 to 30 asset deployment scope, a well-structured CBM implementation typically requires 12 to 18 weeks from asset criticality assessment to first AI fault detection alerts, broken down roughly as follows: asset assessment and failure mode mapping, 2 to 4 weeks; sensor procurement and installation, 3 to 5 weeks (including baseline establishment period); platform commissioning and CMMS integration, 2 to 3 weeks; model baseline maturity, 4 to 8 weeks of connected operation. Total direct program cost — platform subscription, sensors, and implementation services — for a 20 to 30 asset deployment typically ranges from $120,000 to $280,000 depending on sensor complexity, CMMS integration scope, and existing infrastructure condition. First-year avoided failure savings in deployments of this scale consistently exceed program cost by a factor of 3 to 5 when the asset criticality prioritization has been correctly executed and the program encounters at least one or two significant fault events in the initial monitoring period.
False positives are the primary cause of CBM program abandonment — not technology failure. When maintenance crews respond to 30 to 40 percent of alerts and find no problem, they stop responding to alerts. The solution is a two-part approach. First, ensure the AI conditioning logic explicitly incorporates process state variables: load, speed, feed rate, ambient temperature. A vibration spike during a known process transient (startup, overload condition, feed surge) should be classified as a process event, not a mechanical fault. This single change eliminates the majority of false positives in crusher and pump applications. Second, implement a confidence-threshold filtering layer: only alerts above a minimum confidence score (typically 75 to 80%) should generate work orders; lower-confidence anomalies go to a watchlist that the reliability engineer reviews weekly, not to the maintenance crew queue directly. With these two controls, mature iFactory deployments maintain false positive rates below 3 percent of total alerts, which is the threshold at which maintenance teams reliably trust and act on the alert stream.
Yes — and in U.S. heavy manufacturing, the majority of high-value assets that benefit most from CBM monitoring are 10 to 30 years old with minimal or no installed condition monitoring sensors. The retrofit path is well-established. Motor Current Signature Analysis requires only current transformer clips at the MCC — no access to the motor itself, no wiring changes to the motor, and installation is typically completed in 2 to 4 hours per motor regardless of motor age or OEM. Vibration accelerometers mount to bearing housings with stud mounts or adhesive pads, with no equipment modification required. Surface-mount RTDs attach to bearing housing exteriors with thermal paste and mounting brackets. A complete sensor retrofit on a 20-year-old 500 kW motor drive assembly — accelerometers at all bearing positions, current transformers at the MCC, and surface RTDs at bearing housings — typically requires 1 to 2 days of on-site work. The asset's age does not constrain the monitoring program; the only constraint is the clarity and consistency of the condition data generated once sensors are installed.
ROI timeline in CBM programs is event-driven, not time-driven — which means the fastest paybacks occur at facilities that experience their first significant avoided fault event early in the monitoring period. The statistical reality for a 20 to 30 asset deployment scope at a continuous manufacturing facility is that one or two significant fault events will be detected in the first 6 to 9 months of monitoring on a fleet of that size. A single avoided emergency bearing replacement with secondary shaft damage typically generates $120,000 to $340,000 in avoided costs — often sufficient to cover the entire first year of program cost. For facilities with lower failure frequency, the ROI calculation shifts to the maintenance cost reduction value: eliminating unnecessary preventive maintenance events, reducing emergency parts premium spend, and optimizing crew labor utilization. In documented iFactory deployments, the median time to program cost recovery is 7 months, with the fastest programs reaching payback in 3 to 4 months following the first major avoided failure event.
Conclusion: Condition-Based Maintenance Is an Infrastructure Decision, Not a Technology Purchase
The plants that extract full ROI from condition-based maintenance programs are not the ones that deploy the most advanced AI first. They are the ones that build the right foundation: a clear asset criticality hierarchy, correctly matched sensors at the right measurement points, a clean and consistent condition data stream, and a CMMS integration that eliminates the human latency between fault detection and maintenance scheduling. The technology — whether threshold alarms or AI-driven fault progression models — delivers value proportional to the quality of that foundation.
The financial case for CBM is not a projection — it is a documented record across hundreds of industrial deployments showing consistent 3 to 5× first-year ROI, 60 to 70% reductions in unplanned downtime, and 25 to 40% reductions in total maintenance cost on monitored assets. Every one of those outcomes was built on the same foundation: the right sensors, the right data, and a monitoring platform that converts condition signals into actionable maintenance intelligence before failures reach the point of unplanned production loss. iFactory's CBM platform is built to deliver that outcome — from the asset criticality assessment through edge inference, CMMS integration, and continuous model improvement — on the sensor infrastructure most manufacturing facilities already have installed.