Every day your production floor runs without a digital twin, you are making decisions blindly — relying on lagging indicators, reactive maintenance logs, and gut instinct while competitors model failures before they happen, simulate bottlenecks before they cost millions and optimise energy consumption in real time. The question is no longer whether manufacturers need digital twin technology. The question is how much longer you can afford to operate without it.
iFactory Digital Intelligence
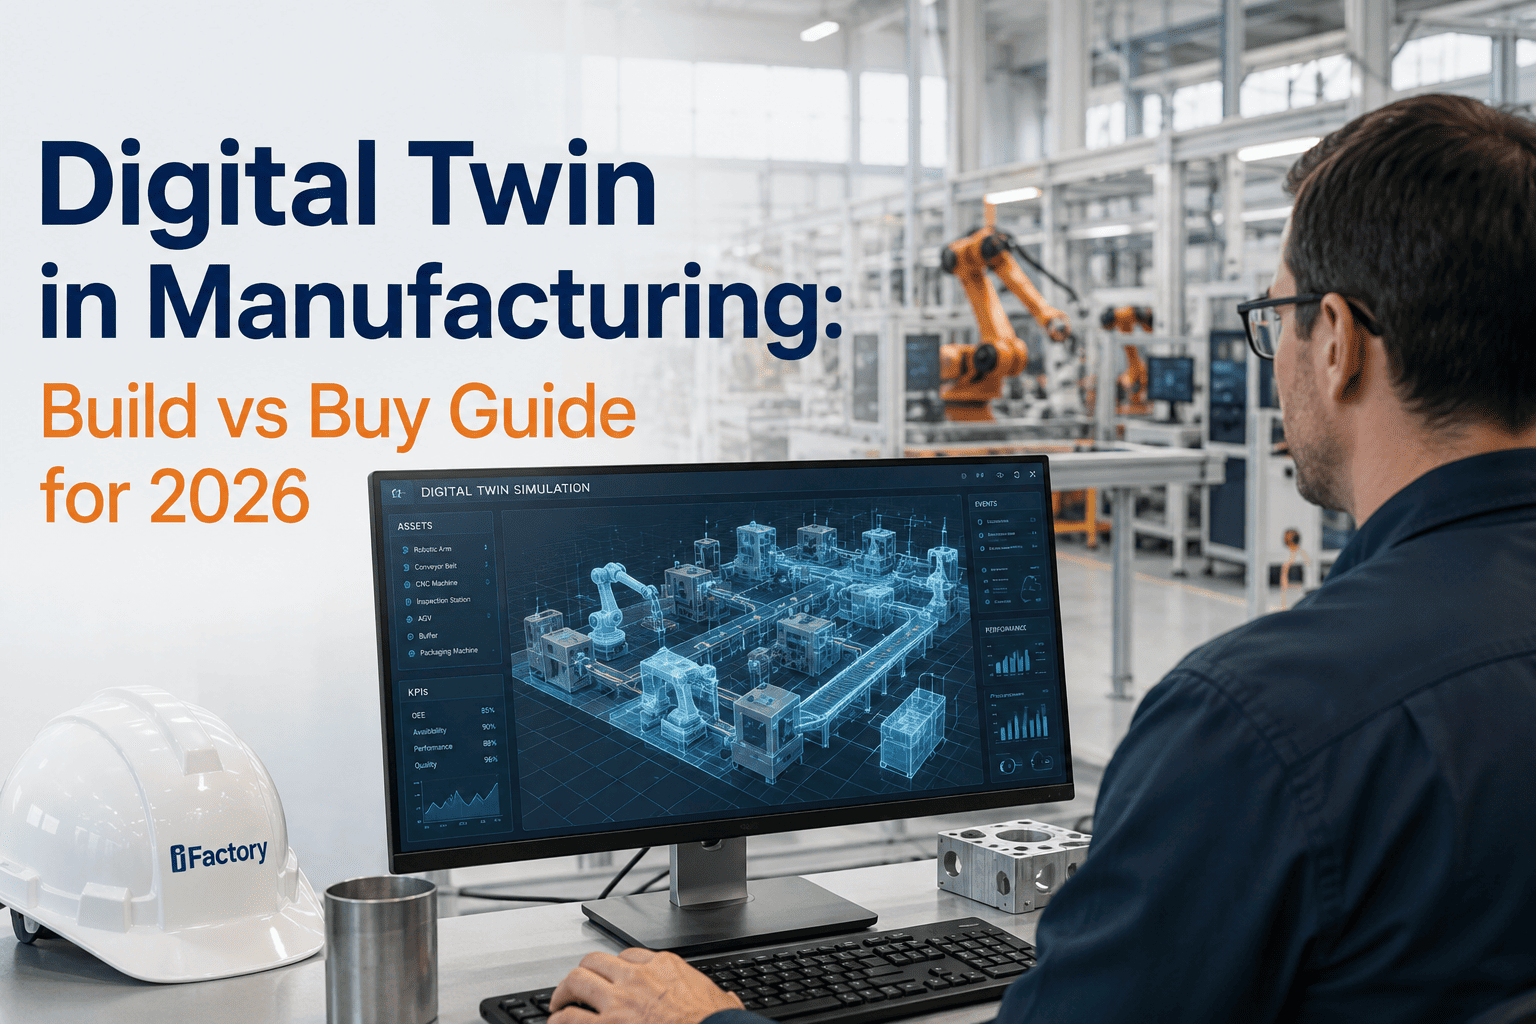
Digital Twin in Manufacturing: The Complete Build vs Buy Guide for 2026
How leading manufacturers simulate bottlenecks, predict failures, and cut downtime costs — before they happen. Architecture, use cases, ROI, and a clear framework for implementation.
48%
Market CAGR through 2028
$3.5M
Annual savings potential
10-30x
Return on investment
72%
Manufacturers deploying by 2026
What Is a Digital Twin in Manufacturing?
A digital twin is a real-time virtual replica of a physical asset, production line, or entire factory floor — continuously updated by live sensor data and capable of running simulations, predicting failures, and generating optimisation recommendations without touching the physical environment. Unlike static CAD models or periodic simulations, an AI-powered digital twin evolves alongside its physical counterpart, learning normal operating patterns and detecting deviations that signal impending failure or inefficiency.
For manufacturers, this translates directly into three measurable outcomes: reduced unplanned downtime, lower maintenance spend, and improved throughput — all derived from the same data infrastructure. The factory digital twin is not a visualisation tool. It is an operational decision engine.
A plant running 200 monitored assets with predictive analytics typically identifies $1.2M–$3.5M in annual savings from avoided downtime, eliminated over-maintenance, and energy waste reduction. The digital twin ROI payback period is 12–18 months on average.
Digital Twin Architecture: How It Actually Works
Understanding the architecture layers helps manufacturers make better build-vs-buy decisions and avoid the most common implementation traps. A production-grade digital twin platform consists of five interdependent layers:
01
Data Ingestion Layer
OPC-UA, MQTT, and REST API connectors pull real-time signals from SCADA systems, historians, PLCs, and IoT sensors. Vibration, temperature, current, pressure — all unified into a single time-series stream.
02
Digital Model Layer
Asset models ranging from rule-based thresholds to physics-informed neural networks. Model complexity scales with data availability — start with statistical baselines, advance to LSTM and gradient boosting as training data matures.
03
Analytics Engine
Anomaly detection, Remaining Useful Life projections, failure mode classification, and what-if scenario simulation. The engine runs continuously, not on a scheduled report cycle.
04
Integration Layer
Bi-directional feeds to CMMS, ERP, and financial systems. AI-generated work orders, compliance documentation, and TCO calculations flow automatically — eliminating manual data transfer.
05
Intelligence Interface
Natural language query interfaces, real-time health dashboards, and executive KPI reporting. Operators ask questions in plain language. Executives see financial impact. Both get what they need.
Industry 4.0 Digital Twin Use Cases That Generate Measurable ROI
The smart factory twin is not a single application — it is a platform that unlocks multiple value streams simultaneously. The following use cases represent validated deployments across discrete manufacturing, process industries, and food and beverage production:
Predictive Maintenance
AI models predict motor, pump, and compressor failures 14–21 days in advance. Maintenance teams schedule interventions during planned windows instead of responding to midnight breakdowns. Unplanned downtime falls 30–50% within the first year.
Bottleneck Simulation
The virtual factory twin runs production schedule scenarios before they execute physically. Bottlenecks, starved stations, and throughput constraints surface in the simulation — not on the production floor. Line changeover planning improves 20–35%.
Energy Optimisation
Continuous correlation of energy consumption against asset condition and production output identifies waste invisible to static energy audits. Manufacturers typically recover 8–15% of energy spend within six months of activation.
Quality Prediction
Process parameter deviations that precede quality defects are detected in real time. The twin flags at-risk production runs before defective product reaches inspection — reducing scrap rates and rework costs by 15–25%.
New Asset Commissioning
Virtual twin testing of new equipment configurations before physical installation cuts commissioning ramp-up time by 30–40%. Engineering teams validate operating parameters in simulation, not in expensive production trials.
ESG and Compliance Reporting
Twin data auto-generates ISO 55000, OSHA, and ESG documentation from operational records — eliminating manual compliance compilation and reducing audit preparation time from weeks to hours.
Build vs Buy: The Decision Framework for 2026
The build-vs-buy decision for a factory digital twin is one of the most consequential technology choices a manufacturing organisation makes. Both paths have legitimate use cases — and both have traps that destroy projects before they generate value.
| Decision Dimension |
Build In-House |
Buy a Platform |
| Time to First Value |
12–24 months to minimum viable product |
4–6 weeks to first anomaly alerts |
| Upfront Investment |
$800K–$2.5M engineering and infrastructure |
$50–150K Phase 1 pilot deployment |
| Ongoing Maintenance |
Dedicated ML engineering team required |
Vendor-managed model updates and retraining |
| OT Integration Complexity |
Custom connectors for every protocol |
Pre-built OPC-UA, MQTT, REST, and SCADA connectors |
| Scalability |
Each new asset requires re-engineering |
Configuration-driven expansion to 200+ assets |
| Predictive Model Quality |
Starts from zero — no pre-trained baselines |
Transfer learning from thousands of asset-hours |
| Risk Profile |
High — technology and talent concentration risk |
Low — phased rollout with gate criteria at each stage |
| ROI Payback Period |
3–5 years if project completes |
12–18 months with validated milestones |
The build path is appropriate for manufacturers with unique proprietary processes, dedicated ML engineering teams, and multi-year strategic timelines. For the majority of industrial operators, a proven platform with a phased implementation roadmap delivers faster ROI, lower risk, and better outcomes — because the hard problems of OT integration and model training have already been solved.
The Impact on Operations: Three Dimensions of Value
Workflow Transformation
- Maintenance shifts from calendar-based to condition-based scheduling
- AI auto-generates work orders with correct parts and procedures
- Natural language queries replace complex report generation
- Cross-shift knowledge captured in the twin, not lost at handover
Overhead Reduction
- 30–50% reduction in unplanned downtime costs
- 20–35% decrease in total maintenance spend
- 8–15% energy cost recovery within six months
- Compliance documentation hours cut from weeks to hours
Output and Growth
- OEE improvements of 8–15 percentage points on monitored lines
- New asset commissioning 30–40% faster with virtual testing
- CAPEX planning backed by asset health data, not depreciation schedules
- Continuous AI model improvement compounds ROI year over year
Digital Twin ROI: What the Numbers Actually Look Like
ROI calculations for plant digital twins are often presented as aspirational ranges. The following figures are drawn from documented deployments across manufacturing verticals — not vendor projections.
Phase 1–2 Investment
$80–230K
Sensors, platform setup, integration, model training for 10–20 pilot assets
Phase 2 Return (Months 2–6)
$100–400K
First avoided failures and eliminated unnecessary maintenance events
Full Deployment Annual Savings
$1.2–3.5M
Predictive maintenance, energy optimisation, and quality improvement combined
5-Year Cumulative Return
10–30x
Compound ROI as AI models mature and coverage expands across facilities
Request a personalised ROI projection for your facility based on asset count, downtime costs, and maintenance spend.
Request a Performance Audit
Common Failure Patterns — and How to Avoid Them
Most digital twin projects that fail do so for operational reasons, not technical ones. The patterns are consistent across industries and organisation sizes:
Failure Mode 1
Scope Overreach
Attempting a full-facility virtual factory twin from day one overwhelms engineering resources and delays value delivery past the point of executive patience. The fix: start with 10–20 critical assets, prove value in weeks, scale after demonstrated ROI.
Failure Mode 2
Model Before Data
Building elaborate physics simulations before confirming sensor infrastructure exists produces academic exercises, not operational tools. The fix: audit data availability first. Let sensor coverage drive model complexity, not the reverse.
Failure Mode 3
No Success Metrics
Launching without defined KPIs makes ROI impossible to demonstrate. When leadership asks whether it is working and the answer requires a 40-slide deck, the project is already at risk. The fix: define 3–5 financial KPIs upfront and report monthly in dollar terms.
Failure Mode 4
IT Without OT Buy-In
Digital twin platforms owned entirely by IT without maintenance and operations involvement get built but never adopted. The fix: joint IT-OT ownership from day one. Maintenance champions select pilot assets. Operators validate alert relevance.
Is iFactory the Right Platform for Your Facility?
iFactory's AI-powered digital twin platform is purpose-built for industrial manufacturers — not adapted from enterprise IT tooling. The platform combines real-time asset monitoring, predictive analytics, autonomous work order generation, and generative AI query interfaces in a single deployment that integrates with your existing SCADA, CMMS, and ERP systems without rip-and-replace.
Start Small. Prove Fast. Scale Deliberately.
Your Digital Twin Journey Starts with 12 Sensors, Not a 12-Month Plan
Book a free 30-minute deployment planning session. Our engineers will map your existing infrastructure, identify your highest-value pilot assets, and build a phased roadmap with financial projections specific to your facility.
4–6wk
Time to first value
$3.5M
Annual savings potential
10–30x
Return on investment