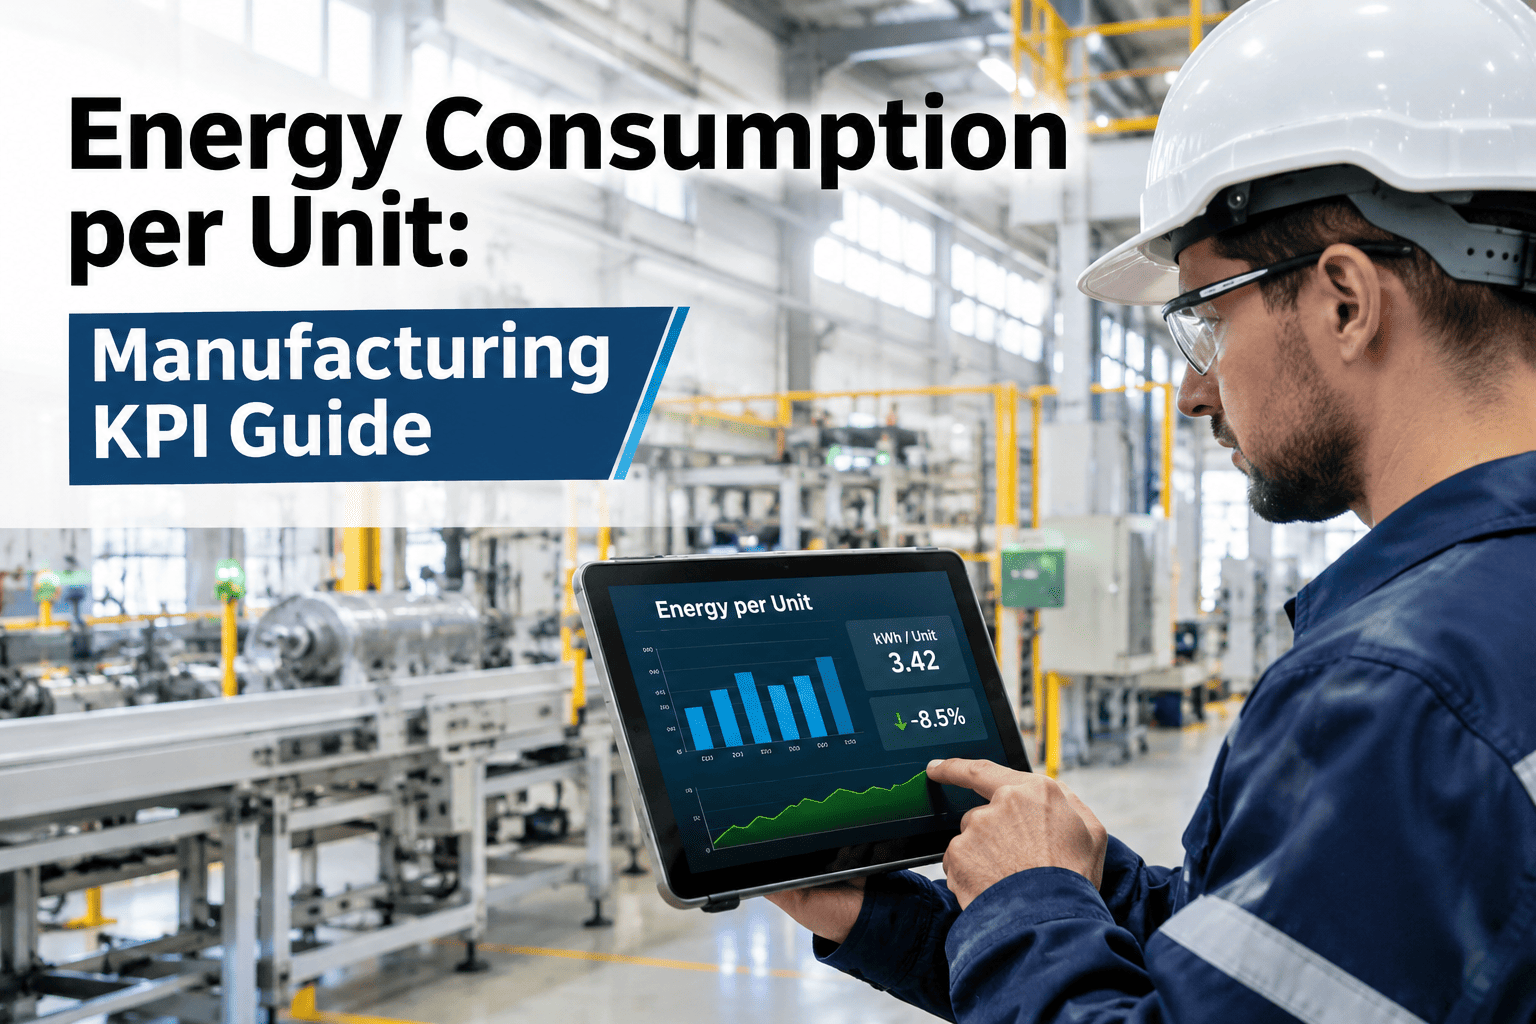
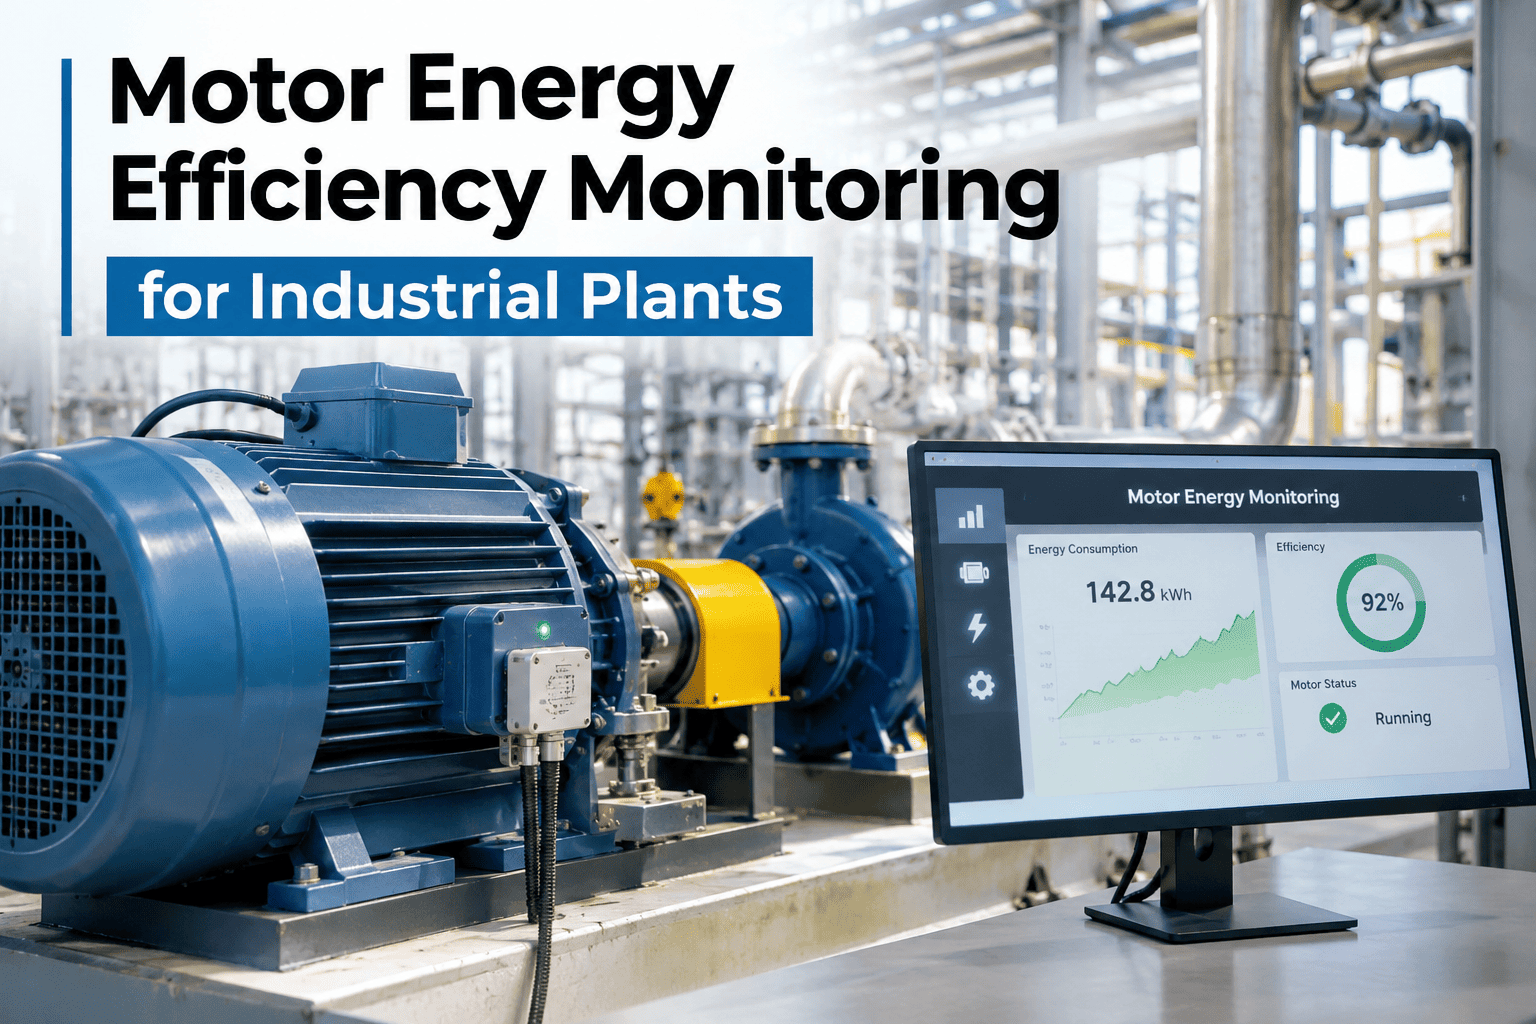
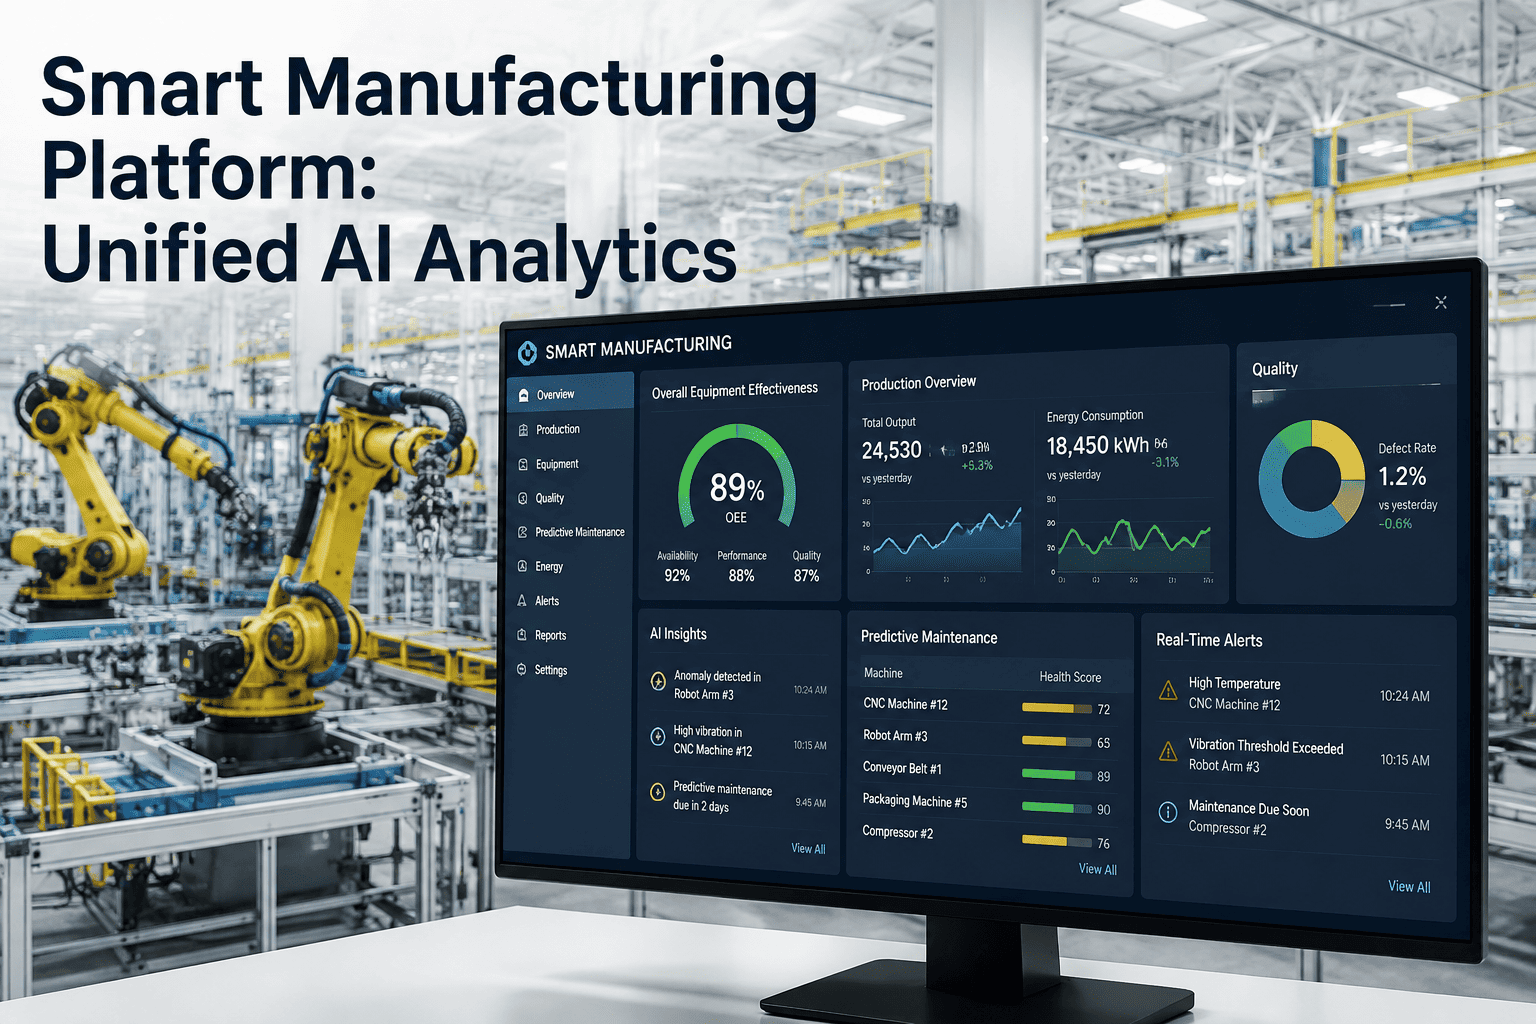
Total energy consumption tells you how much a plant used, but it does not tell you whether that usage was efficient, because a busier month naturally consumes more energy than a slow one. Energy consumption per unit, whether measured per batch, per kilogram or per production hour, normalizes for output so you can actually compare efficiency across time periods and identify which specific processes are the most energy-intensive relative to what they produce. Tracking this ratio consistently is what turns energy data into a real efficiency KPI rather than just a cost total, and our team can walk you through how to set this up for your own production data.
Manufacturing energy KPIs
Normalize Energy Use Against Output to Find Your Real Efficiency Picture
iFactory AI tracks energy consumption per unit, batch, kilogram or production hour, turning raw energy totals into a KPI you can actually compare across time and processes.
Why total consumption misleads
A Busier Month Always Uses More Energy, That Does Not Mean It Was Less Efficient
Comparing raw energy totals month to month confuses output changes with efficiency changes, since a plant running at higher volume will naturally consume more energy even if every process is running just as efficiently as before.
Raw total rises
Energy consumption increases with higher output
Looks like a problem
A rising number alone appears concerning
Output was also higher
The increase may simply reflect more production
Per-unit view clarifies
Dividing by output reveals whether efficiency actually changed
Four ways to normalize
Choosing the Right Denominator for Your Process
Per unit produced
Best for discrete manufacturing with countable finished items.
Per batch
Fits batch processes like dyeing or chemical mixing runs.
Per kilogram
Suits continuous or weight-based production like textiles or bulk materials.
Per production hour
Useful when output volume is hard to measure precisely but run time is clear.
Set Up Your Own Energy-Per-Unit Tracking
Share how you currently measure production output and see which normalization approach fits your process.
KPI comparison table
What Changes When You Normalize by Output
| Measure | What it shows | What it misses alone |
|---|
| Total energy consumption | Overall cost and usage scale | Whether usage was efficient relative to output |
| Energy per unit | Efficiency trend independent of volume changes | Absolute cost scale |
| Energy per unit by process | Which specific process is most energy-intensive | Plant-wide total picture |
Setup pipeline
Four Steps to Tracking Energy Per Unit
1
Choose your denominator
Select unit, batch, kilogram or hour based on your process type.
2
Connect energy and output data
Link energy readings to the corresponding production output.
3
Calculate the ratio over time
Track energy per unit across shifts, days and months.
4
Compare across processes
Identify which specific processes carry the highest energy intensity.
Common pitfalls
Three Mistakes in Energy-Per-Unit Tracking
1
Using the wrong denominator
A per-unit measure that does not match how your process actually varies hides the real pattern.
2
Mixing products with very different energy intensity
Averaging across dissimilar products blurs which one is actually driving cost.
3
Tracking the KPI without a target or trend line
A number with nothing to compare against does not drive any action.
Expert review
Energy per unit is only a useful KPI when it is tracked consistently over time and broken down enough to compare like with like. A single plant-wide average can hide as much as it reveals if your product mix varies significantly.
Watch for
A single blended energy-per-unit number across very different products or processes.
Do next
Break your energy-per-unit tracking down by process or product line before drawing conclusions.
— iFactory energy specialists
Frequently asked questions
What Plants Ask About Energy-Per-Unit KPIs
Which denominator should we choose if we are not sure?
The denominator that most naturally matches how your output is already tracked, whether that is finished units, batches or weight, usually makes the KPI easiest to calculate and understand consistently.
Discuss your production measurement.
Can we track energy per unit for individual machines, not just the whole plant?
Yes, and doing so at the machine or process level is often more useful than a plant-wide figure, since it reveals which specific step is driving energy intensity rather than averaging it away.
Ask about machine-level tracking.
How do we set a meaningful target for this KPI?
Using your own historical best performance as an initial target is often more realistic than an industry benchmark, since it reflects what your specific equipment and process have actually achieved before.
Talk through setting a target.
What if our product mix changes frequently?
Tracking energy per unit separately for each product type, rather than one blended figure, keeps the KPI meaningful even as the mix shifts from period to period.
Discuss your product mix.
How often should this KPI be reviewed?
A regular cadence, often monthly alongside other production KPIs, keeps energy intensity visible as part of normal operating review rather than something checked only occasionally.
Ask about review frequency.
From a raw total to a real efficiency measure
Turn Energy Data Into a KPI You Can Actually Compare Over Time
Book a session with iFactory AI to review your production data and set up energy-per-unit tracking for your plant.