Every thermal runaway event in EV battery manufacturing that reaches a customer costs an OEM an average of $2.3 million in recalls, litigation, and brand erosion — and 94% of those events trace back to defects that were detectable at the cell level, weeks before the pack ever shipped. If your gigafactory is still relying on manual inspection logs, and disconnected MES data, you are not managing quality. You are managing liability after the fact.
iFactory Quality Intelligence
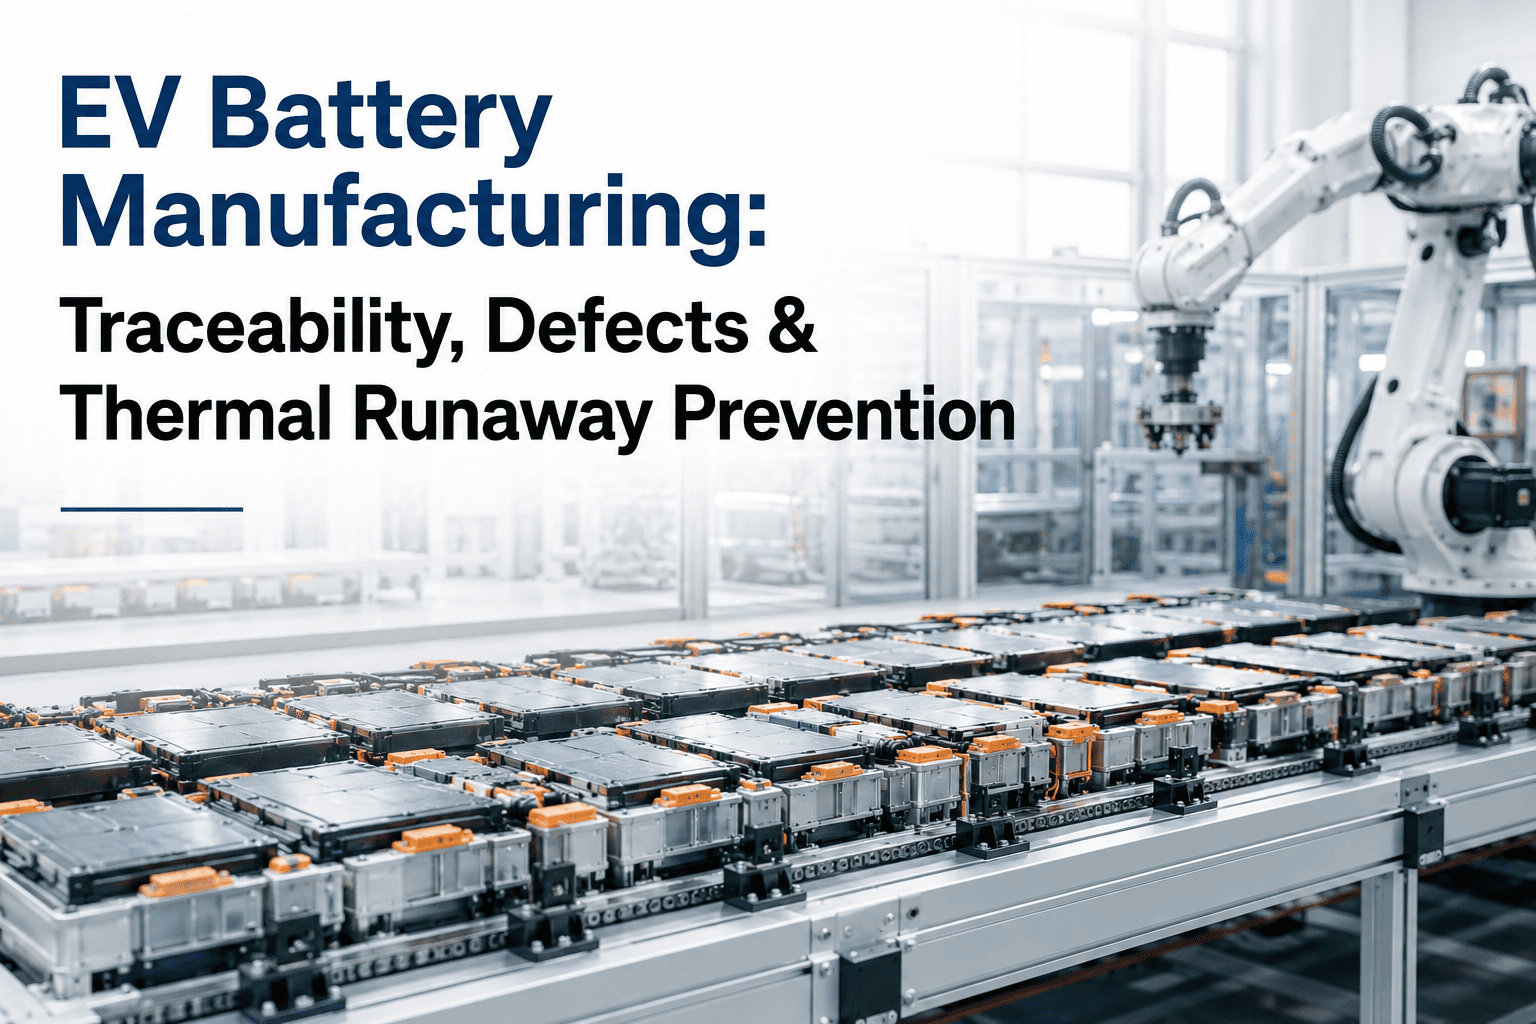
EV Battery Manufacturing: Cell-Level Traceability, Defect Detection & Thermal Runaway Prevention
How modern MES and AI-powered quality management close the gaps that legacy systems miss — from electrode coating to pack-level sign-off
94%
Of thermal runaway events linked to detectable cell-level defects
$2.3M
Average cost per recall event reaching end customer
68%
Reduction in scrap rates with AI-driven inline inspection
100%
Cell-level genealogy required for Tier 1 OEM compliance
Why EV Battery Quality Is the Highest-Stakes Manufacturing Problem of the Decade
Lithium-ion cell manufacturing operates within tolerances measured in microns. A coating thickness deviation of 3–5 µm, an electrolyte fill variation of 0.2 ml, or a micro-crack in a separator layer that passes visual inspection can produce a cell that operates normally for 18 months before entering thermal runaway at 40% state of charge in a customer's vehicle. The failure mode is not immediately visible. The liability is not immediately calculable. But the risk is entirely manageable — if your quality management system is built for the physics of battery manufacturing, not repurposed from automotive stamping or consumer electronics assembly.
The gigafactory era has compressed timelines, scaled volumes, and multiplied the consequences of every process deviation. OEMs demanding cell-level traceability, regulators requiring full genealogy documentation, and insurance underwriters repricing EV product liability coverage are all sending the same signal: disconnected quality systems are no longer a competitive disadvantage. They are an existential risk.
The Five Critical Quality Failure Points in Lithium-Ion Cell Manufacturing
01
Electrode Coating Inconsistency
Anode and cathode coating weight variation outside ±1.5% spec directly impacts energy density and cycle life. Manual gravimetric sampling at 1-in-20 intervals misses drift events that compound across thousands of cells per shift.
Risk: Capacity fade, premature cycling failure, OEM batch rejection
02
Separator Defects and Micro-Shorts
Pinholes, wrinkles, and contamination in separator film are the leading precursor to internal short circuits. Hi-pot testing catches gross failures; AI-powered vision inspection catches the edge cases that pass electrical testing but fail in field conditions.
Risk: Thermal runaway, fire events, NHTSA investigation triggers
03
Electrolyte Fill Variation
Over- and under-fill conditions are invisible post-sealing. Without inline gravimetric verification linked to cell genealogy, fill variation propagates to pack level and surfaces only during formation cycling or field operation.
Risk: Capacity loss, gas venting, module-level thermal event
04
Formation and Aging Data Gaps
Formation cycling generates the richest quality signal in cell manufacturing. Plants without MES integration to cycler data cannot correlate formation anomalies with upstream process parameters — destroying the diagnostic value of millions of data points per day.
Risk: Substandard cells entering module assembly, missed SPC triggers
05
Pack-Level Traceability Breaks
When cell genealogy cannot be traced to the pack and VIN level, a single supplier notification triggers full-fleet recall rather than targeted remediation. The difference between a 3,000-unit targeted action and a 90,000-unit recall is complete cell-to-pack traceability.
Risk: Maximum-scope recalls, NHTSA consent orders, OEM chargebacks
Legacy Systems vs. AI-Powered Quality Management: The Gap That Costs You
Defect Detection
Sampling-based; 1-in-20 or 1-in-50 pull rates. Defect clusters escape between samples.
100% inline AI vision inspection with real-time classification and automatic line-stop triggers.
Cell Traceability
Paper travellers or disconnected spreadsheets. Genealogy reconstructed manually post-event.
Continuous cell-level digital thread from slitting to VIN assignment. Instant audit response.
Thermal Risk Signals
Formation cycling anomalies logged in cycler software. No correlation to upstream process data.
AI correlates formation signatures to coating, fill, and stacking data. Flags cells 14 days before failure.
SPC Response Time
Shift-end SPC review. Process drift detected 6–8 hours after deviation begins.
Real-time SPC with automated alerts at 1.5-sigma drift. Correction in minutes, not hours.
OEM Audit Readiness
3–5 day data compilation effort per audit. Manual extraction from multiple disconnected systems.
One-click audit package generation. Full genealogy, inspection records, and SPC charts in minutes.
Recall Scope
Maximum-scope recall when traceability cannot isolate affected population.
Targeted remediation based on cell genealogy. 90%+ reduction in recall scope.
How iFactory Quality Management Closes Each Gap
Cell-Level Digital Thread
Unique cell ID tracked from electrode slitting through formation, grading, and pack assembly
Every process parameter, inspection result, and test record linked to cell barcode or RFID
Full genealogy exportable in IATF 16949 and OEM-specific formats within seconds
VIN-to-cell traceability enables targeted recall containment rather than fleet-wide action
AI Defect Detection and SPC
Computer vision models trained on battery-specific defect libraries — pinholes, delamination, coating voids
Real-time SPC on coating weight, tab placement, weld quality, and electrolyte fill
Automated line-stop and quarantine triggers when out-of-spec conditions are detected
68% average reduction in scrap rates within 90 days of full deployment
Thermal Risk Prediction
Formation cycling data correlated with upstream process parameters to identify thermal risk signatures
Predictive models flag high-risk cells 14–21 days before field failure probability peaks
Risk score appended to cell genealogy record — flagged cells quarantined before pack assembly
Continuous model retraining as field return data feeds back into the prediction engine
Request a Quality Management Performance Audit
Our engineers will benchmark your current traceability coverage, defect escape rate, and SPC response time against gigafactory best practice — at no cost.
Book a Free Audit
The Business Case: What Full Traceability and AI Quality Management Delivers
68%
Scrap Rate Reduction
AI inline inspection catches defects at source rather than at end-of-line or in the field. Scrap cost savings alone typically fund full deployment within 6 months at gigafactory volumes.
90%+
Recall Scope Reduction
Full cell-to-VIN traceability transforms fleet-wide recall actions into targeted containment. A single avoided maximum-scope recall can represent $40–$200M in savings.
3 days → 20 min
Audit Response Time
OEM quality audits that previously required multi-day data compilation are satisfied with one-click genealogy export. Engineering hours redirected to process improvement, not documentation.
Frequently Asked Questions: EV Battery Quality Management
Does iFactory support pouch, prismatic, and cylindrical cell formats?
Yes. The quality management and traceability modules are format-agnostic. Cell ID capture methods (barcode, DataMatrix, RFID, laser marking) are configured per line. Inspection models are trained on format-specific defect libraries. Multi-format plants can run concurrent configurations within a single platform instance.
How does iFactory integrate with existing formation cycling equipment and test systems?
The platform connects to cycler data via OPC-UA, MQTT, and direct database integration with major cycler vendors. Formation data — charge/discharge curves, capacity, internal resistance — is ingested in real time, linked to cell genealogy, and made available to the predictive quality models without manual export or re-entry.
What does implementation look like for a greenfield gigafactory versus a brownfield plant?
Greenfield deployments begin with MES and traceability architecture during line design — the most cost-effective integration point. Brownfield plants follow a phased approach: traceability and SPC on highest-risk lines first, expanding to full coverage within 6–10 months. Both paths follow the same phased roadmap with clear gate criteria and measurable ROI at each stage.
Which OEM and regulatory standards does the platform support for compliance documentation?
iFactory generates documentation aligned with IATF 16949, VDA 6.3, EU Battery Regulation (traceability and carbon footprint requirements effective 2026), and major OEM supplier quality manuals. Compliance packages are configurable per customer requirement and exportable on demand.
EV Battery Quality Intelligence
Your Next OEM Audit or Field Event Will Test Your Traceability. Will You Pass?
iFactory's AI-powered quality management platform closes the cell-level traceability, defect detection, and thermal risk gaps that legacy MES systems were never designed to address. First measurable results in 4–6 weeks. Full ROI within 12–18 months.
4–6 wkTime to first value
68%Scrap reduction
90%+Recall scope reduction
10–30xReturn on investment