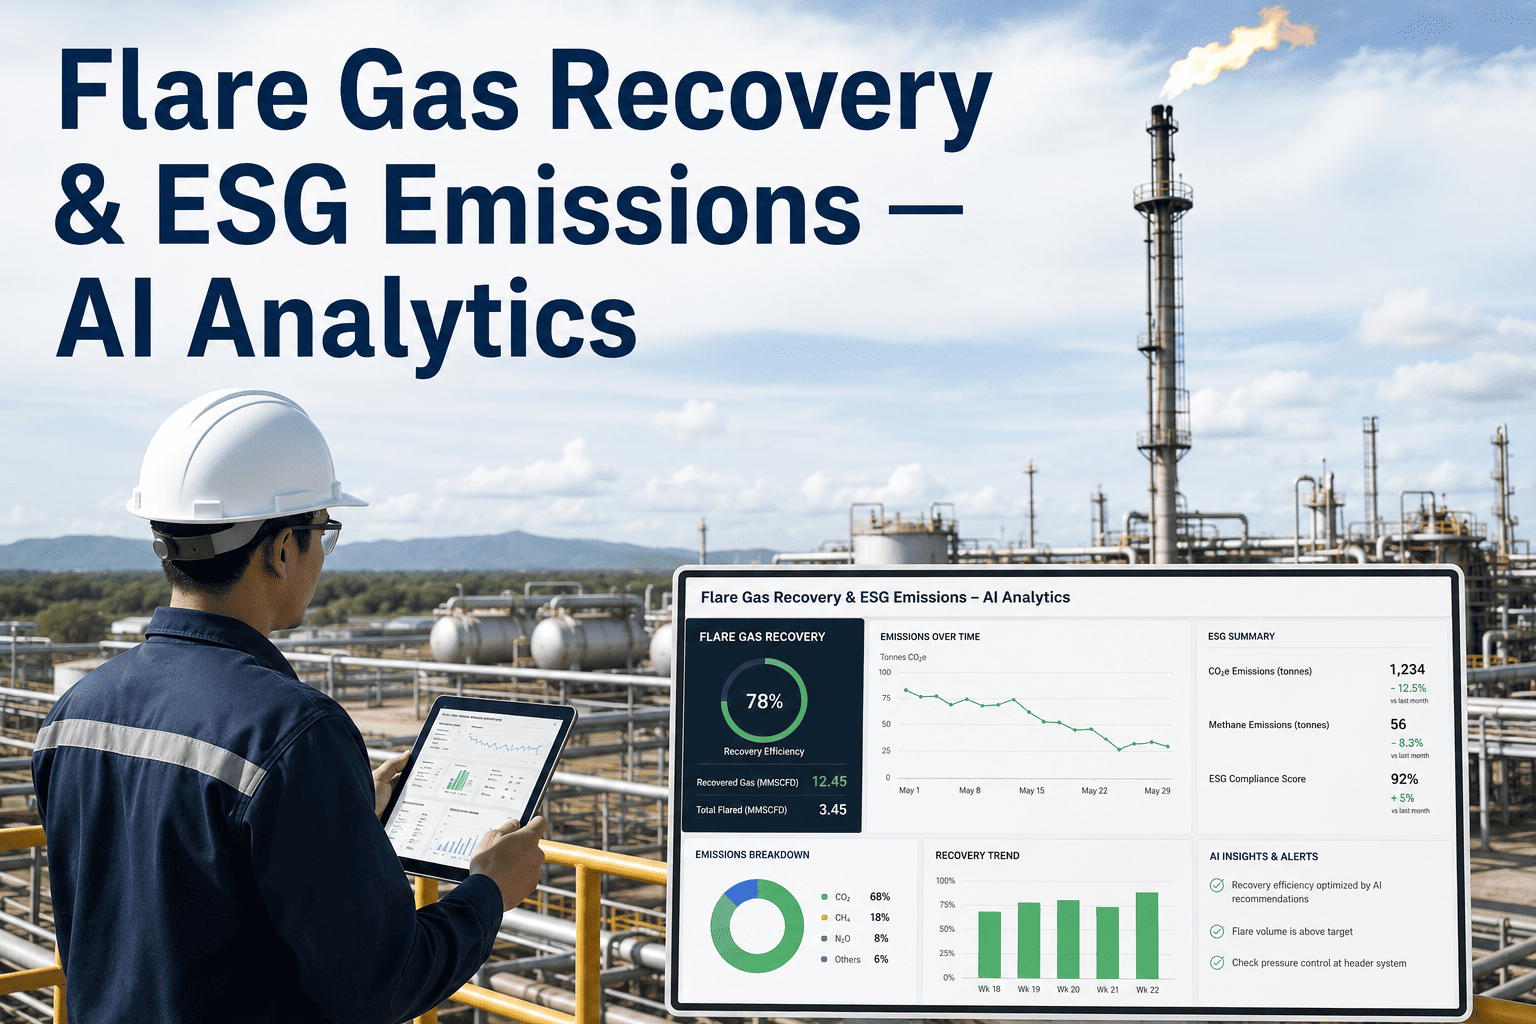
Routine flaring quietly drains two things from an oil and gas operation at once — recoverable revenue and regulatory headroom. A flare stack burning off associated gas at 40% combustion inefficiency is not just an emissions liability under Scope 1 reporting rules, it is unsold product converting into CO2 in front of your eyes. Operators managing multiple well pads or a single gathering station often have no continuous visibility into flare gas composition, combustion efficiency, or the volume actually being recovered versus vented — until an ESG audit or a regulatory filing deadline forces a scramble. AI-driven flare monitoring changes that equation, and teams that want a working benchmark can book a demo to see it applied to a live gathering system.
Why Flare Efficiency Is the Metric Most Operators Are Flying Blind On
Flare combustion efficiency is not a fixed number — it swings with gas composition, wind speed, tip condition, and assist gas or steam ratio, sometimes by 20 percentage points across a single day. Most sites still rely on periodic manual readings or a single fixed thermocouple, which means the operator's own emissions estimate can be wrong by a wide margin without anyone knowing. A flare gas recovery system paired with continuous combustion monitoring closes that blind spot, giving operations and compliance teams the same real-time number instead of two conflicting estimates at reporting time.
The Flare Gas Value Chain — Where Volume Is Won or Lost
Every cubic foot of associated gas moves through a chain of decisions before it either reaches a vapor recovery unit or is burned at the tip. AI-based flare monitoring watches this chain continuously rather than at the monthly reporting cadence most sites still rely on.
Associated gas volume and composition measured at the source, before separation.
Gas routed either to sales line, vapor recovery unit, or flare header based on pressure and capacity.
Recoverable volume captured and compressed back into the sales stream instead of the flare header.
Remaining volume combusted, with efficiency dependent on tip condition, wind and assist gas ratio.
Continuous meter and composition readings feed directly into ESG and Scope 1 emission calculations.
Comparing Flare Monitoring Approaches: What Actually Moves the Needle
Not every monitoring upgrade delivers the same reduction in routine flaring or the same improvement in reporting accuracy. The table below compares the most common approaches operators evaluate, based on typical field deployments across gathering systems and well pads. If you want the numbers modeled against your own flare header configuration, book a demo and bring your last three months of flare volume data.
| Monitoring Approach | Data Frequency | Flaring Reduction | ESG Reporting Accuracy | Typical Payback |
|---|---|---|---|---|
| Manual periodic readings | Weekly / monthly | Baseline | Low | N/A |
| Fixed flare meter only | Continuous, single point | 5–10% | Medium | 12–18 months |
| Continuous combustion sensing | Real-time | 15–22% | High | 8–12 months |
| AI-based flare optimization | Real-time, predictive | 20–30% | Very High | 4–7 months |
| Integrated VRU + AI monitoring | Real-time, closed-loop | 25–35% | Very High | 3–6 months |
Building an ESG Report That Withstands Scrutiny
Scope 1 emission tracking built on estimated combustion factors rather than measured data is the single most common weak point auditors flag in oil and gas ESG filings. A defensible report needs measured flare gas composition, a validated combustion efficiency figure, and a documented methane leak detection and repair program — not a single blended emission factor applied across every flare on the lease. iFactory structures this data continuously so the quarterly report is a summary of existing numbers, not a reconstruction project. Book a demo to see the ESG reporting module generate a sample filing from live flare data.
Replaces the default 98% assumption regulators increasingly reject with a continuously calculated, defensible figure per flare.
Continuous methane, CO2 and heavier hydrocarbon fractions feed directly into greenhouse gas quantification models.
Methane leak detection and repair findings are timestamped and linked to the same emissions ledger used for reporting.
Verified flaring reduction volumes are structured to support carbon credit and offset program documentation.
Zero Flaring Targets: What the World Bank Initiative Means for Your Reporting Timeline
The World Bank's Zero Routine Flaring initiative has shifted from a voluntary pledge to an increasingly enforced benchmark that lenders and investors reference when evaluating upstream operators. Meeting a zero routine flaring commitment does not require eliminating flaring entirely — it requires demonstrating that flaring is limited to safety and non-routine events, with routine associated gas captured or utilized instead of burned. That distinction only holds up under audit if the operator can separate routine from non-routine flare events in its data, which requires continuous monitoring rather than periodic snapshots. Operators building toward this target typically see the fastest progress by first instrumenting the highest-volume flares in their portfolio, then expanding coverage as the AI recovery models prove out.
Frequently Asked Questions: Flare Gas Recovery and ESG Reporting
How does AI improve flare gas recovery compared to manual monitoring?
AI-based monitoring continuously tracks combustion efficiency, wind conditions and assist gas ratios, then recommends adjustments in near real time. Manual monitoring only captures a snapshot every few days, missing the swings that account for most avoidable flaring volume. Book a demo to see the difference on your own flare data.
What data is required to calculate Scope 1 emissions from flaring accurately?
Accurate Scope 1 figures need measured gas volume, measured or modeled composition, and a validated combustion efficiency rather than a default assumption. Missing any one of these three typically produces an emissions estimate that is off by 15% or more.
Can a vapor recovery unit fully eliminate routine flaring?
A properly sized VRU can capture the large majority of associated gas under normal operating pressure, but it cannot handle every upset or high-pressure event, so some non-routine flaring will remain. The goal is separating that non-routine volume clearly from routine flaring in your reporting.
How quickly can a flare monitoring system be deployed on an existing site?
Retrofitting continuous combustion and composition sensing onto an existing flare stack typically takes two to four weeks, since it does not require shutting down the flare or modifying the stack structure itself. Full ESG reporting integration usually follows within another two to three weeks.
Does flare gas recovery software integrate with existing SCADA systems?
Yes — flare monitoring platforms are typically designed to pull from existing SCADA historians and flow meters rather than replacing them, adding an analytics and reporting layer on top of data you already collect. Talk to support about your current SCADA configuration to confirm compatibility.